
Abstract
Gears are integral components of industrial machines that are used for converting power and motion in different industrial processes. Effective monitoring of gear health and early detection of their faults is essential. It assists in averting sudden shutdowns and, in addition, reduces the costs of maintenance while at the same time increasing the efficiency of the production process. This paper proposes an approach for gear fault prognostics and condition monitoring under variable speed and flexible load conditions using vibration data. The approach involves the utilization of Artificial Neural Network (ANN) in combination with signal processing techniques to analyze the gear vibrations in induction motors (IMs) with the aim of establishing the efficiency of the gear system in different conditions of variable loads and speeds. This real-time data is recorded from the two sensors that are fixed on the exterior of the induction motor horizontally and vertically. In addition, this methodology consists of data collection, data cleaning, and data preprocessing, enhancing the ability of deep learning models, leading to accurate predictions and classification of gear faults. The models are tested and evaluated for different evaluation metrics and prove to be very effective in monitoring the overall health of gears and detecting their faults. The variable load and variable speed models were able to achieve accuracies of 96.44% and 93.82% respectively. The precision, recall, and F1 score are 0.97, 0.96, and 0.96 for the variable load model, while 0.96, 0.94, and 0.94 for the variable speed models.
Introduction
Gears are an important element in many mechanical systems and thus play a vital role in different sectors like manufacturing, automotive, aerospace, and power generation industries. In this regard, to ensure smooth functioning in industries, it is essential to manage the health monitoring system of gears as these mechanical parts gradually undergo wear and degradation or even a potential failure. 1 The failures in gears can occur for different reasons, including wear, fatigue, pitting or spalling, misalignment, and chipping. It is imperative that these faults are recognized prior to the occurrence of catastrophic failures and the subsequent reduction of unplanned interruptions. 2 For decades, gear fault detection and maintenance have involved relying on specific maintenance cycles and scheduled checks, which at times may not capture incipient flaws or even account for new operating conditions experienced in a system. 3 Over time, there has been an increasing concern for working on more sophisticated condition monitoring and prognostic methodologies that would enable clever monitoring and predictive maintenance on gears by using sensors and data analysis techniques.
Vibration analysis is by far one of the most efficient techniques that can be used in diagnosing gear issues and, in general, the condition of rotatory equipment. Vibration signals produced by gears contain valuable data regarding their dynamic behavior, including characteristic frequencies, harmonics, and fault-induced patterns. 4 Researchers can identify the position of faults and the time when gears appear to be under abnormal operation, recognize incipient faults, as well as estimate the gear’s remaining useful life by analyzing the vibration data. Vibration patterns are acquired using industrial equipment and motors through vibration sensors that are mounted on machine surfaces. Motor shafts are employed to transfer vibration patterns to the sensor. 5 Accelerometers are used as vibration sensors owing to their availability and low prices. 6 Laser sensors provide highly accurate vibration patterns and are expensive, and are not employed on hot industrial equipment surfaces. 7 A microphone can be used to detect and capture sound energy produced by a machine’s gear systems, but it is not favored in industrial settings because it tends to combine background noise with the machine’s sounds. 8 To address this problem speech-processing technique can be used to remove the background noise from the acoustic patterns of the machines. 9 The electrical signals can also be obtained from a sensorless variable speed drives. These electrical signals can be used to predict the fault of the gear system using the change in the viscosity of gear oil.10,11
In this experiment, we have installed two accelerometers on the surface of an IM, one positioned vertically and the other horizontally near the motor shaft. Accelerometers are referred to as sensors in the remaining part of the paper. Sensor1 measures the vibration pattern in mm along the horizontal axis, and Sensor 2 measures the vibration pattern along the vertical axis in mm. The gear system operates under six fault conditions: root crack, surface fault, eccentricity, chipped tooth, missing tooth, and a no-fault condition, at two load levels, 0 Nm and 80 Nm, and three speeds, 500, 1500, and 2400 rpm. The vibration pattern recorded by sensor 1 for the chipped tooth fault under an 80 Nm load and 500-rpm speeds are shown in Figure 1.

Sensor2 data for eccentricity fault at 80 Nm load and 500 rpm.
One of the challenges in gear fault prognostics is the presence of variable load and speed conditions, which can influence the vibration signatures of gears and complicate fault detection and prognosis. Gears operating under variable loads and speeds may experience changes in stress, lubrication conditions, and wear patterns, leading to variations in vibration signals and diagnostic patterns. 12 Therefore, it is important to develop robust prognostic methodologies that can adapt to variable conditions and accurately predict gear health.
The data obtained from sensors is of time series nature, and suitable deep learning techniques will be utilized to inspect the health condition and predict the faults within the gear system. The deep-learning model architecture for time series vibration data consists of recurrent neural networks (RNNs) for capturing sequential dependencies, convolutional neural networks (CNNs) for feature extraction, and artificial neural networks (ANNs) for feature extraction, collecting long-term dependencies and sequential data. Attention mechanisms may be incorporated to dynamically weigh the importance of different time steps or features. Output layers depend on the task, with softmax layers used for classification and linear or dense layers for regression. Regularization techniques like dropout and L2 regularization are used to resist overfitting, and optimization algorithms like Adam or RMSprop are used for efficient training. Data preprocessing includes normalization and handling missing values, and model performance is assessed with appropriate metrics, including accuracy or mean squared error. In this paper, we have used ANN for fault prediction and classification for a variety of reasons provided in detail in the methodology section. Our research aims to address the following objectives:
Develop a framework for feature extraction from vibration data to capture relevant information about gear health and performance.
Investigate deep-learning algorithm for fault diagnosis and detection in gear systems operating under varying conditions based on previous vibration data, and load and speed profiles.
Validate the proposed methodology using real-world vibration data collected from industrial gear systems operating under variable load and speed conditions.
By integrating signal processing techniques, deep learning algorithms, and domain expertise, we aim to develop a robust methodology for gear fault prognostics and condition monitoring that can enhance industrial machinery and equipment’s reliability, safety, and efficiency.
The rest of the paper is organized as follows: Section “Literature review” provides the related work, followed by the methodology, data analysis, and model architecture in Section “Methodology.” Results and discussion are provided in Section “Results and discussion” of the paper. Section “Conclusion” of the paper concludes the paper with future recommendations and challenges provided.
Literature review
Various techniques and algorithms are established and deployed to supervise the health condition of machine gear systems. These techniques include different statistical modeling such as Statistical process control, Multivariate Statistical Analysis, and Hypothesis testing. Signal Processing techniques used for fault prediction and classification include time domain and frequency domain analysis, wavelet transform, and Fourier transform. Recently, researchers have deployed deep learning algorithms for the health monitoring of gear systems. The deep-learning models involve Recurrent Neural Networks (RNN), Convolutional Neural Networks (CNN), Transformer-based models, and Ensemble methods. Authors in Chen et al. 13 used a modified Support Vector Machine to identify the gear faults, and they called it the Fisher-Kernel Support Vector Machine (FKSVM). Experiments proved that the proposed FKSVM model has substantial advantages over other traditional algorithms for gear systems’ fault diagnosis. Gundewar and Kane 14 compare advanced signal processing methods for fault prognostics and detection of gear systems. The study evaluates the effectiveness of techniques like empirical mode decomposition, wavelet transform, and Hilbert-Huang transform in extracting fault features from vibration data in various fault conditions. A technique to investigate the crack on the surface of spur gears was proposed by Patel and Shakya. 15 The vibration pattern for gear crack condition was explored using short-time Fourier transform and vibration mode decomposition. Validity of the proposed methodology is established by comparing it with different machine learning techniques. Farhat et al. 16 employed numerical techniques for the detection of root crack faults and eccentricity faults in single-stage gear systems; they employed short-time Fourier transform, squared envelope spectrum, Fast Fourier transform, and Kurtogram to detect vibration patterns of faults for different operating conditions. Cui et al. 17 employed dictionary decomposition and multi-atom match techniques to analyze gears for different faults in a high-speed milling machine used in steel processing. Yan et al. 18 proposed the remaining Useful Life (RUL) estimation model using the LSTM network along with the extraction of frequency domain features of raw vibration signals. In the initial step, they extracted the signal health index by computing the frequency domain features. In the second step, LSTM is used to generate the target output of the remaining useful life prediction. Liu et al. 19 proposed a fault detection model using the Finite Element Method (FEM) simulation and the Extreme learning machine (ELM). FEM is explored to collect the fault samples, then, the ELM training process is achieved. In the next step, the collected vibration signals of the gear system are used as a sample of ELM to detect the fault types. Bouzouidja et al. 20 used a heterogeneous signal processing method to detect and classify gear fault conditions. They used signals obtained from current, voltage, and vibration sensors. Various machine-learning models, such as Support Vector Machine, Random Forest, and K-K-Nearest Neighbor (KNN), were employed for fault classification. They were able to achieve 100% accuracy for all three models. Hasegawa et al. 21 proposed an adaptive condition monitoring approach for gears using online learning techniques. The study develops algorithms that can adapt to changes in different operating and load variations, providing real-time insight into gear health and performance.
Tang et al. 22 propose adaptive prognostics models for gear systems using transfer-learning techniques. The study explores the transfer of knowledge from one gear system to another to improve the robustness and the generalization of prognostic models in varying conditions. Boggio 23 validated prognostics models for gear systems in aerospace applications through experimental validation. The study collects vibration data from gear systems installed in aircraft and evaluates the performance of prognostics models in predicting gear health and the remaining useful life (RUL) under variable load conditions. Sahoo et al. 24 investigated the application of various machine-learning algorithms, such as decision trees, support vector machines, and neural networks, for gear fault diagnosis and prediction. The authors explore different features extracted from vibration signals and other monitoring parameters to train and evaluate the performance of machine learning models in predicting gear faults. Beqiri et al. 25 proposed a prognostic framework for gear systems using machine-learning algorithms. The study integrates vibration data, operational parameters, and maintenance records to train predictive models that estimate the remaining useful life (RUL) of the gear systems and predict future fault occurrences in railway systems. He et al. 26 proposed a special deep-learning method for gear fault prediction with the help of long short-term memory (LSTM) networks. The research explained the effectiveness of LSTM networks in capturing the temporal dependencies in vibration data and making accurate predictions about future gear faults. Afia et al. 27 investigate the use of ensemble-learning techniques, for example, random forests and gradient boosting, for gear fault prediction in wind turbine gearboxes. The analysis combines multiple base learners to create a robust predictive model that integrates information from diverse sources, including vibration data, temperature, and oil analysis. The study in Lee et al. 28 used vibration and thermal data sets from the gearboxes of two extruder machines. They used an Autoencoder with an LSTM model to analyze and classify the gear faults. They were able to achieve an accuracy of 97.42% in recognizing the malfunctions and defects in the gearboxes of the extruder machines. Owolabi et al. 29 used the Artificial Neural Network along with the Finite Element Method to investigate and analyze the structure and failure of the gearbox system in the wind turbine. The authors were able to observe high prediction and classification accuracy using the hybrid model. Wang et al. 30 proposed a model to diagnose the faults in wind turbines using a digital twin model. The empirical-mode decomposition (EMD) method was utilized, and a model combining atom search optimization (ASO) with support vector machine (SVM) called ASO-SVM was presented for diagnosing the faults in the planetary gear. A digital twin model was employed for the fault diagnosis, continuously updating based on diagnostic outcomes. The Unity platform was used to implement the digital twin fault detection system. The experiment results validate the viability of the proposed system for real-time fault detection in the planetary gear of wind turbines. Kumar et al. 31 introduced a very useful approach for the fault diagnosis in gearbox utilizing higher-order moment (HOM), specifically focusing on the logarithmic amplitude of HOM (LHOM) as a distinct property, departing from conventional time domain features. The study utilizes three benchmark gearbox datasets featuring various localized fault conditions to validate the strength of the LHOM approach. The analysis results obtained from the three distinct benchmark data sets show that LHOM can also be used as an extracted element for fault diagnosis other than the conventional time-domain features. Zhou et al. 32 presented a novel deep convolutional-generative adversarial network (DCGAN) for gear fault diagnosis, with the goal of addressing limitations in training data availability. The framework focuses on balancing the adversarial effect between the generator and discriminator components within the network architecture. Case studies highlight the promising accuracy as well as the robustness of the new technique in gear diagnosis.
A little literature has been reported to explore the gear fault prognostic and condition monitoring under variable load and speed using vibration data. The algorithm used for fault prognostics uses traditional time domain or frequency domain analysis, or statistical parameters to detect gear faults. Deep learning models have very little been investigated for condition inspection of gear systems with variable conditions. One of another biggest challenges faced by researchers while predicting the health of gear systems in the variable conditions of load and speed in combination with different fault types, is having complex vibration patterns. This research paper undertakes this challenge and divides the research into two experiments. The first experiment solves the variable condition of loads (0 Nm and 80 Nm) with six different fault types. It is challenging to classify and predict the exact fault under variable load among the twelve classes (6 faults under 2 load conditions). The second challenge was to correctly predict the fault type under variable speed conditions (500, 1500, and 2400 rpm) for the six fault types. This is more challenging to make a correct prediction for eighteen classes (6 faults under 3 speed conditions).
Methodology
The step-by-step methodology is presented in Figure 2. The process starts with data collection and cleaning. The data consists of vibration data points collected from helical gears via accelerometers installed over the machine’s surface. The data is cleaned from outliers, missing values, correcting errors, and other inconsistencies. The data preprocessing steps include data encoding, data rounding, and data balancing. Two models are trained and tested for variable speed and load conditions. The cleaned and preprocessed data is fed to the deep learning models. The models are trained with training data, and lastly, the models are tested and evaluated with test and validation data. Further details are provided in the following paragraphs.
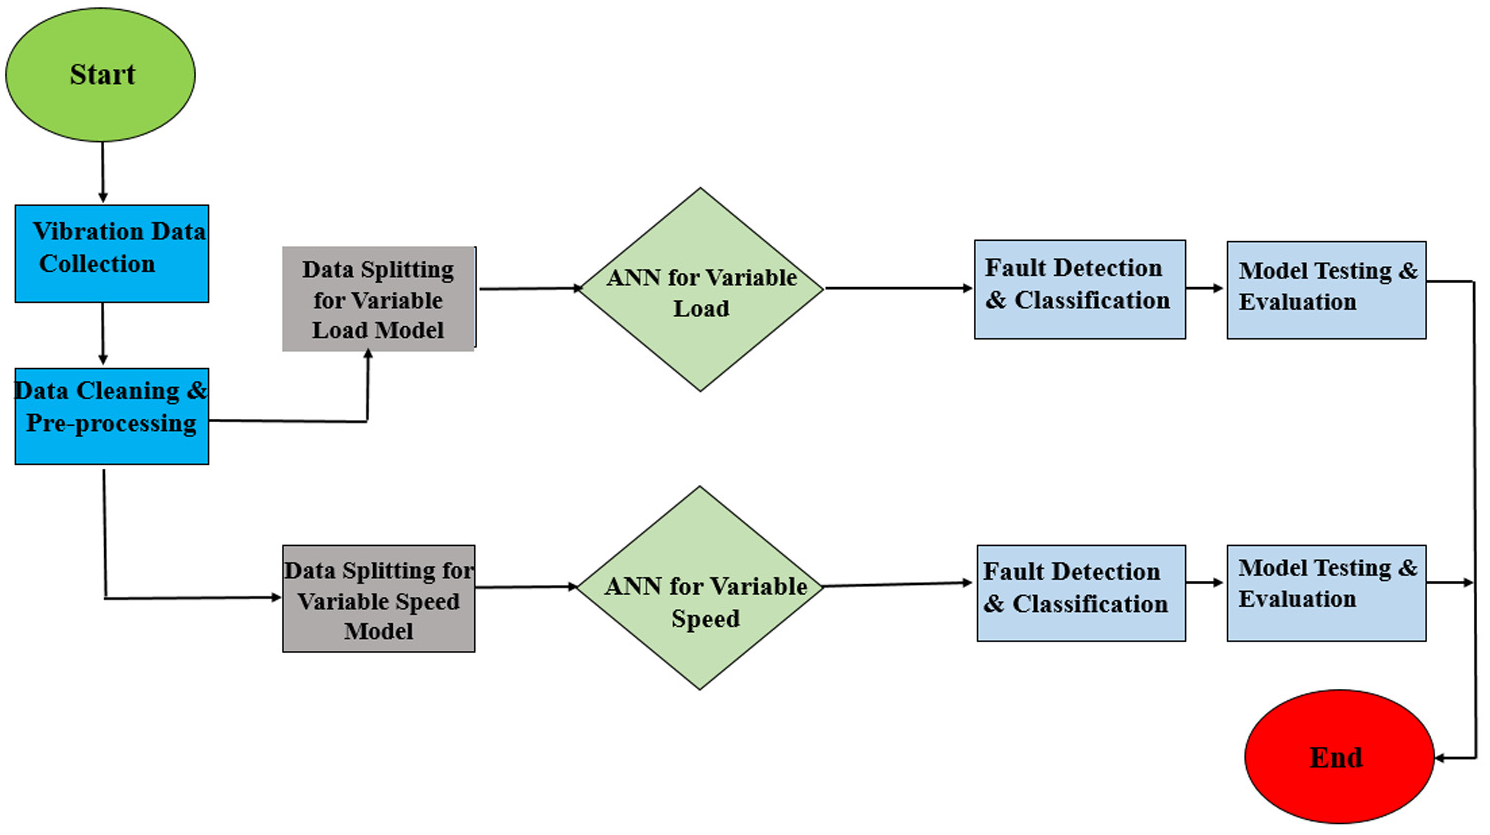
Methodology flowchart.
In this methodology, vibration data were extracted with two installed accelerometers near the motor shaft. Sensor 1 is pointing in the horizontal direction along the x-axis, and Sensor 2 is pointing upwards in the direction of the y-axis. These sensors gather vibration signals, which are recorded as individual data points in CSV files on the database server. The experimental setup is provided in Figure 3. The collected data generated by the sensors is passed to the ANN engine using the internet gateway. The ANN engine makes fault prediction and classification based on the signal pattern. The database server stores the results and generated data from the sensors. Finally, the health of the gear is monitored and displayed as predicted by the ANN engine.
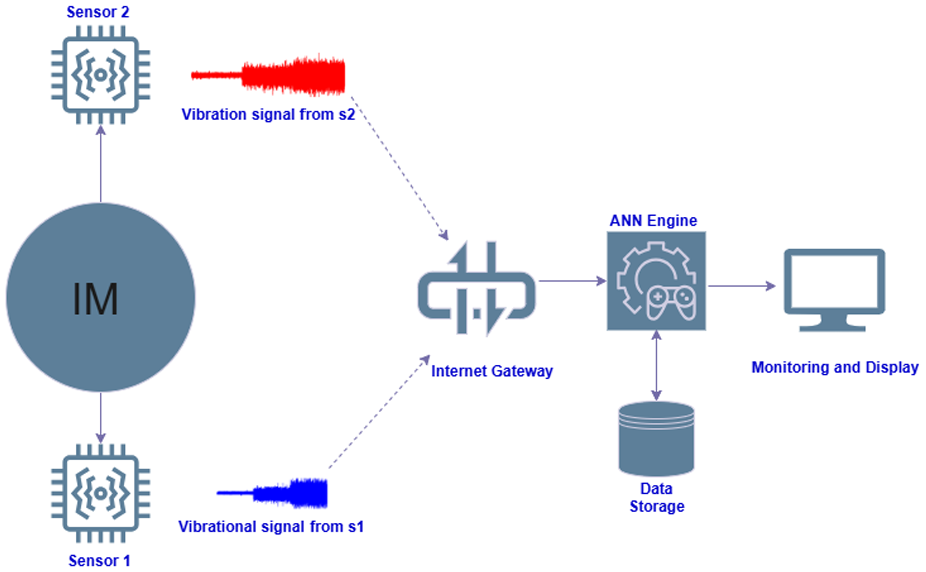
Experimental setup.
The sampling rate is of 5000 points per second (sampling time of 0.0002 s), and produces 900,000 points for each sensor. For the variable load experiment, gears were tested at two levels of loading, 0 and 80 Nm. The brake attached to the shaft controls the load. The speed is controlled with an Inverter. The sampling data is recorded for six conditions of the gear, namely missing tooth, eccentricity fault, surface faults, no-fault, chipping tip, and root crack. The six conditions of data are recorded for each of the two loads. This gives us 12 classes out of the data for the variable load model (6 faults × 2 loads). Each class has 75,000 data points and a total of 900,000 points. In an independent variable speed experiment, gears rotated with three distinct speeds: 500, 1500, and 2400 rpm. An inverter is used to regulate speed while running at a constant load. These same six states of fault were used in each of these speeds to produce 18 classes (6 faults × 3 speeds), with each class containing 50,000 points for a total of 900,000 points. In each of these experiments, resultant vibration data were preprocessed, and the dataset was divided into 80% for training and 20% for validation purposes. This labeled and structured dataset was used in training the classification algorithm (Artificial Neural Networks) based on learned vibration behaviors.
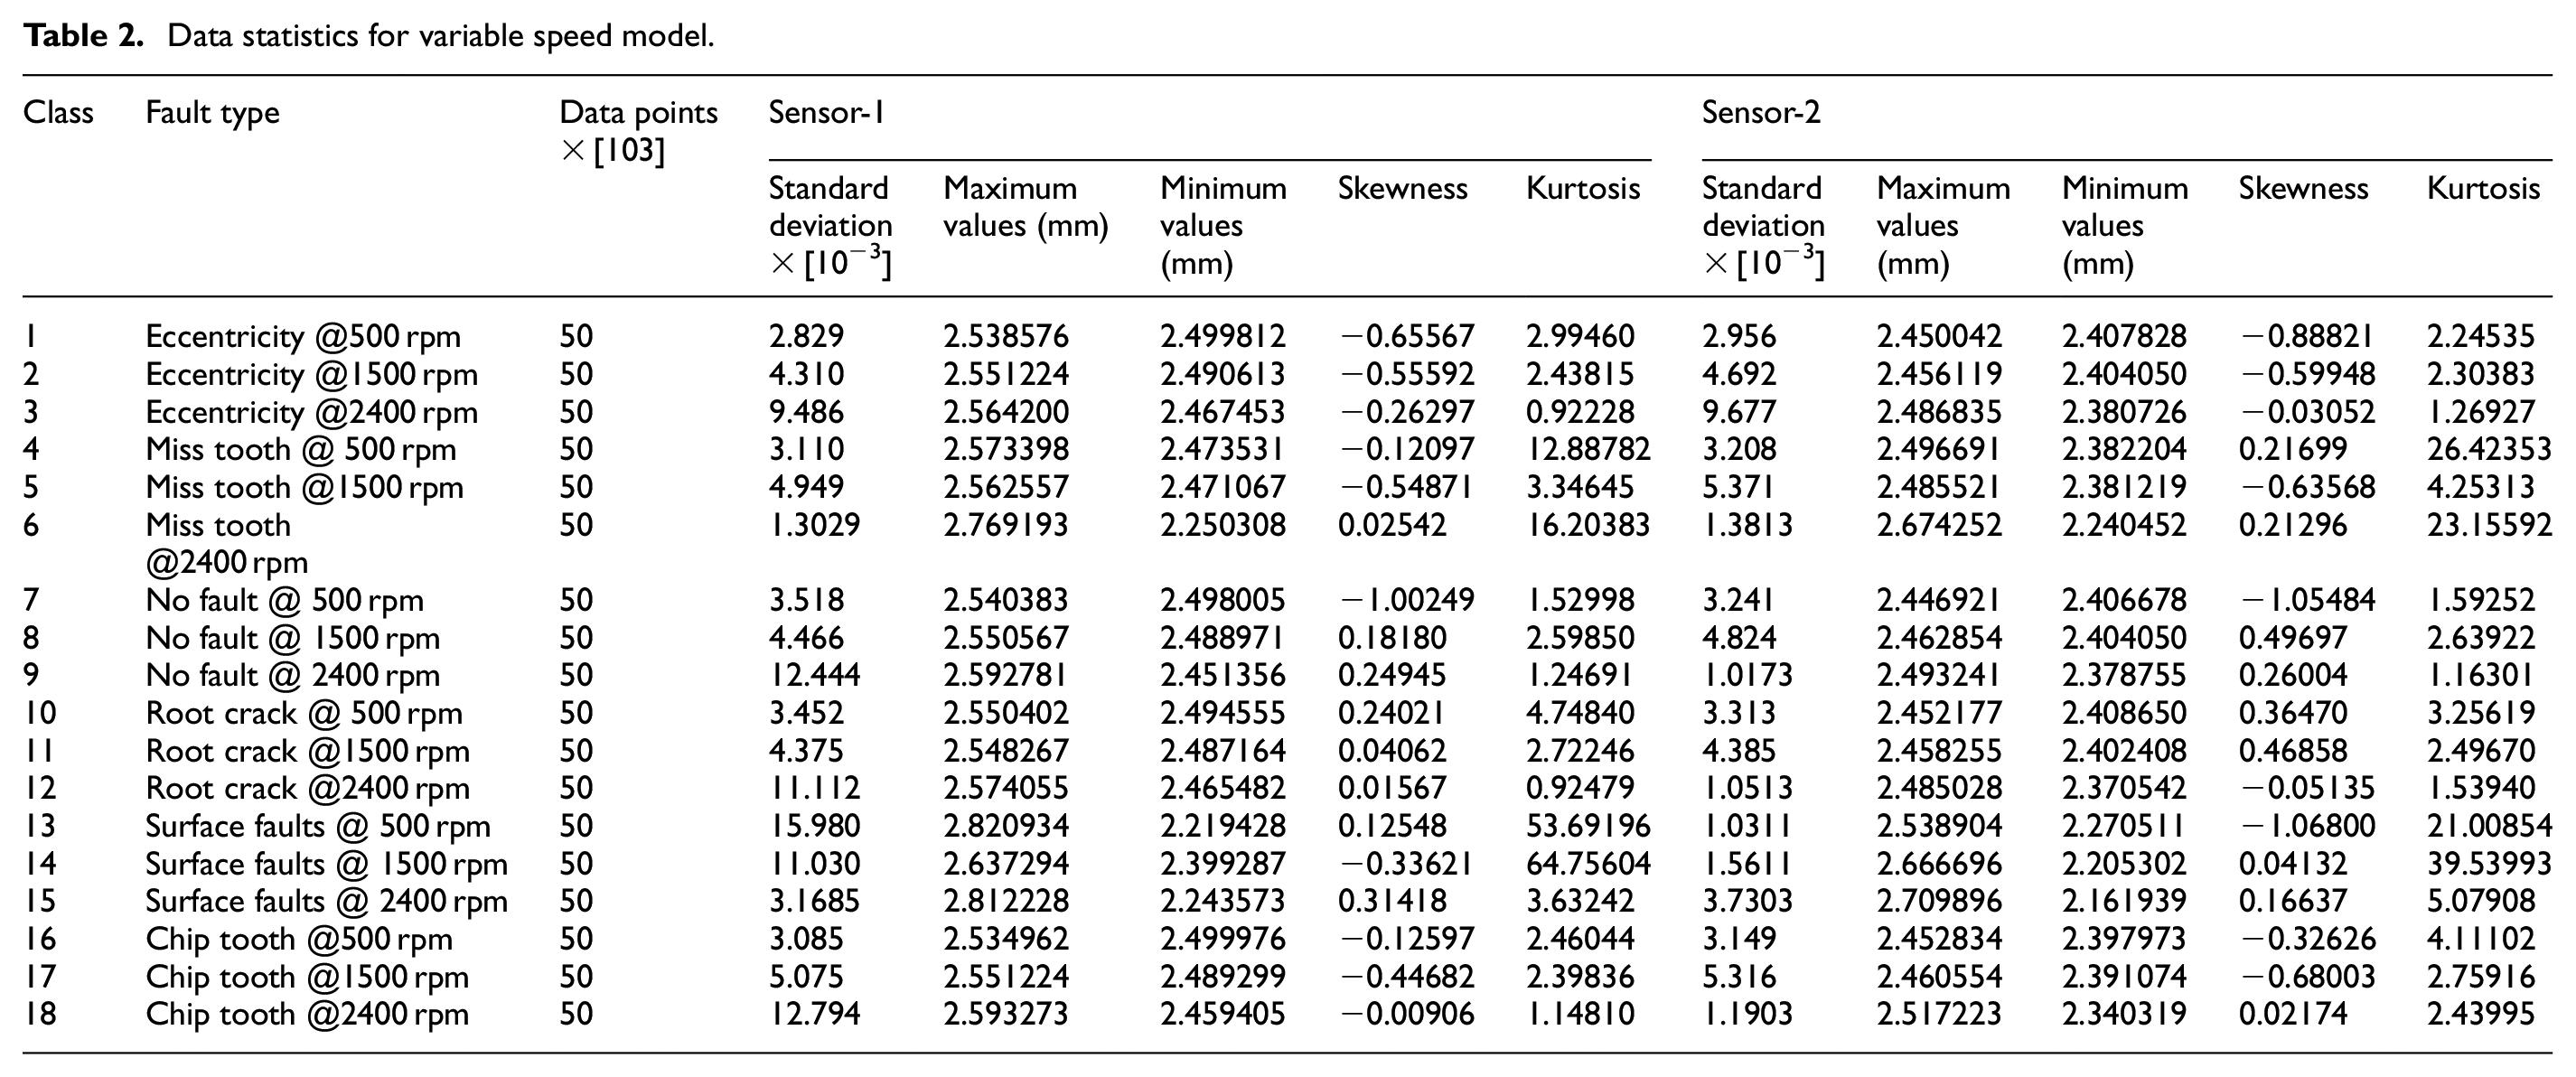
Tables 1 and 2 give the number of data points and statistical parameters, for example, standard deviation (SD), maximum, and minimum of the sensor1 and sensor2 data for different classes of both models.
Data statistics for variable load model.

Data statistics for variable speed model.
The pie chart in Figures 4(a) and (b) shows the data balance of training and test data for each class. Each of the classes contains 8.3% of the total data for the variable load model and 5.6% for each class of the variable speed model.
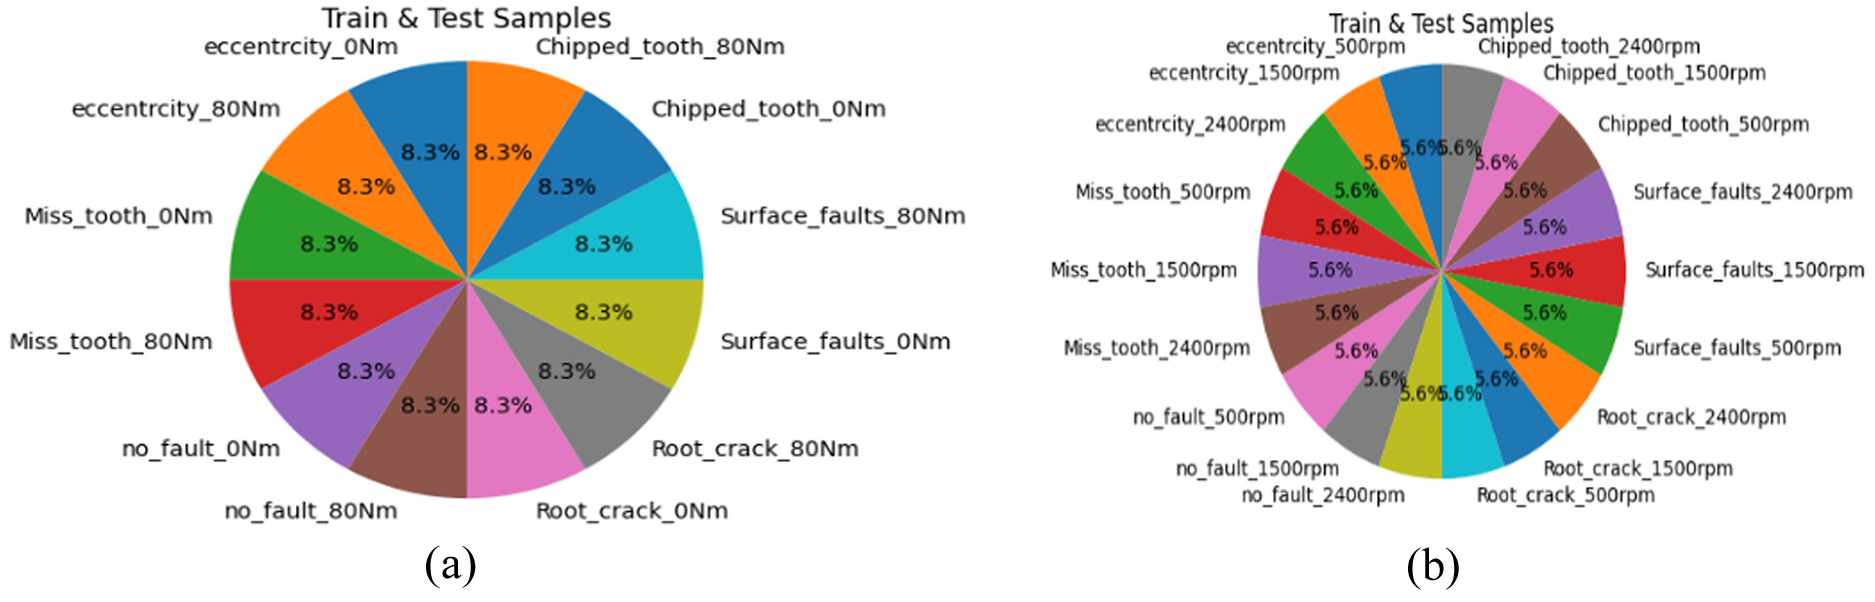
(a) Pie Chart of training and test data samples for variable load model and (b) Pie Chart of training and test data samples for variable speed model.
The data in the CSV file has six columns, namely sensor1, sensor2, time of data recording, load, speed, and fault conditions. The data before cleaning and preprocessing is shown in Table 3.
Data before preprocessing.

Data normalization is performed on the sensor data, the missing values are replaced with average values, the time data is converted from hr: min: sec format to seconds, and the fault conditions are represented using label encoding, a technique used to transform categorical labels into the numerical format. Min-max normalization is applied to the sensor data. The final data frame, which has undergone cleaning, and preprocessing is presented in Table 4.
Data after preprocessing.

The data distribution plot of fault conditions at different loads is plotted in Figure 5(a) to (l), only sensor1 data is plotted. We have the number of samples recorded on the x- and y-axis gives the displacement in the vibration in mm. The data statistics are provided in Tables 1 and 2.

Distribution of sensor 1 data for different fault conditions.
It can be noticed from Figure 5(a) through (l) that eccentricity faults at 0 Nm load show mid-range displacement, and frequencies, while at 80 Nm load it displays higher displacement and frequency points. For the missing tooth fault, 0 Nm load results in mid-range displacement and low frequency, whereas 80 Nm load shows low displacement and frequency data points. The no-fault condition at both 0 Nm and 80 Nm exhibit mid-range displacement and frequency points, with a slight increase in high data points in 80 Nm. In the case of a root crack, both 0 Nm and 80 Nm produce high displacement and high-frequency points, with a marginally higher number of data points at 80 Nm. The surface fault for 0 Nm has more points of higher displacements in the center of the plot and for 80 Nm; there are points of higher displacements in the center and in the last set of points Chipped teeth at 0 Nm load show mid-frequency with high displacement points, while 80 Nm load presents high frequency as well as high displacement points. A similar behavior is exhibited by gear vibration pattern when analyzed at variable speed. These differences in vibration patterns for different fault conditions allow deep learning models to predict and classify the different fault types.
Models architecture
The collected vibration data is time series data, making the Artificial Neural Network (ANN) a preferred choice over other deep learning models for several reasons. Firstly, carefully selected ANN architecture has shown high performance in time series classification problems because it is efficient for time series data when it comes to capturing long-term dependencies. 33 Secondly, optimizers like Adam and RMSprop within an ANN framework can help address the vanishing gradient problem. 34 Thirdly, the flexibility and versatility of ANN allow it to be applied across various domains, including speech recognition, time-series analysis, and natural language processing. 35 ANN is preferred over other models like RNNs and LSTMs, which are indeed designed for sequential time series data, Our application involved a large volume of segmented, fixed-length time series windows. In this context, traditional ANN architectures offer a more computationally efficient solution with competitive accuracy, especially when long-term temporal dependencies are limited or already captured in each window. CNN has been the best choice while dealing with an Image dataset. As such, applying a CNN to vibration data would require transforming the data into images, which adds complexity without a guaranteed performance gain. Table 5 shows the structure of the ANN model used for variable load conditions. The dataset is split into 80% for training and 20% for testing. The input shape is (720,000, 4), and the batch size of 64 is used. The first layer is a flattening layer to transform the data into one-dimensional format. The second layer is a dense layer with 64 units and employs a level-1 regularizer with a rate of 0.01 and Relu activation function. The third layer is also a dense layer with 32 units and employs Relu activation and a level-2 regularizer with a parameter of 0.001. The output layer is a densely connected layer with a softmax activation function. Parameters for each layer are presented in Table 4. Adam optimizer with a learning rate of 0.001 is used to train the model and categorical cross-entropy is employed as the loss function. The model is trained for 50 epochs, and evaluated for F1 score, accuracy, precision, loss, recall, and roc score. The results are presented in the next section.
ANN model for variable load “Sequential_1.”
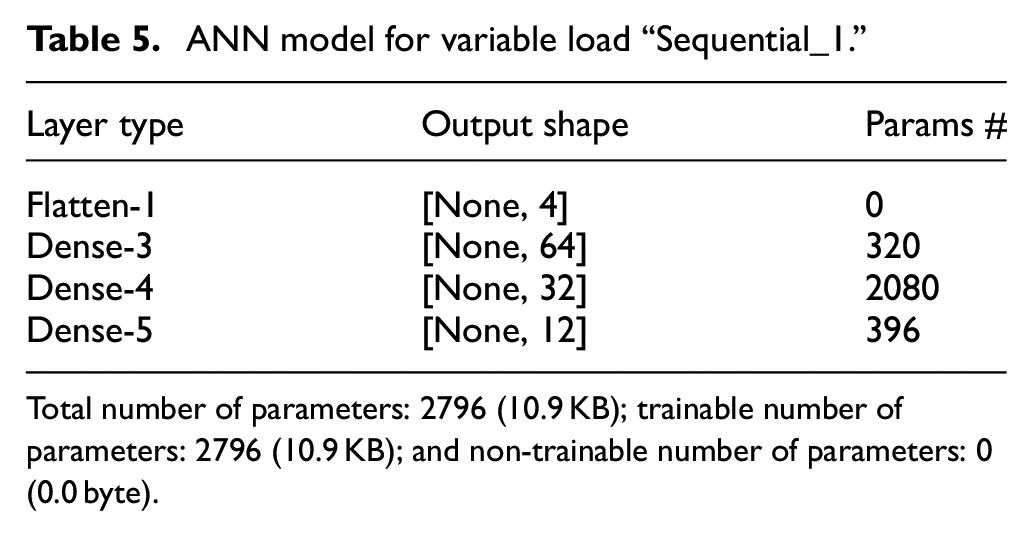
Total number of parameters: 2796 (10.9 KB); trainable number of parameters: 2796 (10.9 KB); and non-trainable number of parameters: 0 (0.0 byte).
Table 6 tabulates the architecture of an Artificial Neural Network (ANN) model created for fault classification under variable speed conditions. The shape of the input data is (720,000, 4), indicating 720,000 observations with four features each. The dataset has been divided in such a manner that 80% of it has been used for training, while 20% has been set for testing. The flow of this model consists of a first flattening layer so that the input can be reshaped to pass through it. There are then two fully connected dense layers with 128 and 32 neurons, respectively, utilizing the Relu activation function to introduce non-linearity. There is an output layer of 18 neurons that represent 18 distinct fault states and uses a softmax activation for multi-class classification. There are 10,066 total trainable parameters of this model (approx. 39.32 KB), so it stays efficient in terms of computing and memory cost. There has been a minimal learning rate of 0.0001 to ensure stable convergence while training, and when it comes to optimizer and regularization techniques, these are the same as have been utilized in the case of the variable load model. Compared to variable load architecture, significant changes include an expansion in terms of neurons in the latter and third layer, so that it can deal with higher complexity associated with variable speed fault designs. Overall, that model stays small but capable in terms of handling high-dimensional input and with large numbers of fault classes.
ANN model for variable speed “Sequential.”

Total number of parameters: 10,066 (39.32 KB); trainable number of parameters: 10,066 (39.32 KB); and non-trainable number of parameters: 0 (0.00 Byte)
Results and discussion
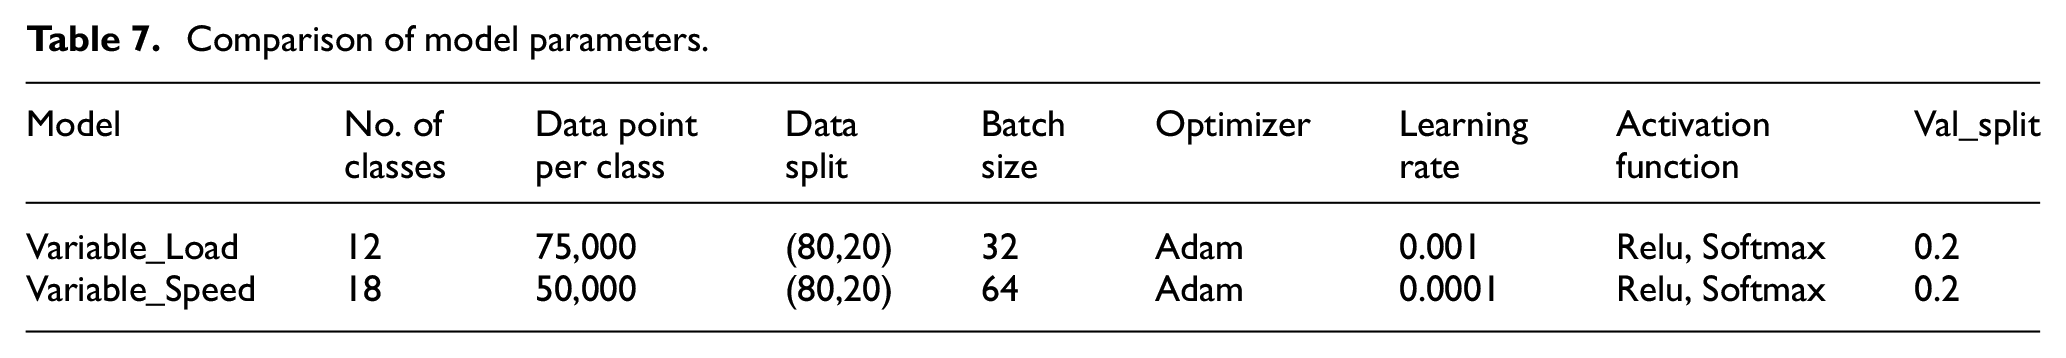
Table 7 Results of the variable speed and variable load models are provided in terms of precision, recall, F1 score, loss, and accuracy. The accuracy plot of training and validation data is presented in Figure 6. it can be noticed from Figure 6 that the variable load model converges at the 36th epoch with a training accuracy of 98.8% and validation accuracy of 98.7%. The training and validation losses are presented in Figure 7. The training and validation losses are 0.010 and 0.03. The confusion Matrix of the variable load model is plotted in Figure 8. It can be seen that the model is performing exceptionally on all fault conditions with the exception of class 2, class 8, and class 12, that is, the fault of eccentricity at 80 Nm, root crack fault at 80 Nm, and the chipped tooth fault at 80 Nm. These misclassifications for Class 2 and Class 12 arose from the overlapping fault patterns caused by load-induced changes in vibration signatures, which have shifted the characteristic features. Additionally, Class 8 was confused with Class 1 (301 instances), due to weak fault signals under low loads resembling normal conditions. Such misclassifications highlight the challenge of distinguishing faults when load variation introduces non-stationarity and feature ambiguity. Test accuracy is 96.44%, and test data loss is 0.0825. F1 score is 96%, precision is 96%, and recall is 97%.
Comparison of model parameters.

Training and validation accuracies of the variable load model.

Training and validation losses of the variable load model
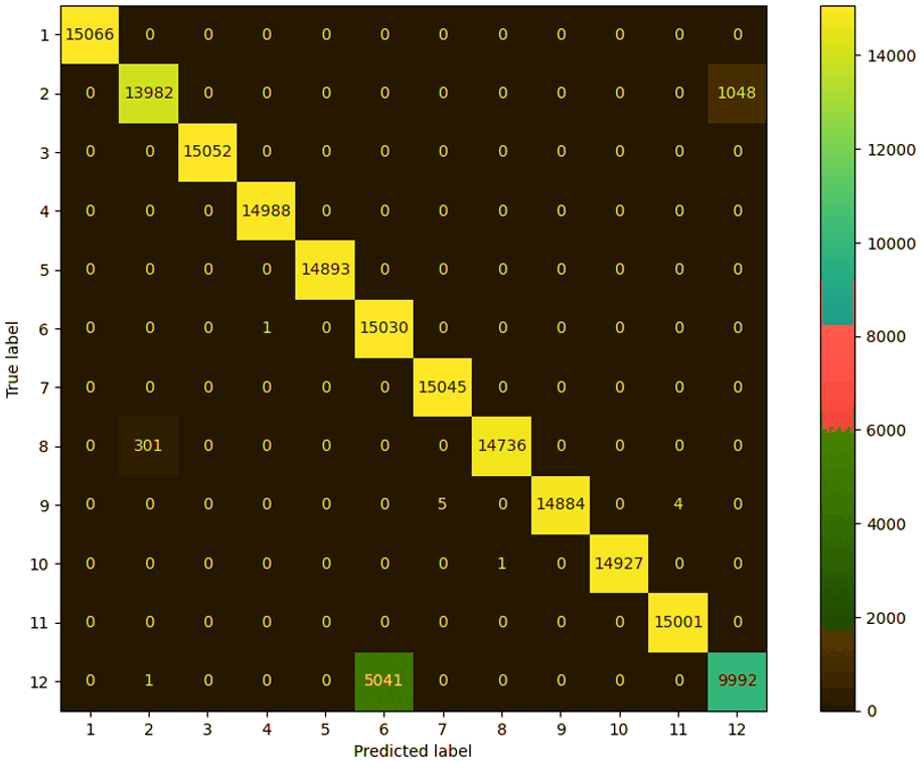
Confusion matrix for the variable load model.
Results of the variable speed model are plotted in Figures 9 to 11. Figure 9 presents the training and the validation accuracies of the variable speed model. It can be seen from Figure 9 that the variable speed model converges in epoch 42 with training and validation accuracy of 92.26% and 91%, respectively. Training and validation losses are plotted in Figure 10 with training and validation loss of 0.1686 and 0.1920. Confusion matrix is plotted in Figure 11; the Figure demonstrates that the model is able to identify all faults with 99.99% accuracy except the class1 and class14, the eccentricity fault at 500 rpm, and surface faults at 1500 rpm. The symmetric confusion between Class 1 and Class 18 (approx. 5000 instances each) suggests both classes produce similar features affected by speed-induced modulation and time warping. Similarly, high confusion between Classes 13 and 14 indicates difficulty in separating progressively severe faults under shifting speed conditions. The test accuracy and loss are 94.42% and 0.1146 respectively. F1 score is 94%, precision and recall are 96% and 94% respectively.

Training and validation accuracies of the variable speed model.

Training and validation losses of the variable speed model.

Confusion matrix for the variable speed model.
Results of both models are summarized in Table 8.
Results of models.
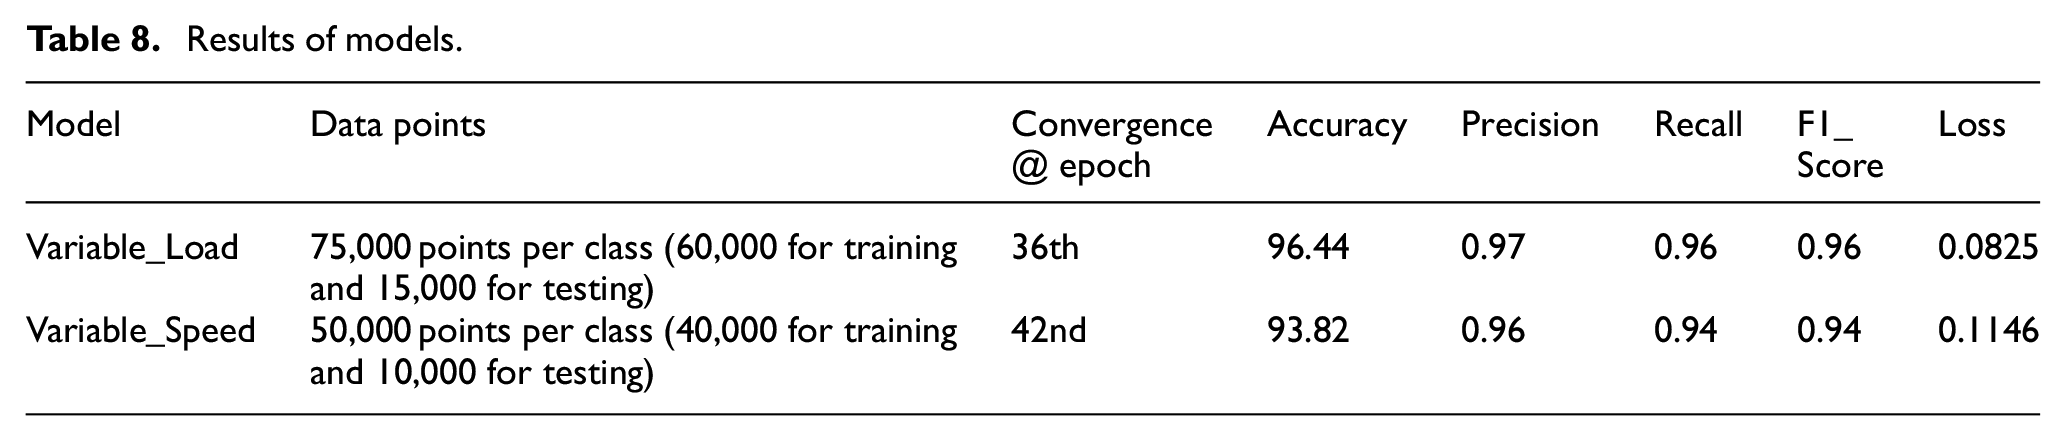
Table 9 provides a comparison of the similar work with variable load model of our research. The authors in Jiang et al. 36 were able to achieve an accuracy of 94% with Empirical Mode Decomposition model. Support Vector Machine with Deep CNN was used to get an accuracy of 90.4%. 37 SVM alone was used and the authors were able to get an accuracy of 91%. 38 Similarly, authors in Lü et al., 39 Bouzouidja et al., 20 and Zhang et al. 40 used Self Organizing Map-Neural Network (SOM-NN), Naive Bayes (NB) and DNN and they were able to predict the fault classes with accuracies of 75%, 92% and 94.3% respectively. It is evident from Table 9 that our work has achieved better accuracy as compare to the previous work.
Comparison with previous works with variable load model.

Our research has been compared with previous work with respect to gear health monitoring at variable speed in Table 10.
Comparison with previous works with variable speed model.

The performance comparison in the table below shows that our proposed ANN-based model in this study outperforms all other provided techniques. The proposed model has achieved the highest accuracy of 93.82%, which demonstrates its superior capability for fault diagnosis under varying conditions. Other models like SVM enhanced with time-domain features (TDF) also perform well, having an accuracy of 92.30%, indicating that well-engineered features can still produce competitive results. 41 While Decision Tree (DT) 42 and KNN 45 methods were able reach an accuracy of 92.1% and 89.5% respectively. The authors were able to get an accuracy of 78.2% while combining SVM with ANN. 43 CNN alone was able get an accuracy of 89.72 % with vibration data for variable speed condition. 44 In Zamanian and Ohadi 44 LSSVM show lower accuracy of 78.2%.
Conclusion
This paper proposed a mechanism to monitor the health of mechanical gear system under variable load and variable speed. Vibration data collected from accelerometers for different fault conditions is used for training the artificial neural network models. We observed that variations in load and speed significantly influence the vibration characteristics of gear systems. The presence of variable load and variable speed conditions introduces additional complexities in fault detection and diagnosis. Two models are trained and tested, one for variable load and another for variable speed fault conditions. The models are capable to achieve accuracy of 94.44% and 93.82%. The models can be used for online condition monitoring of complex gear system under variable condition. Implementing this condition monitoring strategies based on vibration analysis can enhance equipment reliability, minimize downtime, and optimize maintenance schedules, ultimately leading to cost savings and improved operational efficiency. Despite the promising results, our study also identified challenges such as noise interference and signal variability under dynamic operating conditions. Future research should explore methods for integrating and fusing data from more sensors to improve fault detection accuracy and reliability. Future research should also focus on establishing industry-wide standards for evaluating the performance of condition-monitoring algorithms and techniques.
Footnotes
Handling Editor: Qibin Wang
Funding
The author(s) disclosed receipt of the following financial support for the research, authorship, and/or publication of this article: The authors extend their appreciation to the Deanship of Scientific Research at King Saud University for funding this work through Ongoing Research Funding program (ORF-2025-685), King Saud University, Riyadh, Saudi Arabia.
Declaration of conflicting interests
The author(s) declared no potential conflicts of interest with respect to the research, authorship, and/or publication of this article.
Data availability statement
The dataset is available at Kaggle.46