
Abstract
Considering the constraints of customer-defined minimum freshness for fresh products, this study examines the joint distribution of charging-based and battery-swapping electric vehicles with the goal of minimizing total distribution costs. An optimization model for joint distribution route using electric vehicles under the charging and battery-swapping modes is established. An ALNS is improved based on the characteristics of the model and the research problem. Comparative analysis shows that the proposed method in this study effectively reduces distribution costs and optimally plans routes. Experimental results indicate that, under the constraints of customer-defined minimum freshness for fresh products, joint distribution using both charging-based and battery-swapping electric vehicles results in lower distribution costs and better meets the needs of fresh product distribution companies.
Keywords
Introduction
In today’s society, the fresh food e-commerce industry is booming, and consumers are placing higher demands on the quality and delivery timeliness of fresh food products. Ensuring the freshness of products has become a crucial issue in the distribution process of fresh food supplies. Meanwhile, with the increasing awareness of environmental protection and the adjustment of the energy structure, electric vehicles are being more and more widely used in the logistics and distribution field. However, the limited cruising range of electric vehicles requires recharging during the distribution process, which increases the complexity and cost of distribution. Therefore, how to optimize the distribution routes of electric vehicles to reduce the total distribution cost while ensuring the freshness of fresh food products has become an urgent problem to be solved in the fresh food logistics field. Against the background of the combined distribution of charging-type and battery-swapping-type electric vehicles, this paper takes meeting the minimum freshness requirements of customers for fresh food supplies as a constraint condition, reasonably plans the distribution routes of electric vehicles, designs an adaptive large-neighborhood search algorithm, and conducts a sensitivity analysis of relevant parameters, with the aim of finding the optimal distribution plan. This is expected to further improve the research on urban distribution in China and enhance urban distribution efficiency.
Literature review
The Electric Vehicle Routing Problem (EVRP) is an extension of the traditional Vehicle Routing Problem (VRP). Scholars both at home and abroad have conducted extensive research on the electric vehicle routing problem, and the relevant theoretical achievements are extremely rich. This paper will mainly introduce the electric vehicle routing problem from two aspects: the research on the selection of electric vehicle distribution routes considering one charging method and the research on the selection of electric vehicle distribution routes considering two charging methods.
Research on the selection of electric vehicle distribution routes considering one type of power replenishment method
Regarding the research on the selection of electric vehicle distribution routes considering one type of power replenishment method, the existing relevant literature can be reviewed from two aspects: the research on the selection of electric vehicle distribution routes for general goods considering one type of power replenishment method and the research on the selection of electric vehicle distribution routes for fresh goods considering one type of power replenishment method.
General goods distribution refers to the transportation and distribution of various ordinary goods. The characteristics of these goods are relatively stable, and they have relatively low time requirements. However, factors such as cost, efficiency, and environmental protection still need to be considered. In contrast, fresh goods have stricter requirements for distribution time. Many fresh items, such as fruits, vegetables, meats, and seafood, have a short shelf-life. After a certain period, their quality will decline rapidly and may even spoil. Therefore, strict time windows must be adhered to during the distribution process to ensure that fresh goods are delivered to customers within the specified time.
Research on the selection of electric vehicle distribution routes for general goods considering one type of power replenishment method
The research on the selection of distribution routes for general goods electric vehicles with one kind of power supply method can be divided into two categories: considering single-charging electric vehicles and single-battery-swapping electric vehicles.
Considering single charging-type electric vehicles, the goal is often to minimize the total cost, taking into account aspects such as demand, power consumption, vehicle load, time constraints, and charging strategies. Jie et al. 1 studied the electric vehicle routing problem under the conditions of limited vehicle mileage and quantity from the perspective of splittable demand.
From the perspective of power consumption, the calculation of power consumption can be divided into three categories: linear functions, non-linear functions, and stochastic functions. Linear functions determine the energy consumption of electric vehicles by using constant parameter values for a given metric. Non-linear functions can obtain more realistic results of electric vehicle energy consumption compared to linear functions.
Zhu et al. 2 proposed an improved neighborhood path initialization method using the elite genetic algorithm (EGA). This method takes the energy consumption of electric vehicles as the main component and combines adjacent path initialization. It selects the nearest path from the first suitable customer, thus achieving faster path search and easier identification of the global optimal path. Tahami et al. 3 proposed that each vehicle not only needs to visit customer nodes but may also visit some charging stations before the battery is depleted, and put forward three exact methods for solving the problem. Su et al. 4 constructed and solved a dynamic energy consumption model of electric vehicles by analyzing the correlation between driver characteristics and power consumption.
Pelletier et al. 5 , Raeesi and Zografos, 6 Zhang et al., 7 and Basso et al. 8 used stochastic methods to estimate the energy consumption of electric vehicles.
From the perspective of vehicle load, Kancharla and Ramadurai 9 discussed the electric vehicle routing problem with non-linear charging and load-related discharge (E-VRP-NL-LD). The authors also introduced an adaptive large neighborhood search (ALNS) algorithm to solve the E-VRP-NL-LD and the E-VRP-NL-LD-CCS problem with capacity-constrained charging stations. Wu and Sun 10 established a model aiming at minimizing the cost from the perspective of the impact of load on the power consumption rate and used an adaptive large neighborhood algorithm for solving.
Xiao et al. 11 aimed at minimizing the total cost and studied the electric vehicle routing problem with time windows (EVRPTW), considering the functional relationship between the energy/power consumption rate (ECR) per unit driving distance of electric vehicles and speed and load. Liu and Chen 12 considered the impact of load on the real-time energy consumption of vehicles. By establishing an energy consumption function of power with respect to load weight, they calculated the real-time energy consumption of vehicles to provide a basis for path planning and charging strategies. Zhang et al. 13 considered the charging queuing time under time-varying characteristics and designed an adaptive large neighborhood search algorithm for solving.
From the perspective of whether the battery is fully charged, charging strategies can be divided into full-charging strategies, partial-charging strategies, and hybrid charging strategies. Guo et al. 14 aimed at minimizing the total cost, adopted a full-charging strategy, and combined the charging and discharging characteristics of the battery. They studied the electric vehicle logistics distribution routing problem considering the costs of detours, charging time, and battery wear.
Cheng et al. 15 introduced an innovative strategy in the field of electric vehicle route optimization, namely the partial-charging strategy, which allows electric vehicles to continue driving without being fully charged. Ge et al. 16 introduced a partial-charging strategy, proposed an optimization problem of electric vehicle logistics distribution routing with time windows considering the partial-charging strategy, established an integer programing model for this problem, and designed a hybrid simulated annealing algorithm for solving.
Single battery-swapping electric vehicles have unique advantages in commercial operations due to their fast energy replenishment mechanism of battery swapping instead of charging. However, existing research mainly focuses on the integrated planning of battery-swapping station location and electric vehicle routing. For example, Wang et al. 17 considered the location problem of battery-swapping stations for battery-swapping electric vehicles under soft time windows, while in-depth research on the distribution routing of single battery-swapping electric vehicles is still lacking.
Li et al. 18 used electric vehicles in the battery-swapping mode as logistics freight vehicles, took energy consumption and carbon emissions into account in route optimization. At the same time, since this problem is an NP-hard problem, they proposed an adaptive genetic algorithm based on hill-climbing optimization and neighborhood search that can meet the real-time computing requirements of computers.
Research on the route selection of fresh produce distribution by electric vehicles with a certain power replenishment method
There are relatively few literatures on the Vehicle Routing Problem (VRP) of fresh produce distribution by pure electric vehicles. Regarding the distribution of fresh produce, Deng et al. 19 considered the impact of temperature changes on the decay rate of fresh products during unloading and used an improved genetic algorithm to solve the problem. Pratap et al. 20 proposed that the logistics planning in the perishable food industry must include the coordinated consideration of production-inventory-routing.
Feng and Shi 21 studied the route optimization problem of fresh produce distribution by pure electric refrigerated trucks of the same model to retailers with diverse demands based on the characteristics of fresh produce and pure electric refrigerated trucks. They constructed a mathematical model for the fresh produce distribution routing problem with soft time window constraints for customers and vehicle mileage constraints.
Wang and Shi 22 considered battery loss and charging strategies on the basis of Feng and Shi’s research. Zhao and Li 23 and Wang et al. 24 introduced multi-fuzzy time window constraints and distribution vehicle power constraints according to the characteristics of cold-chain goods and electric refrigerated trucks in a time-varying road network. They established a route optimization model for electric refrigerated trucks with multi-time window constraints considering charging stations in a time-varying road network.
Research on the route selection of electric vehicle distribution considering two power replenishment methods
Most of the research on the joint distribution route selection of electric vehicles with two power replenishment methods focuses on how to optimize the overall distribution network and improve the flexibility and economy of distribution by reasonably combining different types of electric vehicles and scientifically planning charging and battery-swapping strategies. For example, Jie et al., Jie et al. 25 considered the vehicle routing problem of electric vehicles with different loads and sizes. These studies provide important theoretical basis and practical guidance for actual logistics operations, and contribute to promoting the wide application and continuous optimization of electric vehicles in the field of logistics distribution.
Research on the route selection of electric vehicle distribution for general goods considering two power replenishment methods
In current research, the optimization of joint distribution routes considering both charging-type and battery-swapping-type electric vehicles is a relatively under-explored area. Most existing studies tend to model the two types of electric vehicles separately, or assume that the same type of electric vehicle can offer different power replenishment modes, or focus on the mixed distribution of electric vehicles and fuel-powered vehicles. For example, Macrina et al. 26 and Li et al. 27 considered the joint distribution of electric vehicles and fuel-powered vehicles. Hiermann et al. 28 addressed the electric vehicle routing problem by combining traditional cars, plug-in hybrid cars, and electric cars.
Deng et al. 29 took into account that charging and battery-swapping stations offer both charging and battery-swapping power supply modes. With the goal of minimizing costs, they improved a new optimization algorithm, an integer version of the Natural Aggregation Algorithm (NAA), to effectively solve the proposed model.
Chang et al. 30 proposed a two-stage optimization method for the electric vehicle routing problem under a hybrid charging strategy. They constructed a mixed-integer linear programing model for electric vehicles considering three charging strategies: fast charging, slow charging, and fast battery-swapping. Wang and Jin 31 considered the combined charging strategy of battery-swapping and non-linear fast charging under non-linear conditions and verified the significant superiority of the hybrid charging strategy using non-linear fast charging.
Research on the route selection of electric vehicle distribution for fresh produce considering two power replenishment methods
Fu 32 described the route planning problem of electric refrigerated trucks for urban fresh produce distribution. Based on the fact that the same type of electric vehicle can choose from three charging methods: full charging, partial charging, and battery exchange, the objective function was designed. The constraint conditions included the maximum vehicle load limit, customer time window limit, and electric vehicle power limit, and the queuing time at charging stations was also considered. Thus, a mathematical model for the route planning of electric refrigerated trucks aiming to minimize the total distribution cost was constructed.
Wang et al. 33 considered the Electric Vehicle Routing Problem (EVRP) for joint distribution using Wireless Charging Technology (WCT) and Plug-in Charging Technology (PCT).
Related theoretical foundations
Overview of solving algorithms
The main difference between the Electric Vehicle Routing Problem (EVRP) and the traditional Vehicle Routing Problem (VRP) for fuel-powered vehicles lies in the energy replenishment mechanism and related limitations of electric vehicles. For example, electric vehicles have longer charging times and fewer charging stations, which means that more constraints need to be considered during route planning, such as battery range, charging requirements, and charging time. This increases the complexity and difficulty of solving the problem. EVRP is an extension of VRP and belongs to the NP-hard problem. For this kind of problem, the solving methods are mainly divided into two categories: exact algorithms and heuristic algorithms. The advantages and disadvantages of the two types of algorithms are shown in Table 1.
Comparison between exact algorithms and heuristic algorithms.

Comparative analysis of related algorithms
Adaptive Large Neighborhood Search (ALNS), as a type of heuristic algorithm, shows its unique advantages when compared with other algorithms.
Compared with the Genetic Algorithm (GA), ALNS explores the solution space through destruction and repair operations. This approach can more directly optimize the problem structure, while GA generates new solutions through crossover and mutation operations. The destruction operations of ALNS can be designed to be more problem-specific, thus more effectively changing the current solution, and the repair operations are responsible for restoring the feasibility of the solution. This design makes ALNS more effective in dealing with problems with complex constraints.
Compared with the Ant Colony Optimization (ACO) algorithm, ALNS does not rely on the pheromone update mechanism. Instead, it uses an adaptive mechanism to balance exploration and exploitation. Therefore, in ALNS, there is no need to pre-set complex pheromone parameters, which can reduce the difficulty of parameter tuning in practical applications. By dynamically adjusting the intensity of destruction and repair operations, ALNS can automatically adapt to different stages of the search process, thereby more effectively avoiding getting trapped in local optima.
In addition, compared with the Particle Swarm Optimization (PSO) algorithm, ALNS focuses more on local search and neighborhood operations, while PSO searches for the optimal solution through group cooperation. The destruction and repair operations of ALNS can be regarded as local perturbations to the current solution, so as to explore new solution regions. This characteristic of local search makes ALNS more efficient in dealing with high-dimensional and multi-constraint problems.
In general, as an adaptive heuristic algorithm, ALNS shows strong capabilities in solving complex combinatorial optimization problems. Compared with traditional optimization methods and other heuristic algorithms, ALNS can effectively explore the solution space while maintaining the feasibility of the solution through its adaptive destruction and repair mechanism, thus finding high-quality solutions. The comparison of related algorithms is shown in Table 2.
Comparison of related algorithms.

In summary, the electric vehicle routing problem is a hot topic in the current field of route optimization. There are still relatively few research results on the distribution of fresh agricultural products by electric vehicles and the joint distribution of electric vehicles considering different charging types. Moreover, there are some deficiencies in the existing research:
(1) Regarding the classification of electric vehicle models, most classifications are based on differences in purchase cost, battery capacity, and carrying capacity, while few are based on charging types.
(2) In the case of joint distribution, most studies consider the joint distribution of electric vehicles and fuel-powered vehicles, and few consider the joint distribution of charging-type electric vehicles and battery-swapping electric vehicles.
(3) Most literatures on fresh food cold-chain distribution only consider the service time window during the fresh food distribution process and ignore the customers’ minimum requirements for the freshness of fresh products.
Therefore, in the case of a single distribution center, considering the customers’ constraints on the freshness of fresh agricultural products and aiming to minimize the total cost (including charging and battery-swapping costs, time penalty costs, and cargo damage costs), a route optimization model for the distribution of fresh agricultural products by electric vehicles that considers both charging-type and battery-swapping electric vehicles is constructed. An improved adaptive large neighborhood search algorithm is used for model analysis and solution. In the algorithm design, a greedy algorithm is used to design the initial solution. Random deletion, worst-cost deletion, timeout deletion, and distance-based deletion are selected as destruction operators. The model is verified using the classic Solomon dataset. By comparing the results with those obtained by the Gurobi solver and the genetic algorithm, the effectiveness and convergence of the algorithm are proven. Sensitivity analysis of relevant parameters is carried out to find the optimal distribution method, improve domestic urban distribution research, and enhance urban distribution efficiency.
Notation and model construction
Problem description
Consider a simple, discrete, undirected road traffic network
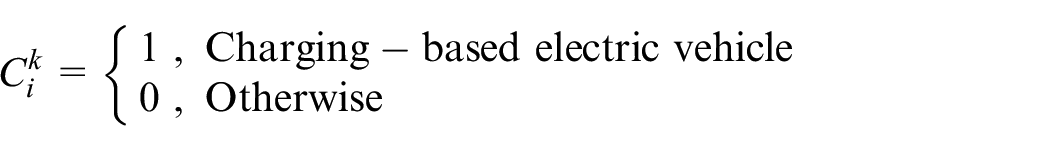
At the distribution center, there are K charging-based electric vehicles and
To facilitate the research, the model is based on the following hypotheses:
(1) The locations, quantities, service time windows, and minimum freshness requirements of demand points are known. Each demand point is served by only one electric vehicle, and each demand point is served only once.
(2) Vehicles depart from the distribution center with a full charge. If the battery level drops to a critical point, the vehicle must visit the nearest charging or battery-swapping station to recharge or swap batteries before continuing the delivery.
(3) For charging-based electric vehicles, only fast charging and full charging are considered, and the charging time depends on the remaining battery level when arriving at the station.
(4) Battery-swapping stations have sufficient battery supply, ensuring that no vehicle will be forced to divert to another station due to a lack of available batteries.
(5) Vehicles depart from the distribution center and return to the center after completing the delivery.
(6) The waiting time of the vehicle is directly proportional to the power consumption, that is, the longer the vehicle waits, the more power it consumes.
(7) The energy consumption of the electric vehicle is only related to the driving distance and has nothing to do with the weight of the loaded fresh agricultural products.
Model formulation and notation
The symbols and parameters are defined as follows:
V: Set of all nodes, where 0 represents the distribution center,
U: Set of customer points,
F: Set of battery-swapping stations,
k: Set of electric vehicles,
∂: The loss coefficient of the freshness of fresh produce,
w: Minimum freshness requirement for fresh supplies by the customer,
v: Vehicle speed, assumed constant,
Q: Maximum load capacity of the vehicle,
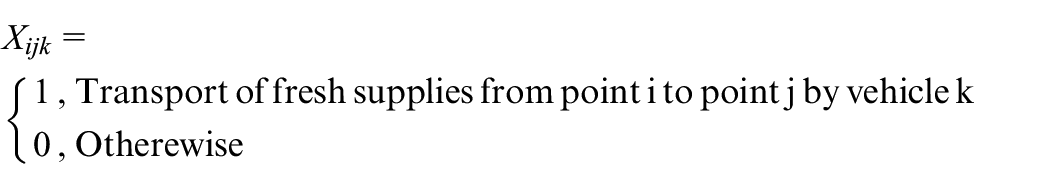
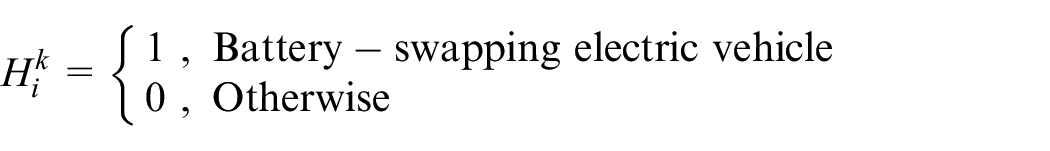
Decision Variables:
Cost analysis
(1) Charging and Battery-Swapping Costs.

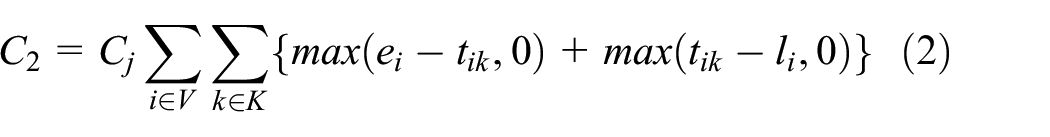
(2) Time Penalty Costs.
During fresh supplies delivery, arriving too early or too late incurs time penalty costs. Assume the time penalty cost per unit is a constant.
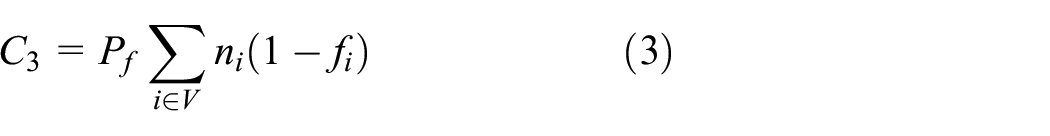
(3) Goods Loss Costs.
Goods loss costs in fresh supplies distribution primarily result from the degradation of freshness, which is affected by temperature and time. Assuming that the temperature remains constant during the delivery process, freshness decay is only time-dependent. With the unit price of fresh supplies
Model formulation
Based on the above analysis, and considering the objective and all constraints, the model is formulated as follows:
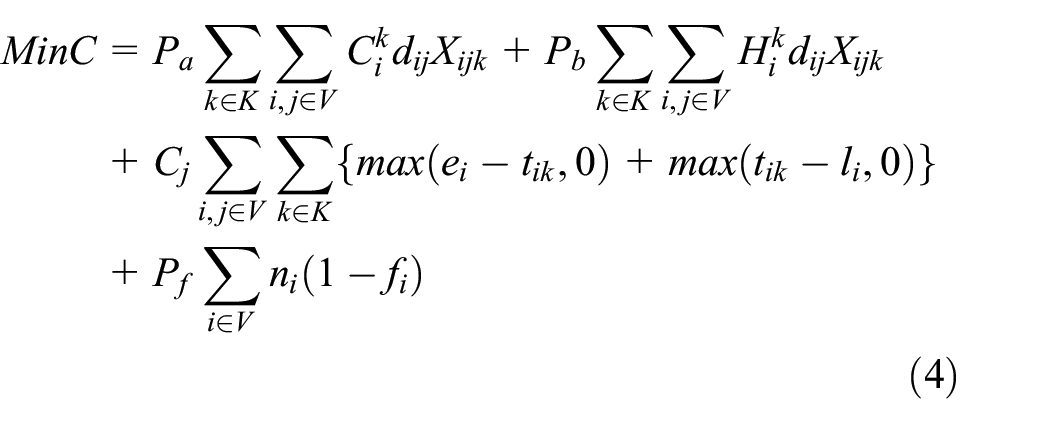


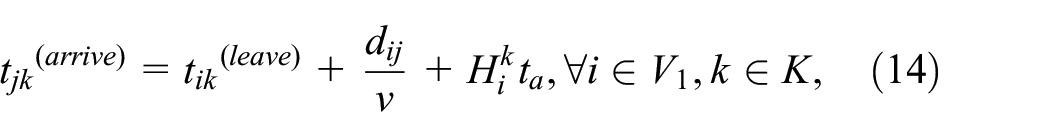


The objective function (4) primarily considers cost-related factors: charging and battery-swapping costs, time penalty costs, and goods loss costs. Constraint (5) ensures that each customer point is visited by one electric vehicle. Constraint (6) stipulates that each charging station can serve only one electric vehicle at a time. Constraint (7) similarly limits each battery-swapping station to serve only one electric vehicle at a time. Constraint (8) enforces the minimum freshness requirement for fresh products at the customer points. Constraint (9) ensures that the weight of the delivered goods does not exceed the vehicle’s maximum load capacity. Constraint (10) specifies the battery capacity limits of the electric vehicle at each node. Constraint (11) governs the relationship between the vehicle’s energy levels as it travels from node i to node j. Constraint (12) ensures time continuity for the electric vehicle at each node. Constraint (13) enforces time continuity when the vehicle travels from charging station i to node j. Constraint (14) enforces time continuity when the vehicle travels from battery-swapping station i to node j. Constraints (15)–(17) represent the 0–1 constraints of decision variables.
Algorithm design
The problem of optimizing joint distribution routes for electric vehicles under charging and battery-swapping modes in a single distribution center for fresh supplies falls under a variant of the VRP. Solving large-scale instances of this problem is challenging, so this paper employs the ALNS algorithm for its solution. Since its introduction by Ropke and Pisinger 34 numerous studies have shown that the it is effective for solving the VRP and its variants. In this paper, a greedy algorithm is used to generate an initial solution and design multiple destruction and repair operators to optimize vehicle routes. The specific steps of the ALNS algorithm are as follows. The algorithm framework diagram is shown in Figure 1.:
Step 1: Using the Split concept, divide the delivery task into multiple sub-routes based on vehicle capacity and energy constraints. Sequentially check the capacity and energy constraints of the routes, and insert a new vehicle where capacity limits are exceeded and a charging station where energy constraints are violated.
Step 2: Use a greedy algorithm to construct an initial feasible solution and set initial parameters.
Step 3: Determine the operator weights, and select destruction and repair operators using a roulette wheel mechanism.
Step 4: Generate a new solution by applying the destruction and repair operators to the current solution.
Step 5: Update the operator weights based on the quality of the new solution.
Step 6: Repeat Steps 2–4 until the termination condition is met.

Framework of the ALNS algorithm.
Construction of initial solution
As a heuristic algorithm, the ALNS benefits from a high-quality initial solution to speed up the subsequent solving process. In this study, a greedy algorithm is used to construct the initial solution, with the following steps:
Step 1: Select a charging-based electric vehicle K for delivery. The vehicle’s departure time, load, and energy levels are initialized with given parameter values, then proceed to Step 2.
Step 2: Determine whether the vehicle K can reach the next delivery point while satisfying the vehicle’s maximum driving range and time window constraints. If satisfied, proceed to Step 3, otherwise, go to Step 4.
Step 3: Search for the nearest customer point j from the current location i of vehicle K. Check whether the vehicle’s load capacity still meets the constraint after adding the demand from point j. If the load constraint is satisfied, designate j as the next delivery point and proceed to the next step. If not, search for the second-nearest customer point from location i. Check whether the load constraint is met after adding the demand from that point. If satisfied, designate it as the next delivery point and proceed to Step 5. If not, return to Step 1.
Step 4: Select a battery-swapping electric vehicle for delivery. Initialize the vehicle’s departure time, load, and energy levels with given parameter values, then proceed to Step 3.
Step 5: Determine whether the vehicle K has sufficient energy to reach the next delivery point and return to the distribution center. If satisfied, proceed to Step 8, otherwise, go to Step 6.
Step 6: Search for the nearest charging station F or battery-swapping station F*. Check if the vehicle has enough energy to reach F or F*. If satisfied, continue to the next step, otherwise, return to Step 1.
Step 7: Evaluate whether the time spent at the charging station F or battery-swapping station F* violates the freshness and time window constraints of the nearest and second-nearest customer points. Prioritize the nearest customer point, if neither satisfies the constraints, return to Step 1.
Step 8: Add all reachable customer demand points to the vehicle’s route. Check if all customer demand points have been added to the vehicle’s route. If satisfied, output all vehicle routes and terminate, otherwise, return to Step 1.
Taking Figure 2 as an example, The distance from the distribution center 0 to customer point 1 is within the maximum driving range of the electric vehicle. To meet the objective function, a rechargeable electric vehicle is selected for delivery. After delivering to customer point 4, the remaining battery charge is insufficient to reach the next customer point 6 and then return to the distribution center. So, the vehicle goes to the nearest charging station to recharge and then returns to the distribution center. This route is added to the initial solution.

Generating the initial solution using the greedy strategy.
The distance from the distribution center 0 to customer point 2 exceeds the maximum driving range of the electric vehicle and also violates the time-window constraint. Therefore, a battery-swapping electric vehicle is chosen for delivery. First, it goes to the nearest battery-swapping station to change the battery and then delivers to customer point 2. After delivering to customer point 3, there is no new customer point that meets the time-window constraint. So, the vehicle directly returns to the distribution center to end the route.
Destruction operators
The set of destruction operators
(1) Random Removal
Multiple customer points are randomly selected from the route and removed. The more customer points that are removed, the greater the destruction. The removed points are added back to the set of customers awaiting routing.
(2) Worst Cost Removal
Each time a customer point is added to the route, it incurs a corresponding cost increase. Worst cost removal refers to deleting the customer point that incurs the highest service cost in the route. The service cost of customer point i is defined as follows:

In formula (18),
(3) Timeout Removal
For each node, the delay time is calculated as the difference between the current time and the node’s latest allowable service time. If the result is negative, it is set to zero. A list is generated and sorted in descending order based on delay times, from which nodes are randomly selected for removal.
(4) Distance-Based Removal.
In the electric vehicle delivery route, arcs are formed from the distribution center to customer points or charging stations. Distance-based removal involves calculating the length of each arc and deleting the arc with the longest distance, provided that the starting point of the arc is neither the distribution center nor a charging station.
Repair operators
The set of repair operators
(1) Random Insertion Operator.
During each iteration, a random insertion position is selected, and the previously removed points are reinserted into the route.
(2) Greedy Insertion Operator.
The greedy insertion operator calculates the objective function value for each feasible insertion point under the constraints of vehicle load and time windows. The customer point with the lowest insertion cost is given priority and inserted into the route.
(3) Maximum Contribution Insertion.
This operator identifies nodes in the current solution that contribute the most to the objective value. These nodes are removed from the solution and then reinserted into more suitable positions, and decide whether to accept the fix based on whether the repaired solution is better than the previous solution. If the new solution is better than the previous one, the change is accepted, otherwise, the original solution is retained to improve solution quality.
Adaptive design
A roulette wheel mechanism is used to select the destruction and repair operators during each iteration. Let Ω represent the set of all operators, where
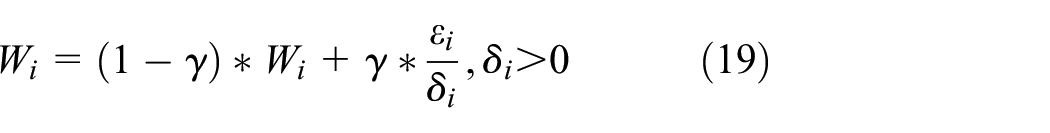

Formula (20) defines the score Ψ assigned to the destruction and repair operators used in the final iteration of the ALNS algorithm. Here, X represents the current solution,
Numerical experiments and sensitivity analysis
The experimental data in this study are derived from the classic Solomon dataset, which includes six different problem instances. Each instance represents a distinct real-world delivery or transportation scenario, primarily covering six categories: C1, C2, R1, R2, RC1, and RC2. Data for charging and battery-swapping stations are based on the work of Schneider et al. 35 who supplemented the Solomon dataset with electric vehicle-related data. The unit driving costs for charging-based and battery-swapping electric vehicles are calculated based on the life-cycle cost (LCC) model for electric vehicle ownership proposed by Ren et al. 36 The cost includes the driving and maintenance cost of electric vehicles, disposal cost, and environmental cost. For battery swap electric vehicles, the battery swap price is calculated as (electricity fee + service fee) × swapped electricity.
At present, there are relatively few battery swapping stations that support all vehicle models. To better reflect real-world conditions, the number of BAIC New Energy battery swapping stations was chosen as a reference. Within the Fifth Ring Road area of Beijing, there are 20 public charging stations, 4 are BAIC New Energy battery swapping stations. The vehicle model is based on the Geely Remote New Energy electric micro-truck, which is the most commonly used in medium and long-haul transportation. Its maximum range is 300 km. The electricity fee was set at 1.2 yuan/kWh, and the battery swap service fee was set at an average of 0.8 yuan/kWh. Each fast-charging electric vehicle takes 90 min for a full charge, while each battery swapping electric vehicle takes only 5 min for a battery swap.
Computational results
The experiments were conducted on a computer with an AMD Ryzen 5 5625U CPU @ 2.30 GHz and 16.0 GB of memory. The algorithm was implemented using Python3.11. The relevant experimental parameters are shown in Tables 3 and 4.
Vehicle Parameters.

Other parameters.
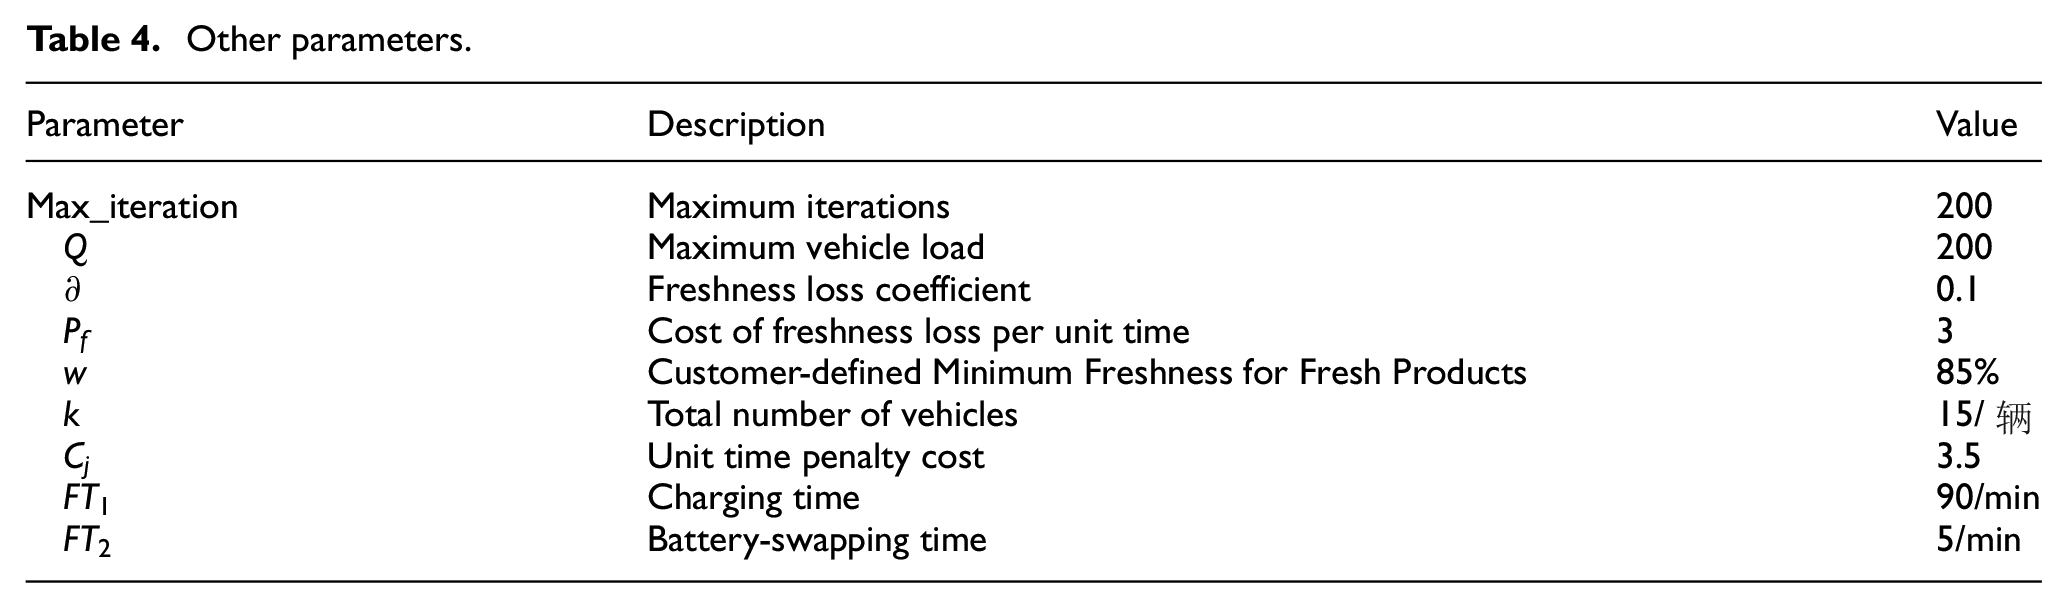
Freshness is a very important indicator that customers pay close attention to when purchasing fresh produce. A smaller freshness loss coefficient means that within the same delivery time, the freshness of fresh products decays at a slower rate, thus reducing the loss of fresh products during the delivery process. Referring to the literature, 23 this paper sets the freshness coefficient as 0.1, and the cost of freshness loss per unit time is 3.
The EVRP is a type of route planning problem. This study employs and designs an ALNS algorithm. To quickly verify the correctness and effectiveness of the model, a small-scale instance is first used for preliminary testing. From each of the six Solomon problem categories, a set of instances containing 10 customer points is selected. Charging and battery-swapping stations from Schneider et al.’s improved Solomon dataset were chosen, and the experiment was run 10 times to obtain the optimal route planning solution. The ALNS algorithm is compared with the Gurobi solver, with the Gurobi computation time limited to 300 s. The comparison results are shown in Table 5.
Comparison of ALNS and Gurobi solutions for small-scale instances.

Note. I represents the number of customer points, F represents the number of charging stations used, H represents the number of battery-swapping stations used, K1 represents the number of charging-based electric vehicles, K2 represents the number of battery-swapping electric vehicles, t represents computation time, and best bound represents the optimal delivery cost.
As shown in Table 5, both the ALNS algorithm and the Gurobi solver can provide similar solutions. In the R1 instance, the ALNS solution is slightly inferior to the Gurobi solver, but the difference is minimal. For the RC1 instance, the ALNS solution is significantly better. Although Gurobi had shorter computation times, this is partly due to the ALNS algorithm’s limitation on the number of iterations. Since the Gurobi solver fails to obtain results for the instance with a scale of 50 customers within 300 s, a comparison is made with the Genetic Algorithm (GA), which is used to solve this kind of problems. The relevant parameters involved in the genetic algorithm are set as follows: assume that the size of the initial population to be generated is 100. To improve the convergence speed of the algorithm, the crossover rate is set to 0.9, the mutation probability is set to 0.05, and the number of iterations of the algorithm is 200. The comparison results of the solutions are shown in Table 4.
To solve the joint distribution problem of fresh supplies using electric vehicles under charging and battery-swapping modes with a single distribution center, the Adaptive Large Neighborhood Search (ALNS) algorithm was employed. The complexity of the problem increases due to the inclusion of charging and battery-swapping stations, charging times, customer constraints on product freshness, and vehicle energy limitations. To ensure the generality and practicality of the algorithm for solving such problems, large-scale experiments were conducted. Instances containing 50 customer points were selected from each of the six Solomon problem categories, using Schneider et al.’s modified dataset for charging and battery-swapping station locations. After running the algorithm 10 times, the optimal solution was obtained. Since Gurobi could not produce results for instances with 50 customers within 300 s, no further comparison was made. Therefore, a comparison was made with the Genetic Algorithm (GA), which is more frequently used for solving such problems. The results of the ALNS algorithm are shown in Table 6.
ALNS results for large-scale instances.

The experimental results show that in the six different categories of Solomon instances, as the scale of customer points and the number of vehicles used increase, the solution time also increases. This indicates that both the scale of customer points and the number of vehicles used can affect the experimental results, which is related to the complexity of the data itself but does not affect the generality and practicality of the experiment. Furthermore, each of the six categories of instances is run 30 times for a t-test with a significance level of 0.05. The symbols “−” and “+” statistically represent being equivalent to or significantly better than the peer tests in the same row. The results are shown in Table 7.
Results of t-test for large-scale instances of ALNS and GA.
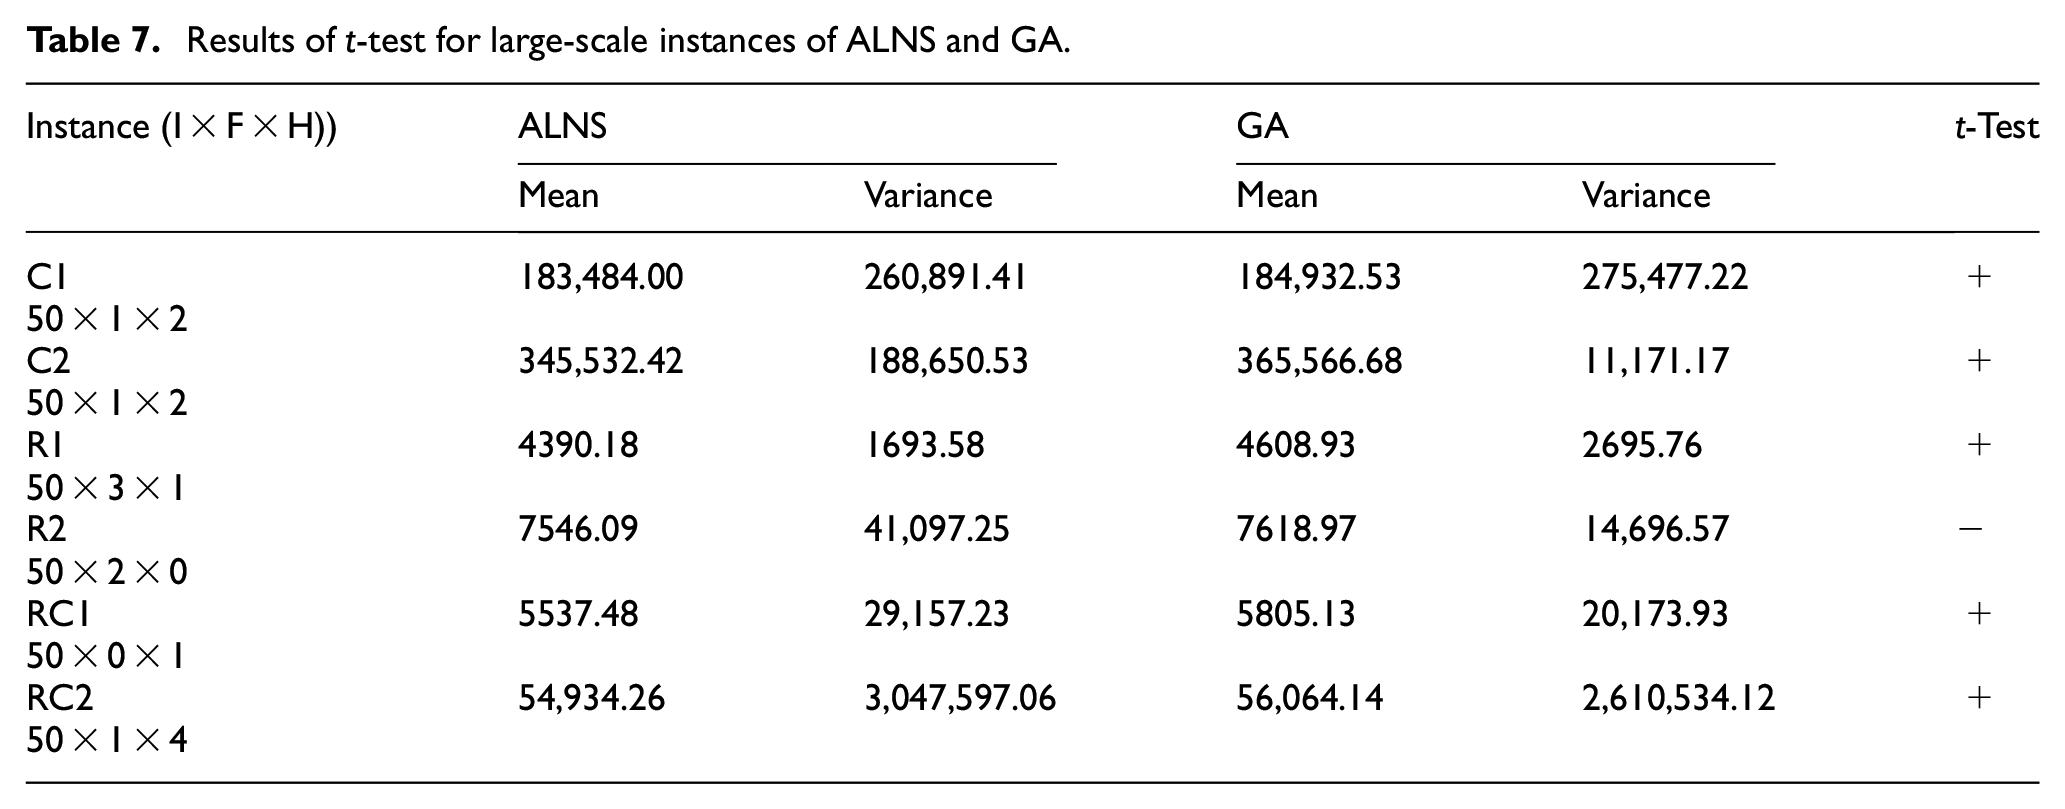
The results of the t-test with the GA algorithm show that the improved ALNS in this paper is generally superior to the GA. There is no significant difference for the R 2 -type instances. However, as shown in Table 7, the GA is significantly inferior to the ALNS in terms of the total cost and the number of vehicles. Overall, the improved ALNS in this paper has more advantages.
Sensitivity analysis
Based on the experimental results from the six Solomon problem categories, the RC202 of RC2 instance, which represents a relatively complex and random scenario with 50 customer points, was selected for further sensitivity analysis. The program was run 10 times to obtain the optimal solution. The optimal distribution route is shown in Figure 3, where larger coordinate points represent charging or battery-swapping stations. The convergence of the algorithm is illustrated in Figure 4.

Optimal route for RC202.

Algorithm convergence for RC202.
Tables 8 and 9 compare the initial solution generated by the greedy algorithm with the optimized solution obtained through the ALNS algorithm in terms of total delivery cost and delivery routes.
Initial vehicle delivery routes and objective values.

ALNS optimized vehicle delivery routes and objective values.

The comparison shows that the optimized routes reduced the total number of charging and battery-swapping times while also reducing the total cost by 36%, demonstrating that the algorithm effectively optimized the delivery routes and reduced transportation costs
In the ALNS algorithm, destruction operators are mainly used to modify the structure of the current solution during the search process, helping the algorithm escape local optima and promoting global exploration. Common destruction operators include random destruction, worst-value destruction, and worst-distance destruction. Given the importance of time constraints due to the freshness requirements of fresh products during delivery, the timeout destruction operator was introduced to better identify potential global optima or improved local optima.
This study selected three different types of instances: C202, R202, and RC202, and compared the performance with and without the timeout destruction operator. Each instance was run 10 times, and the average results were compared, as shown in Table 10.
Analysis of timeout destruction operator in different instance types.

From the table, it is clear that the timeout destruction operator has a significant impact on the solution quality, with the most substantial effect observed in the C-class instances. Therefore, including the timeout destruction operator in the algorithm is necessary.
In this analysis, three RC2 instances, each containing 50 customer points, were selected. Assuming a fixed total of five delivery vehicles, the optimal solution was obtained after running the algorithm 10 times. The study analyzed the changes in total delivery costs as the number of charging-based and battery-swapping electric vehicles varied from 0 to 1. The results are depicted in Figure 3, where “0/5” represents the use of 0 battery-swapping electric vehicles and 5 charging-based electric vehicles.
From Table 11, it can be observed that the average cost of battery-swap electric vehicles is higher than that of charging-only electric vehicles. However, as the number of battery-swap electric vehicles increases, excluding the two scenarios of pure charging-only and pure battery-swap, the battery-swap cost increases by 727.67 yuan in the other four scenarios, while the time penalty cost decreases by 25,791.17 yuan and the cargo damage cost decreases by 28,356.52 yuan. Therefore, it can be concluded that for the distribution of fresh goods, using more battery-swap electric vehicles can effectively reduce the losses caused by time penalty costs and cargo damage costs.
A detailed cost analysis of the proportion of different types of vehicles at the same freshness level.

As shown in Figure 5, under constant customer-defined minimum freshness for fresh products, the total delivery costs fluctuate significantly with changes in the proportion of charging-based and battery-swapping electric vehicles. Overall, the delivery costs are relatively high when using only charging-based or only battery-swapping electric vehicles. The lowest total delivery cost is achieved when both types of electric vehicles are used together, indicating that companies using electric vehicles for delivery can achieve lower costs by employing a mixed fleet of charging-based and battery-swapping electric vehicles. The specific ratio should be adjusted according to actual conditions.

Delivery cost variations with different vehicle type proportions.
In this analysis, the RC202 instance, which includes 50 customer points and 5 delivery vehicles, was used. The algorithm was run 10 times to obtain the optimal solution. The study examined how changes in customer-defined minimum freshness for fresh products affected various related costs.
As shown in Table 12, as the customer-defined minimum freshness for fresh products increase, the total delivery cost rises rapidly, with an average growth rate of 11%. This increase is mainly reflected in goods loss costs, which have an average growth rate of 10%. Additionally, the number of battery-swapping electric vehicles increases because charging takes longer than battery-swapping. Therefore, when customers demand timely delivery of fresh products, the optimal delivery route tends to favor more battery-swapping electric vehicles, leading to relatively lower total costs. Thus, companies involved in fresh product delivery should not only consider customer-defined minimum freshness for fresh products but also opt for more battery-swapping electric vehicles when these requirements are higher.
Results for different freshness requirements.

Take the RC2-type data containing 50 customer points as an example. After running the experiment 10 times, select the best result. When the customers’ requirement for the maximum freshness of fresh produce remains unchanged at 85%, analyze the changes in the results under different time penalty costs (Table 13).
Cost changes under different unit-time penalty costs.

Discussion and conclusions
Main conclusions
This study investigates the joint distribution problem of fresh supplies from a single distribution center using both charging-based and battery-swapping electric vehicles, considering customer-defined minimum freshness for fresh products. A distribution optimization model was established with the objective of minimizing total costs, including charging and battery-swapping costs, time penalty costs, and goods loss costs. The Adaptive Large Neighborhood Search (ALNS) algorithm was employed for the solution, using a greedy algorithm to generate the initial solution. The destruction operators included random removal, worst-cost removal, timeout removal, and distance-based removal, while the repair operators included random insertion, greedy insertion, and maximum contribution insertion. Both small-scale and large-scale instances were analyzed using the classic Solomon dataset, and the results were compared with those obtained from the Gurobi solver and the Genetic Algorithm (GA). The comparison validated the reasonableness of the model and the effectiveness of the algorithm. Finally, sensitivity analyses were conducted on the destruction operators, the proportion of different vehicle types, and the freshness requirements. The results suggest that companies using electric vehicles for distribution can achieve relatively lower costs by jointly using charging-based and battery-swapping electric vehicles. Furthermore, fresh supplies delivery requires not only consideration of customer-defined minimum freshness for fresh products but also the use of more battery-swapping electric vehicles when these requirements are higher. Decision-makers in fresh product delivery companies can select the optimal distribution strategy based on actual conditions.
Management insights
(1) Fresh produce distribution enterprises should dynamically adjust the usage ratio of charging-type and battery-swapping-type electric vehicles based on market demand and customers’ requirements for the freshness of fresh produce. Thanks to its efficient energy-replenishment mechanism, battery-swapping-type electric vehicles can effectively reduce time and costs when meeting high-freshness requirements. By combining the advantages of the two types of vehicles, enterprises can achieve the optimal synergy between cost and efficiency.
(2) The research shows that an increase in customers’ freshness requirements will significantly increase the total distribution cost, especially the cost of goods damage. Therefore, when designing distribution strategies, enterprises should fully consider the impact of freshness requirements on costs, scientifically set distribution time windows and vehicle scheduling plans to balance costs and customer satisfaction.
(3) The Adaptive Large Neighborhood Search (ALNS) algorithm performs excellently in solving large-scale distribution route optimization problems. It can quickly generate high-quality initial solutions and efficiently converge to the global optimum. Fresh produce distribution enterprises can refer to this algorithm for distribution route planning, improve distribution efficiency, reduce operating costs, and enhance the overall operation level of the supply chain.
Issues needing further research
Based on the research in this paper, in-depth exploration can be carried out in two aspects in the future.
(1) In this study, the joint distribution of charging-type electric vehicles and battery-swapping electric vehicles is considered. Since there is a shortage of battery-swapping stations for battery-swapping electric vehicles at present, subsequent research can take the location selection of battery-swapping stations into account. Secondly, in actual situations, when considering the constraints of batteries, the influence of battery charging power and battery service life on electric vehicles should be taken into consideration, so as to calculate the vehicle cost from a more long-term perspective.
(2) In the algorithm stage, this paper only makes improvements on the basis of the Adaptive Large Neighborhood Search (ALNS) algorithm. As the complexity of the problem increases, the ALNS algorithm can be further improved by considering the learnable parts of other algorithms. For example, applying a solver to the initial solution can further accelerate the solution and convergence process. Or using exact algorithms for further research is a direction that can be considered for future research.
Footnotes
Handling Editor: Sharmili Pandian
Funding
The author(s) received no financial support for the research, authorship, and/or publication of this article.
Declaration of conflicting interests
The author(s) declared no potential conflicts of interest with respect to the research, authorship, and/or publication of this article.