
Abstract
To investigate the failure of the steering tie rods and steering knuckle arms of a heavy semi-trailer tractor during accelerated life testing in a proving ground, detailed detections were performed on the material structural properties and machining accuracy of the failed components. Using the Neuber’s rule and cyclic hysteresis loop equation, the measured nominal stress was transformed into the local stress-strain cycles. The fatigue damage of the fracture components was calculated using the Morrow’s mean stress correction model. The findings from the detections and calculations indicate that the material properties are in compliance with designed technical specifications. The steering tie rods exhibited buckling deformation after becoming unstable due to its high flexibility and thin rod structure, which induced cyclic dynamic additional bending moments, identified as the primary cause of its fracture. The fracture surfaces and crack origins of the steering knuckle arms displayed clear machining tool marks, the conicity and surface roughness did not meet the design specification precision, and the assembly contact area with the steering knuckles was only approximately 20%–30%. This insufficient contact resulted in localized high stress concentrations at the root of the cone body, leading to low-cycle bending fatigue fractures.
Introduction
During operation, vehicles continuously experience shock loading types due to uneven road surfaces, predominantly comprising cyclic dynamic random loading. Additionally, the vehicles are subjected to lateral steering, driving, and braking forces, all of which typically vary over time. 1 When randomly varying operational loads are applied to a system, they excite multiple vibrational modes. The dynamic response at a point sufficiently distant from the loading point on the system manifests as a stress-time history, encompassing the action of external loading and the structural dynamic response to these loading. In practical tests, external loading are usually not directly observable; rather, their effects are measured at specific points on the structure. Typically, the output response function measured from a point on the structure is collectively referred to as the load-time history.1,2 Reliability tests in the proving ground aim to simulate the most severe conditions encountered by vehicles in actual use environments, primarily those causing significant fatigue damage to vehicle components and structures. To shorten the duration of reliability tests, proving ground conditions are increasingly stringent, achieved by constructing more severe test roads and increasing driving speeds.1–3 The primary role of vehicle reliability testing is to measure the reliability of a component or system released to the conformance to customer requirements. Product validation tests are essential at later design stages of product development. To ensure that customer expectations are fully addressed, product development specifications must require that products provide reliable performance over the entire customer ownership period. 4 Verification of design conformance to customer-driven specifications is a key step within a prevention methodology development program. Reliability testing is the only practical means to verify that products meet life and functional specifications. Assessing the reliability of products during the product development cycle is an important task in satisfying customers. Severity of usage is the prime factor affecting field reliability. The engineer must be knowledgeable of usage severity and incorporate this factor into the product design. Prevention is the strategy of employing appropriate precautionary actions during the product development cycle to eliminate nonconformance in products delivered to customers. The ultimate goal is to design and manufacture products that will meet the needs and expectations of customers. When adequate preventive actions are not taken, there may not be sufficient time to fix nonconformance found late in the testing program, and the goal of delivering a defect-free product may not be met.4–6 The durability of a vehicle is primarily determined by the fatigue life of its assemblies and components, which typically withstand dynamically varying loads, generally random functions of time. Under such loading, components may undergo fatigue failure or damage, that is, parts fail due to fatigue after a certain period under cyclic loading.7–9 The primary factors influencing the fatigue life of steering knuckles include stress concentration, surface roughness, surface condition, and environment. 10 Under the action of random loading, the main failure mode of steering knuckles is fatigue failure, and fatigue analysis under random loading is different from constant amplitude loading. The load borne by the components presents a multi-axis stress state. Therefore, multi-axis fatigue analysis method should be used to study the fatigue problem of steering knuckles.10,11 Due to the complex shape of the steering knuckles, they is easy to develop crack defects after forging and heat treatment, so it is necessary to improve the accuracy of heat treatment processing technology to improve crack tendency and enhance the quality of forgings.12,13 The steering tie rods assembly and steering knuckle arms are crucial components of the steering system in heavy-duty vehicles, responsible for transferring steering forces. Their reliability is critical for driving safety, and they are not permitted to fracture during their entire lifecycle. The main reasons for the failure of the steering knuckle arms and steering tie rods include mechanical damage, component aging, improper use, ball joints failure, deformation damage, and steering power problems.10,12 If the driving vehicle encounters a collision accident, or the tire hits the road shoulder, crater, and other obstacles, due to the unbalanced force on both sides of the tire, the steering knuckle arms and the steering tie rods will be subjected to tremendous impact, extrusion and bending deformation or fracture.14,15 Affected by road excitation, engine vibration, and other factors, the fatigue limit of the material will gradually decrease, when the fatigue limit of the material is reduced to a certain extent, fatigue cracks may occur, which eventually lead to fatigue fracture as the cracks propagation. The ball joints of the steering tie rods will inevitably wear out due to frequent rotation and force during long-term use, and the clearance of the ball joints will gradually increase. 15 Therefore, problems such as looseness and abnormal noise will occur during steering, seriously affecting the accuracy and stability of the steering process. Insufficient power steering oil can increase the resistance of the steering system, causing greater pressure on the steering tie rods. Prolonged exposure to this high-pressure state may result in fracture. In the accelerated life testing of the proving ground, the steering tie rods have repeatedly fractured in the middle, consistently by nature, showing typical fatigue failure from the fracture morphology. The fractures of the steering knuckle arms on both sides occur near the same mileage, primarily concentrated between 2200 and 4400 km, and exhibit good repeatability. During the reliability testing and assessment in the proving ground, the statistical results of the fracture failure of the steering knuckle arms and steering tie rods of a certain vehicle manufacturer are shown in Table 1.
Fracture failure mileage and failure mode of steering knuckle arms and steering tie rods.

The study is based on the results of a reliability assessment on an accelerated durability test road in a proving ground for a heavy semi-trailer tractor steering system. It involves measuring the strain components at the fracture sites of the steering tie rod and steering knuckle arms, acceleration of front axle end, and axial displacement of the steering tie rod, as well as the parameters related to the steering system. Additionally, by integrating material microstructure characteristics, machining technologies accuracy, and fatigue damage calculations, and this paper analyses the fracture failure mechanisms of the steering tie rods and steering knuckle arms. Previous studies on fracture failure of vehicle structures focused solely on aspects such as fatigue damage, or material property detection and analysis, or assembly processes, or machining accuracy. This paper combines these single research methods and conducts research and analysis from multiple perspectives to more effectively and accurately determine the fracture failure mode of automotive components.
Fatigue life of structures
Vehicles in operation are subjected to a complex vibratory working environment, where various components experience time-varying stresses and strains. Structures or components, due to external excitation, invariably produce varying vibratory responses. Repeated vibratory loading types can induce the onset of vibrational fatigue cracks or fractures. Fatigue is a progressive failure phenomenon, typically encompassing three stages: crack initiation, crack propagation, and ultimate fracture.16,17 Since fractures occur abruptly, fatigue life is primarily determined by the stages of crack initiation and propagation. The respective lifespans associated with these stages are referred to as the crack initiation life and crack propagation life, collectively constituting the total fatigue life.4,18 Mechanical components inevitably feature stress concentration sources, commonly termed as notches, which can be classified into mechanical and metallurgical notches. Mechanical notches include fillets, keyways, and scratches; metallurgical notches encompass sand pits, impurities, pores, and quenching cracks. These notches lead to localized increases in stress and strain, with fatigue cracks generally first appearing in these areas of elevated local stress.19,20
Methods used to predict crack initiation life primarily include the nominal stress method and the local stress-strain method, both of which are widely employed. The nominal stress method bases its fatigue life predictions on the S-N curve. However, a key limitation of this method is its neglect of plasticity at the root of notches and the potential misestimation of the effects of mean stress.16–18 The local stress-strain method accounts effectively for the local plasticity and the influence of local mean stresses at the notch root, and is extensively applied in the prediction of low-cycle fatigue life.19,21 Although most components nominally are subjected to cyclic elastic stresses, components with notches, welds, or other stress concentrations induce localized cyclic plastic deformation. Therefore, the local stress-strain method offers greater effectiveness in predicting the fatigue life of such components. 22 Rainflow Counting Method can process the loading time history into an amplitude-mean-cycles rainflow matrix, as detailed in Figure 1. In the figure, the two parallel solid lines and the vertical solid line respectively represent the horizontal and vertical axes of the coordinate system. The upper half of the solid curve represents the measured strain data, and the lower solid curve represents its rainflow counted hysteresis loop curve; letters A–H represent peak and valley data points, and the dashed lines connect these points post-count.23,24

Counting rule of rainflow cycles.
The fatigue damage of structures and components is produced by cyclic loading, and the total damage due to fatigue caused by the entire time-domain load cycle is obtained through accumulation.4,16 It is challenging to affix strain gauges to measure local strains at the fracture locations of steering knuckle arms, therefore strain gauges are placed near the fracture site to test nominal stresses. Subsequently, the tested nominal stress spectra are transformed into local stress-strain responses at the fracture locations. 25 During cyclic loading, the relationship between the local stresses and strains at the crack formation site and the nominal stresses and strains measured by the strain gauges is illustrated in Figure 2.

Hysteresis curves of cyclic stress-strain.
According to Neuber’s Rule, cracks are prone to form at the notch root under cyclic loading, 19 and the relationship between the nominal stress tested by the strain gauges and the local stress-strain amplitude is given by

Where K
f
is the fatigue notch factor, E is the modulus of elasticity,
The fatigue notch factor K f can be calculated using the Neuber-Kuhn formula, 19 which is expressed as
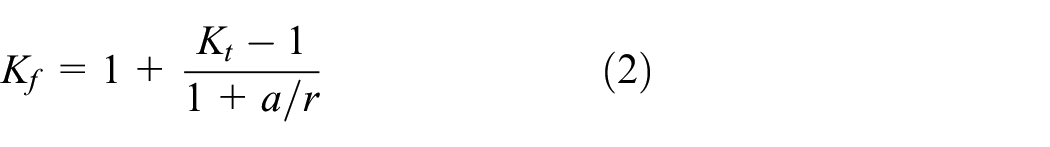
Where a is the material constant, r is the fillet radius at the fatigue notch root, and K t is the theoretical stress concentration factor.
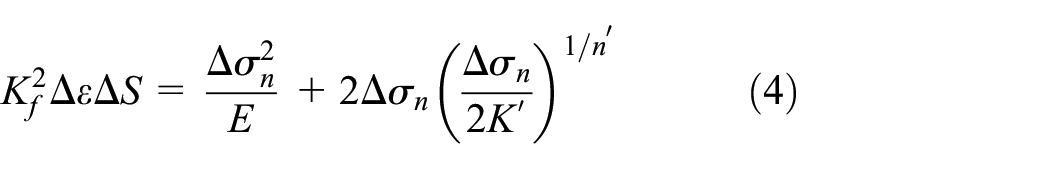
The equation for the hysteresis loop curve of the local stress-strain range at the fracture location is
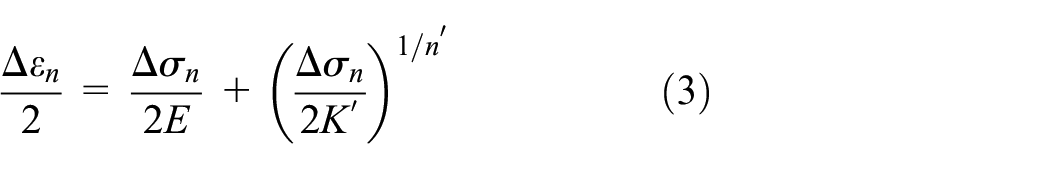
Where
Combining equations (1) and (3) results in
By jointly solving equations (3) and (4), the coordinates of each hysteresis loop vertex
Using the local stress-strain method, the elastic and plastic strain amplitude components of each hysteresis loop stage are plotted on a double logarithmic coordinate system,4,19 which can be approximately represented by two straight lines expressed as power-law functions
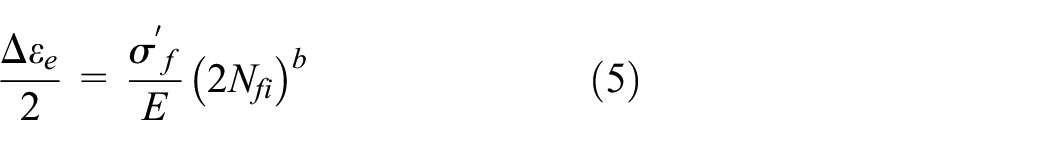

Where c is the fatigue ductility exponent,
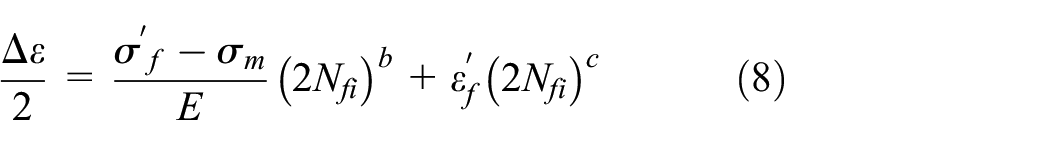
The total strain

The strain-life curves are obtained through the material testing under the symmetric cyclic strain control, where both the average stress and strain during testing are zero. However, in the processing of actual load signals, the scenarios often arise where the average stress and strain are nonzero. 4 From the perspective of externally applied cyclic stresses, the fatigue damage of a structure is strongly related to the amplitude or range of the applied stress and is also influenced by the average stress. In the high-cycle fatigue region, the positive mean stresses significantly affect the fatigue characteristics of a structure, as they directly influence the opening or closing of microcracks. 26 The opening of microcracks accelerates crack propagation, whereas their closure delays it. 25 In automotive durability design, the presence of non-zero positive mean stresses affects the material’s fatigue characteristics, as tensile or compressive mean stresses can either promote or mitigate crack initiation and growth. The fatigue test data demonstrate that compressive mean stresses are beneficial to fatigue life, while mean tensile stresses are detrimental. When the mean stresses are significantly lower than the cyclic yield stress, the fatigue characteristics fall into the long-life region where the elastic strain is prominent. The mean shear stress does not affect the opening or closing state of the microcracks, indicating that the influence of the mean shear stress on the crack propagation is minimal.27,28 In the low-cycle fatigue region, the extensive plastic deformation negates the beneficial or detrimental effects of the mean stress, rendering the impact of the mean stress on the fatigue strength minimal or even negligible. Generally, the impact of the mean strain can be disregarded, and when considering the influence of the mean stress on the fatigue life, only a correction for the mean stress is necessary. 4 The Morrow model applied for the mean stress correction in this paper is as follows
Where
The Morrow equation suggests that by correcting the elastic portion of the strain-life curve for the mean stress, the effects of positive mean stress can be incorporated, as shown in Figure 3. This model indicates that tensile mean stresses reduce the fatigue strength coefficient, while the compressive mean stresses increase it. This equation is widely used for steels.

Morrow mean stress correction curve.
Under the dynamic loading, the each hysteresis loop in the local stress-strain response of steering tie rods and steering knuckle arms generates a fatigue damage unit. Given known hysteresis loops and the structure’s strain-life curve, the fatigue damage caused by each loop can be calculated. Assuming a loading history generates n hysteresis loops, with each loop’s vertex coordinates being

Vertex coordinates and average stress of hysteresis loop.
Let the strain range


Inserting these strain ranges

Yields the fatigue life N fi according to equation (11). If the fatigue damage caused by the i-th stress amplitude level is D i , then

Where
Using Miner’s linear cumulative fatigue damage rule, the total cumulative fatigue damage D is obtained by summing the fatigue damages at all levels

Where M is the loading amplitude level.
Theoretically, when the total cumulative damage D ≥ 1, the steering tie rod and steering knuckle arms will experience fatigue fracture. In this testing, the material of the steering knuckle arms is 40Cr steel, and the material-specific parameters used in the fatigue damage calculations are shown in Table 2. 19
Material parameters of steering knuckle arms for damage calculation.

Testing scheme and damage calculation
Test load measurement
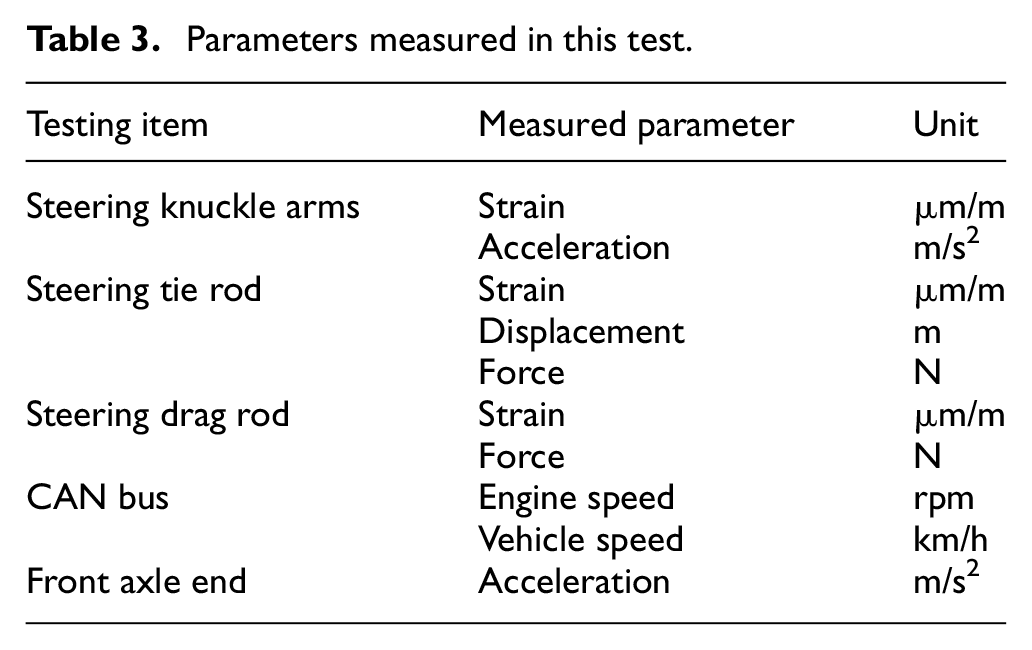
The loading spectra represent the typical time history of loads experienced by an automotive structure or component, and forms the foundation for calculations of fatigue damage and fatigue life.1,3 The most mechanical structural components operate under the different loading types, which cause changes in the internal stresses and strains of the materials, leading to the initiation, propagation, and eventual fracture of cracks. 4 The loading time history induces the response signals in the structure, including stress, strain, acceleration, displacement, force, and torque. 17 The analysis of these response signals yields various cumulative frequency distributions, statistical characteristics, frequency domain features, amplitude domains, and rainflow matrices. To predict the fatigue life, it is often necessary to measure the local loading types, due to the different stress modes of the steering tie rod and the steering knuckle arm, the measurement of strain also varies. The tension compression and bending strain signals at the fracture location of the steering tie rod need to be measured. Two strain gauges are fixed to the upper and lower symmetrical axis surfaces to form a full bridge circuit. The tension compression and bending strain signals are separated by adjacent arm or opposite arm connections to ensure that the strain gauges are consistent with the direction of force. The steering knuckle arm only needs to measure the bending strain, and strain gauges are pasted on both sides of the symmetrical axis of the crack origin to form a full bridge circuit for measuring the bending strain signal. It is necessary to ensure the correct connection of adjacent arm or opposite arm. The strain signal is measured using full bridge strain gauges, which have high sensitivity, low error, and good temperature stability. Figures 5 and 6 respectively show the steering knuckle arm and steering tie rod with strain gauges attached. The cable displacement sensor used to measure the displacement signal of the steering tie rod is shown in Figure 7, the multi-axis vibration acceleration sensors of the steering knuckle arm are shown in Figure 8, with Figure 9 depicting a real-vehicle testing on a cobblestone road surface. The mass of the test vehicle is 8.7 tons, with a total towing mass of 40 tons. The mileage required for measuring test data is divided into three types of loads (unladen, laden, and overload), with 33.6 km required for each loading condition, totaling 100.8 km. Type of test road is the accelerated durability test road of the proving ground. The parameters to be measured in the test are listed in Table 3.

Steering knuckle arm affixed with strain gauges.

Strain gauges for measuring tension of steering tie rod.

Axial displacement sensor on steering tie rod.

Accelerometers on front axle end and steering knuckle arm.

Real-vehicle testing on cobblestone road.
Parameters measured in this test.
Calculation of fatigue damage
For the analytical and experimental convenience, it is essential to simplify the measured load-time history. This involves condensing the actual load signals to eliminate those contributions which have minimal impact on the fatigue damage, thereby obtaining a “typical load spectrum” that accurately reflects the true conditions. 4 The raw data collected are subject to the environmental factors such as temperature and humidity, leading to issues like zero drift, spikes, and dropout which necessitate preliminary data processing. 1 The “eDAQ” data acquisition equipment is employed to record test data via sensors throughout the testing process, and a fatigue damage model is constructed using GlyphWorks to calculate the local stress-strain fatigue damage. Given the large number of channels recorded by the eDAQ and the extensive computational demands, this paper focuses solely on the calculation of the fatigue damage for the vehicle under full load, specifically calculating the steering tie rod and steering knuckle arms, as outlined in the process diagram shown in Figure 10. Figure 11 presents the actual time-domain data related to the steering system measured during the testing. Prior to using these data for the calculation of fatigue damage, it is crucial to verify the repeatability of the test data to ensure their accuracy. Subsequently, the data preprocessing is conducted, including de-spiking, drift correction, and filtering. Finally, the preprocessed test data are imported into the strain life module of GlyphWorks software, where parameters such as the mean stress correction, fatigue notch factor K f , and the material property parameters are defined, as shown in Table 4.

Calculation model of fatigue damage based on GlyphWorks.

Time-domain test data related to steering system: (a) strain of left and right steering knuckle arm, (b) strain of left and right steering knuckle, (c) three directional accelerations of steering knuckle arm, (d) strain of steering tie rod, (e) displacement of steering tie rod, and (f) tensile force of steering tie rod.
Parameter definition of strain life properties.

The strain-life curves corrected by Morrow’s mean stress correction constitute a family of curves, facilitating the calculation of fatigue damage considering each mean stress value. The amplitudes, means, and number of cycles of the strain data, as derived from the rainflow counting, are presented in Table 5. Figure 12 displays a histogram of the rainflow counting cycle matrix, illustrating the relationship between amplitude, mean, and number of cycles. It is observable from Figure 12 that number of cycles with small amplitude values and means near zero occur frequently, consistent with the rules of rainflow counting. Figure 13 shows the histogram of fatigue damage distribution.
Rainflow counting cycles of strain signal.


Histogram of rainflow counting matrix.

Histogram of fatigue damage.
Following the Miner’s rule for the fatigue damage calculation, the Accumulated fatigue damage under different amplitudes and means is computed, with the total fatigue damage presented in Table 6.
Fatigue damage under different range and mean values.

This test measured data under three different loading conditions (unladen, laden, and overload). Due to the large volume of data from the rainflow counting and fatigue damage calculations, only a subset of results is displayed here, with the final total fatigue damage shown in Tables 7 and 8. The distribution of fatigue damage across the steering knuckle arms and steering tie rod indicates that the vehicle’s load has minimal affect on the fatigue damage. The greatest contribution to fatigue damage, exceeding 90%, occurs on the cobblestone surface used in accelerated durability test road. The unevenness of the cobblestone surface causes asynchronous movement directions of the left and right steering wheels. This asynchrony induces cyclic buckling and additional bending moments on the steering tie rod under compressive loads. Furthermore, the variations in structural assembly and the machining accuracy contribute to the localized high stress concentrations at the root of the steering knuckle arms.
Accumulated damage of steering knuckle arm on accelerated durability test road.

Accumulated damage of steering tie rod on accelerated durability test road.

Failure analysis of steering tie rods
Material properties
During tests conducted in the proving ground, the assembly of the steering tie rod fractured at its midpoint. The fractured tie rod is depicted in Figure 14, and the macroscopic morphology of the fracture crack origins is shown in Figure 15, the test had covered a distance of 2700 km. Feedback from the market concerning similar vehicle models indicates that the steering tie rods are prone to plastic deformation, leading to the imprecise steering and the uneven tire wear, which severely compromises the vehicular safety.

Fractured steering tie rod.

Macroscopic morphology of crack origins.
Metallographic examination: The material of the steering tie rod is identified as 20-grade steel, which has good toughness, plasticity, and weldability, the ultimate tensile strength of 20-grade steel is 500 MPa. Metallographic samples were taken from the fracture site of the tie rod. After mounting, polishing, and etching, the samples were observed under an advanced metallographic microscope. The microstructure was found to consist primarily of the ferrite with pearlite as a secondary phase, which conforms to the microstructural specifications for 20-grade steel. Among them, the grain size of the ferrite is 10–40 μm, and the volume of the phase is 12–50 μm. The grain size of the pearlite is 4–18 μm, and the volume of the phase is 5–20 μm. As shown in Figure 16.

Microstructure of steering tie rod.
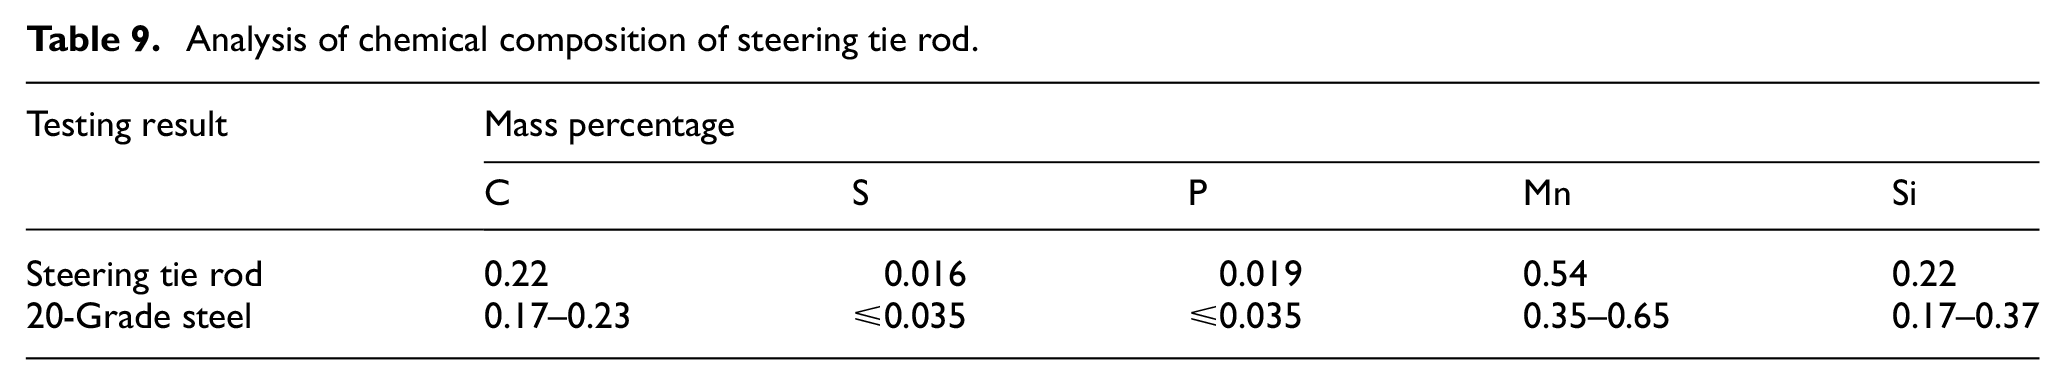
Chemical composition analysis: Samples were also taken from the fractured steering tie rod for chemical composition analysis. The results, presented in Table 9, confirm that the chemical composition of the tie rod meets the requirements specified for 20-grade steel in the GB/T699-2015 standard.
Analysis of chemical composition of steering tie rod.
Hardness Testing: 20-grade steel is a low-carbon steel with a Brinell hardness range of 160–220 HBW at the ultimate tensile strength of 500 MPa. Hardness measurements at three equidistant points across the cross-section from the surface to the core of the tie rod yielded values of 179, 178, and 176 HBW, respectively, which comply with the technical specifications outlined in the design drawings.
Stability analysis
In the stability analysis of the steering tie rod, the critical load-bearing capacity under normal compressive load is calculated by considering the tie rod as a simply supported beam. The actual flexibility of the tie rod is expressed by the following formula

Where μ denotes the length coefficient, with a value of 1 for simply supported conditions, l is the length of the rod, l = 1200 mm, and i represents the radius of gyration of the tie rod’s cross-section. The radius of gyration can be represented as

Where d is the diameter of the tie rod, d = 31 mm, I is the moment of inertia, and A is the cross-sectional area of the rod. The proportional limit of flexibility for 20-grade steel is given by

With E is the modulus of elasticity, E = 200 GPa, and σ p as the proportional limit of the material of the steering tie rod, σ p = 210 MPa. Since λ ≥ λ p , the critical static load P c can be calculated using Euler’s equation as
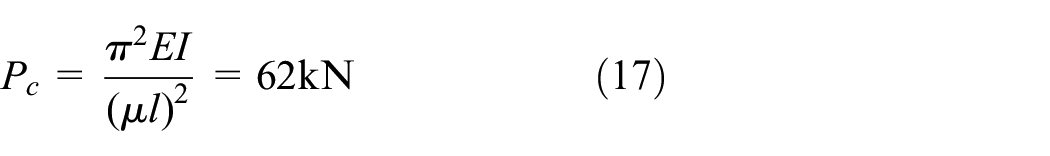
The critical stress obtained is

Assuming the test vehicle travels at speed v, and considering the angle α between the direction of the vehicle travel and a road bump affecting the axial force on the steering tie rod, the axial impact velocity of the tie rod is given by

When α = 45°,

Where s a is the axial displacement of the tie rod under the static load P, here
For the static load buckling test on the rig, the axial load is half of the axle load, P = 25 kN. Let P d be the critical dynamic load, then
Substituting all known parameter values into equation (22) to get

Equation (23) indicates that under dynamic impact loads, the higher the vehicle speed, the lower the dynamic critical load of the tie rod, increasing the risk of dynamic buckling instability. Given that the flexibility λ of the steering tie rod exceeds its proportional limit flexibility λ p , and is thus classified as a slender rod with large flexibility, the critical stress calculated using Euler’s equation is 82.2 MPa. In practical testing, the maximum stress recorded on highways was 131.9 MPa, and the proving ground tests showed a maximum stress range of 120–238 MPa, all exceeding the critical stress. Under impact loads, when the actual stress exceeds the critical stress, significant deformation and buckling instability occur.
Failure analysis of steering knuckle arms
Material examination
Material testing was conducted on four specimens of steering knuckle arms, labeled A, B, C, and D. Macroscopic examination of the fracture surfaces revealed that the fractures occurred at the root of the cone body of the steering knuckle arms, as shown in Figure 17. The fracture surfaces showed clear tool marks that were parallel to the fracture, along with multiple distinct “mini-steps” visible on the surface, as depicted in Figure 18. Additionally, the origin zones of the cracks exhibited numerous noticeable “mini-steps,” which are likely sites of high stress concentration. The morphology of the crack origins is shown in Figure 19.

Macroscopic feature of fractured steering knuckle arms.

Typical morphology of fracture crack.

Fracture morphology of steering knuckle arm: (a) macroscopic characteristics of fracture surface and (b) local features of crack initiation origin.
The ultimate tensile strength of 40Cr steel is 980 MPa, Hardness testing was performed on the fractured specimens using the Brinell hardness test. The hardness was measured at three points uniformly distributed from the surface to the core along the cross-section of the break, with results presented in Table 10. The Brinell hardness values for all three points on each of the four specimens were similar and met the technical specifications.
Testing results of Brinell hardness.

Chemical composition analysis of the four specimens indicated that the carbon content in specimens A and C was slightly elevated, while the content of other chemical elements conformed to the required technical specifications. The results are displayed in Table 11. Metallographic analysis showed that specimens A and D exhibited a temper sorbite structure of Grade 1, whereas specimens B and C displayed a composite structure of temper sorbite + bainite + a small amount of ferrite, classified as Grade 3. According to the applicable standards, the microstructures of all four specimens met the required technical conditions.
Percentage of chemical element content.
Machining accuracy
Three specimens of steering knuckle arms and steering knuckles were taken respectively to detect the surface roughness, roundness and conicity of the cone body and cone hole. The tested steering knuckle and steering knuckle arm are shown in Figure 20, and the detection results are shown in Table 12. The conicity design value of the steering knuckle arms and the steering knuckles is 1:8, that is, 7°9′10″, and the detection value deviates greatly from it. The design standard of the surface roughness of the steering knuckle arm cones is Ra3.2, which is slightly exceeded by the detection result. The design standard of the surface roughness of the steering knuckle cone holes is Ra1.6, and the detection value is far beyond it, indicating that both the conicity of the tapered surfaces and the surface roughness did not satisfy the design specification precision. Six specimens of steering knuckle arms were taken and coated with red lead powder to examine their contact area with the steering knuckles. The results showed that the actual assembly contact area was only 20%–30%, as shown in Figure 21, this finding indicates non-compliance with the design standards.

Steering knuckle and steering knuckle arm for examining their assembly contact area: (a) steering knuckle and (b) steering knuckle arm.
Examining results of machining accuracy.


Detection results of contact area: (a) contact area of specimen (A) is about 20%, (b) contact area of specimen (B) is about 30%, (c) contact area of specimen (C) is about 30%, (d) contact area of specimen (D) is about 30%, (e) contact area of specimen (E) is about 20%, and (f) contact area of specimen (F) is about 30%.
Conclusions
The metallographic structure of the steering tie rod and steering knuckle arm has uniform grain size distribution, clear grain boundaries, and no defects such as cracks, looseness, and inclusions. The distribution of each phase is uniform and the quantity is moderate, with few brittle or soft phases, and the non-metallic inclusions are also very few. The content of chemical elements is within the specified range and meets the chemical composition requirements of relevant standards. At the corresponding ultimate tensile strength, the Brinell hardness test results of 40Cr steel and 20 steel meet the design technical parameter requirements.
A data preprocessing and damage calculation model was established based on Glyph Works, and the Neuber rule was applied to convert the actual measured nominal strain into local stress-strain response. The Morrow’s mean stress correction model was used to correct the non-zero mean stress. The fatigue damage calculation results show that the maximum fatigue damage for both the steering tie rod and steering knuckle arms occurred on the cobblestone surface in the proving ground, where the uneven terrain caused kinematic interference in the movement of the left and right steering wheels. Under the dynamic compressive loads, the steering tie rod experienced instability due to actual stress values exceeding critical stress levels, resulting in buckling deformation and subsequent dynamic cyclic additional bending moments. Under the action of this dynamic bending moment, the accumulated fatigue damage in the material of the steering tie rod is the primary cause of its fracture.
The machining tool marks are obvious at the fracture of the steering knuckle arm, the crack origins demonstrated significant sensitivity to machining tool marks. The “mini-steps” formed by these tool marks are prone to stress concentration, suggesting a need for improvements in machining accuracy to enhance strength. The assembly conicity and surface roughness of steering knuckle arms and steering knuckles do not meet the design accuracy, the contact area between the steering knuckle arms and the steering knuckles was only approximately 20%–30%, causing the force on the tapered surface to shift from uniform to localized loading. This led to high stress concentrations at the root of the cone body of the steering knuckle arms. Subjected to significant amplitude local cyclic loading, both the steering tie rods and steering knuckle arms produced plastic deformation, resulting in permanent damage and fatigue cracks, ultimately leading to low-cycle bending fatigue fractures.
The findings of this paper provide a crucial basis for future improvements in the structural design and machining processes of the steering tie rods and steering knuckle arms.
Footnotes
Handling Editor: Sharmili Pandian
Funding
The author(s) disclosed receipt of the following financial support for the research, authorship, and/or publication of this article: This work was supported by the Talent Introduction Research Initiation Fund Project of Suqian University (Suqian University No. 2023XRC020), Research Project of Education Department of Jilin Province: Virtual and Real Simulation Platform in Robot System Integration Scenarios (No. JJKH20220630CY), and Natural Science Foundation of Jilin Province of China (No. YDZJ202201ZYTS409 and No. 20230101333JC).
Declaration of conflicting interests
The author(s) declared no potential conflicts of interest with respect to the research, authorship, and/or publication of this article.