
Abstract
To establish the loading spectrum for rig test of a car powertrain, non-contact torque telemeter is adopted to measure the testing data, including target vehicle transmission shaft torque, rotation speed, and engine rotation speed, under the typical cases of customers’ actual usage. Then, the Process Builder module in Tecware is used to establish the gear split batch-processing model and process the customer data into target rotating rainflow counting cyclic matrix and eliminate the small cyclic loads which have relatively smaller influence on the fatigue life. Next, based on the road percentage and data collected in actual customer survey, the total cumulative damage of 90% customer is calculated according to the Weibull distribution equation, and powertrain damage calculation model for fatigue cumulative damage and its probability distribution function is examined by Kolmogorov–Smirnov. Finally, the customer data are compressed into block loading spectrum which can be identified by the rig test based on the fatigue damage equivalent principle, thus achieving the powertrain rig assembly testing life equivalent to the customers’ usage life. The car powertrain rig test can replace the full-vehicle road test, which efficiently lowers the testing cost and shortens the testing period.
Introduction
The reliability test of automotive powertrain system serves as an important measure to evaluate and verify the durability of powertrain. How to implement rational reliability test on powertrain rig assembly which complies with customers’ usage conditions makes up an issue of importance faced by automotive powertrain parts’ industry.1–3 For the purpose of evaluating and analyzing the reliability and operation performance of automobile powertrain, the foreign industries have widely adopted rig testing technology since the 1980s.4,5 Currently, there have been some testing studies on the correlation between the full-vehicle rig test and customer usage, which have made some achievements in the field of road spectrum and rig durability–based testing studies. However, these studies are mainly centered on evaluating the “vehicles’ structure.”6–8 In addition, there is a lack of studies on the related mechanism of rig reliability test and full-vehicle road test of powertrain. Basically, the evaluation on the reliability test of powertrain rig adopts foreign standards and regulations, which are based on actual customer data or proving ground road loads.9,10 Due to the limitations to technical means and testing instrumentation, the parameters of rig test in China can only be calculated approximately. However, considering that the establishment process and application conditions of the loading spectrum are not well understood and lack support from actual testing data, these methods cannot reach the anticipated evaluation goals when adopted to carry out rig reliability tests.
Based on actual customer operation testing data in typical cases, the method of fatigue damage equivalent and mathematical statistics are adopted to compress the customer data to form input loading spectrum for rig test. Finally, the correlation properties between the rig test and the customer usage are determined to achieve replacement of full-vehicle road test with rig test, thus providing reference for scientific evaluation of passenger vehicle powertrain reliability.
Powertrain damage mechanism
The damage calculation of vehicle powertrain differs from that of structure and is based on the combined counting data from torque and its corresponding rotation speed.1,2 The powertrain torque–rotation speed distribution is an interval counting method targeted at damage calculation of coaxially rotating parts and widely applied in the design and analysis of gear train. The measurement of vehicle powertrain torque directly influences whether the vehicle power mechanical system reaches the standard key indicators. 3 To establish torque–rotation speed loading spectrum, the torque and rotation speed of transmission shaft should be measured simultaneously as shown in Figure 1.

Generation of powertrain data.
The discontinuous time internal (Δti, i = 1, m) is known in rotation time (r/min (t)), and the number of rotations of transmission shaft ni under given torque Ti is calculated and expressed as

The principle of linear cumulative damage assumes that the damage is accumulated in a linear mode. Therefore, the correlated linear fatigue cumulative damage of torque–rotation speed of transmission shaft is calculated as 2

where ni is the number of rotations of transmission shaft under given torque Ti in highway variable speed test and Ni is the fatigue life (number of failure rotations) under the same given torque Ti. M is the load grade.
The number of rotations under each given torque in the torque–rotation speed distribution figure can be determined by matching interval counting algorithm. The relationship between the datum anti-fatigue and life of transmission system is given as 3

where Ti is the transmission shaft torque,
When the powertrain is under a certain torque, the number of its rotations is counted according to a given discrete time interval in the rotation time history. The input shaft torque and number of rotations of gear box are calculated as


where T1 is the input shaft torque of gear box, Tp is the gear box shaft torque, REV1 is the input total number of rotations of gear box, REVP is the total number of rotations of transmission shaft, and GR is the main speed ratio

where 3.944 is the speed ratio of the main reducer, 0.275 is the vehicle rotation radius, v is the vehicle speed, and nE is the engine rotation speed.
The number of rotations of gear box under given target torque is investigated to establish an equivalent fatigue damage model, which is expressed as
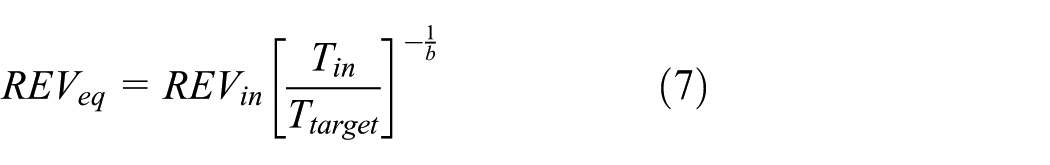
where REVin and Tin are the number of rotations and torque of gear box under different input torque values, respectively, and Ttarget is the target input control torque of gear box. The fatigue damage number of rotations equivalent to each pair of Tin and REVin can be calculated by equation (7).
Customer loading spectrum
It has been indicated by the analysis results of gear box gears in automobile transmission system that the bending torque which the regional gear is subject to and the number of cycles are linearly related to the input shaft torque and number of rotations. The fatigue damage of powertrain is mainly caused by the cyclic load jointly generated by torque and rotation speed. According to the structural fatigue theory, if the input load of different powertrains is equal, the fatigue damage caused by them should be equal as well. If the load input of customers in actual operation environment is known, the drive motor or dynamometer can be adopted to impose certain rotation speed and torque on the powertrain component on the rig to reproduce this load input. Considering that the load reproduction generally can be finished in a shorter period, the purpose of accelerating the testing process can be achieved. The establishment process of automobile powertrain rig test regulations is shown in Figure 2.

Establishment of powertrain rig test procedure.
Customer data survey
The study on the correlation between the customer usage and the rig test of powertrain and the establishment of scientific and credible rig reliability testing method demands an investigation on the vehicle customer operation information related to the target automobile type across a national range. Survey and interview are carried out on the customers and potential customers, which should mainly focus on the road-type percentage, vehicle speed, traffic situation, vehicle load situation, road category, traveling distances on various roads, drivers’ driving habits, and the regions where various typical roads are located.
For a research on the correlation between the customer usage and rig test, first a survey is conducted in approximately 3000 customers in the nationwide area; the survey includes the percentage of road categories, running speed, traffic condition, driving custom, vehicle weight, and so on; the customers’ road percentage is shown in Table 1. The customer survey data serve as parameter variable and are input into 90% customer model for calculation. Then, Monte Carlo11,12 simulation is carried out on the calculation results to obtain the customer target mileage fatigue damage.
Road-type percentage of survey customers.

90% customer damage model
In automobile reliability engineering studies, the vehicle structural fatigue strength, fatigue life, wear life, corrosion life, and the life of automobile assembly made up by multiple units follow the Weibull distribution in general. On four typical types of roads used by customers (urban road, highway, mountain road, and general road), the fatigue damage of vehicle powertrain follows the Weibull distribution, whose distribution function is given as 8

where F(t) is the cumulative distribution function, t is the powertrain damage,
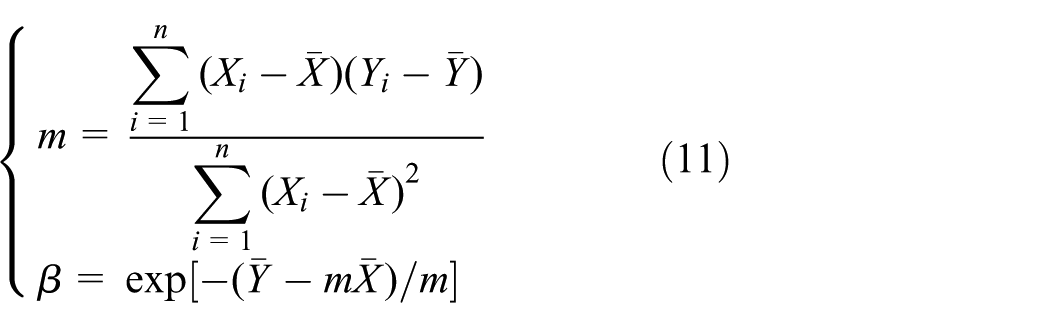
The parameters of Weibull distribution model can be estimated by the least square method, and equation (8) can be expressed as

In Weibull distribution probability paper, it is stipulated that

where
Therefore, the estimation results of the parameters in Weibull distribution model by the least square method are expressed as
According to the linear equation of Weibull distribution probability paper and actual customer survey data (traveling road percentage and load mass), the fatigue damage calculation model for customer powertrain with a failure probability of 90% for typical road types used by customers is given as

According to equation (12), it can be obtained as follows

Equation (13) is transformed into matrix equations, and we will get

where fci is the percentage of urban roads in customer survey, fei is the percentage of highway in customer survey, fti is the percentage of mountain roads in customer survey, fgi is the percentage of general roads in customer survey, Dc is the 90% customer fatigue damage of urban roads, De is the 90% customer fatigue damage of highway, Dt is the 90% customer fatigue damage of mountain roads, Dg is the 90% customer fatigue damage of general roads, Di is Number (No.) i 90% customer total fatigue damage, and n is the total amount of samples in customer survey.
In equation (14), Wai is the load mass adjustment factor and is expressed as

where LPH is the fatigue damage mileage under full-load condition, LPL is the fatigue damage mileage under empty-load condition, WR is the total vehicle weight in customer survey, WACQ is the total vehicle weight during customer typical road test, WL is the total empty-load vehicle weight, and WH is the total full-load vehicle weight.
Monte Carlo simulation for target customers
Monte Carlo simulation method is used to establish a normal distribution statistical model to calculate the 90% customer target total fatigue damage. A simulation test is then carried out on a computer to sample enough random numbers and correlate the related results to obtain the estimated result.
The total damage of 90% customer road calculated by equation (14) follows the normal distribution. Therefore, a random sampling model following normal distribution can be established to simulate the process. Two groups of independent numbers evenly distributed within the range of (0, 1), r1 and r2, are generated by RAND() function and transformed as follows


The reverse transformation is given as
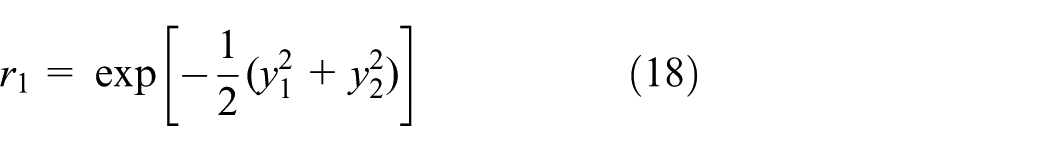

Thus, the combined distribution density functions of y1 and y2 are deducted as

Apparently, the probability density distribution functions, y1 and y2, are mutually independent and follow standard normal distribution, which means that

According to the central limit theorem of Lindeberg–Levy independent identically distributed random variables, when n is big enough, the Monte Carlo simulation value

where
Therefore, the Monte Carlo simulation error is calculated as
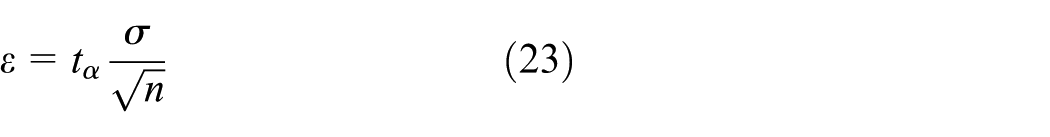
Under given significance level
Equation (21) is adopted to transform the sampling method to generate the random samples following normal distribution, and then simulation sampling obtains the 90% customer target damage. The greater the number of simulation calculations, the closer the mean statistical value to the actual value.
Design of testing scheme
Loading spectrum analysis is fundamental to the fatigue reliability test of automobile parts. 13 Generally, the loading spectrum measured in the test refers to strain spectrum, stress spectrum, torque spectrum, and so on.12,14 As a major component of automobile powertrain, the transmission shaft outputs a torque, which is a significant testing parameter in reliability test. The testing parameters are shown in Table 2.
Main measurement parameter.

CAN: controller area network; GPS: global positioning system.
To measure the left and right transmission shaft torque, the CAEMAX single-channel non-contact torque telemeter is applied as shown in Figure 3. It is applicable to the measurement of torque and rotation speed of vehicles, including passenger vehicles, business vehicles, engineering vehicles, and military vehicles. This system consists of strain gauge, Dx collection coding module, and Dx telemetering receiver.

Non-contact torque telemeter.
Before the test, resistance strain sheets are stuck in the direction on the outer surface of transmission shaft with an angle of 45° and 135° from the axis and then connected to a full-bridge converter. Then, Dx collection coding module is adopted to measure the corresponding strain value and transmit the collected data to the Dx receiver inside the vehicle wirelessly. The torque T can be calculated as

where E is the elastic modulus of the tested material, D is the diameter of the tested shaft,
During the test, the customer can mount the strain sheet and Dx collection coding module onto the transmission shaft of the vehicle and then place the Dx receiver inside the vehicle. One Dx collection coding module can be connected with two full-bridge or four half-bridge converters. Figure 4 shows the torque calibration testing process and the calibration coefficients. The customer testing data collection system is shown in Figure 5.

Calibration test of transmission shaft.

Test data measurement system.
Measurement and process of data
90% customer damage
Some of the original data collected in the test have the problems of zero drift, aberrant points, and trend items due to the influence of environmental temperature and humidity.15,16 Therefore, the data must be pre-processed. Then, the pre-processed transmission shaft torque classifies and counts the rotation speed data to transform into a number of rotations or rotation number distribution matrix of transmission shaft under different torque values and rotation speeds as shown in Figure 6.

Counting matrix of powertrain torque versus rotation speed.
This matrix can be used to calculate the damage generated by transmission shaft torque corresponding to each classification of torque values in each road and document. To draw its distribution curve in the Weibull distribution model, the medium rank equation can be applied to calculate the probability estimation value of powertrain damage as
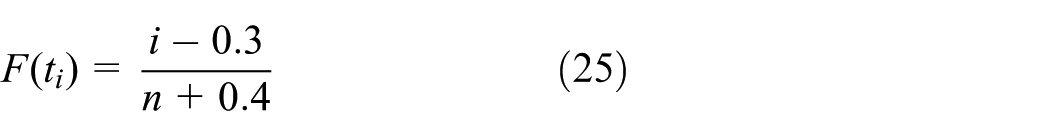
where n is the sample size and i is the sample order.
According to powertrain torque cumulative damage sequence and estimation probability, the customer goal is set as 50,000 km for conversion, and Table 3 shows the Weibull distribution parameter values obtained by the least square method.
Estimation value of least square method.

The estimation results of the least square method are adopted to carry out Kolmogorov–Smirnov (K–S) examination on the Weibull distribution function. The value

Under given significance level
90% Customer cumulative damage.

According to cumulative damage calculation results in Table 4, based on the road percentage in customer survey, equation (14) 90% customer model is used to calculate the cumulative powertrain damage of each customer and then the Monte Carlo simulation simulates the 90% customer target cumulative damage as 1.177897E−6. The number of simulation sampling is 2000, which represents 2000 customers. The confidence is set as 95% to guarantee the sampling precision of the Monte Carlo simulation algorithm and the corresponding simulation error is 1.66%.
Generation of rig test loading spectrum
The reliability rig test makes up for the deficiency of full-vehicle road test. The tested products in laboratory are subject to equal stress, and the testing results are obtained under a stable condition, which produces relatively clear life data. Considering that the test is controlled manually, the influence which driving habits and drivers fatigue have on the testing results can be eliminated. Carrying out the test under uniform conditions can obtain the same effects as the actual road traveling test.
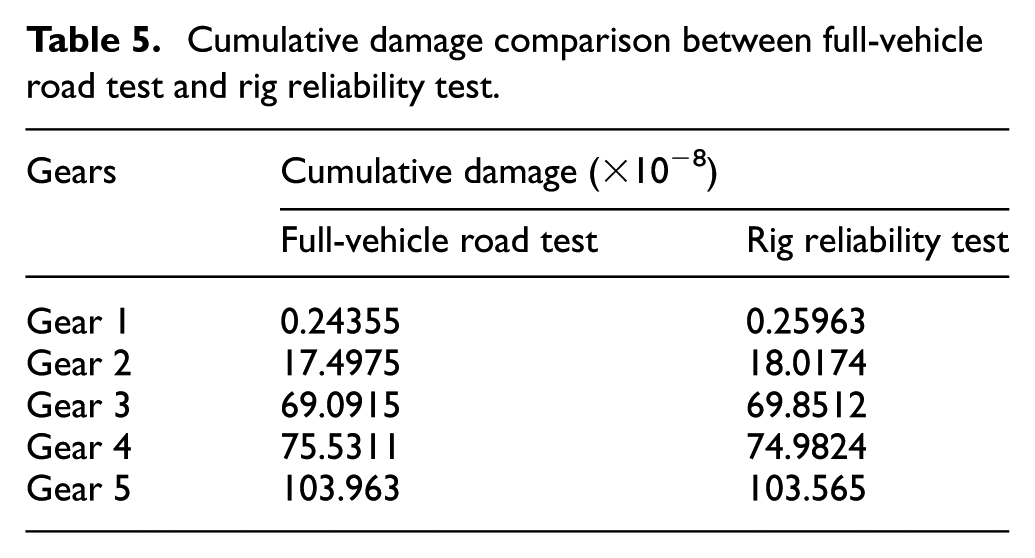
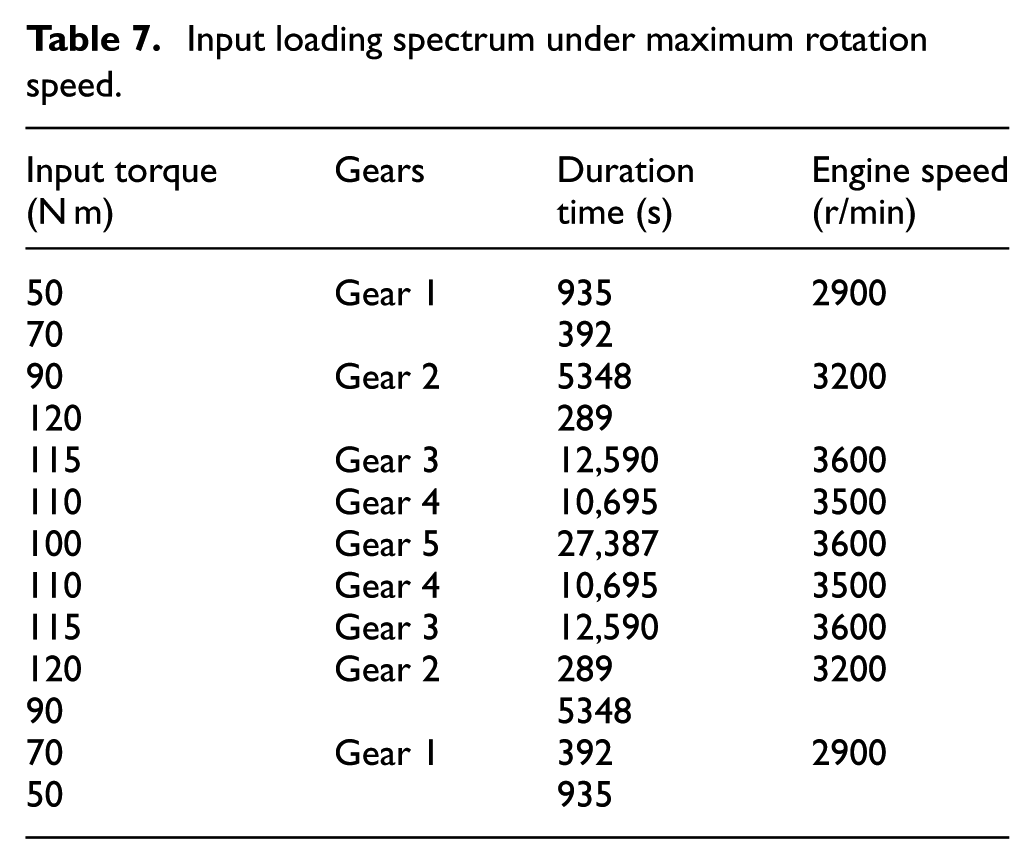
The target mileage is 50,000 km. The gear split process model is shown in Figure 7. Figures 8–12 show the divided rotating rainflow matrix of each gear under the premise that it is equivalent to 90% customer cumulative damage. Considering the input parameter properties which the rig test can identify, the cumulative damage comparison results are shown in Table 5. Tables 6 and 7 show the input loading spectrum for rig test.

Gear data split process model.

Rotating rainflow matrix for gear 1.

Rotating rainflow matrix for gear 2.
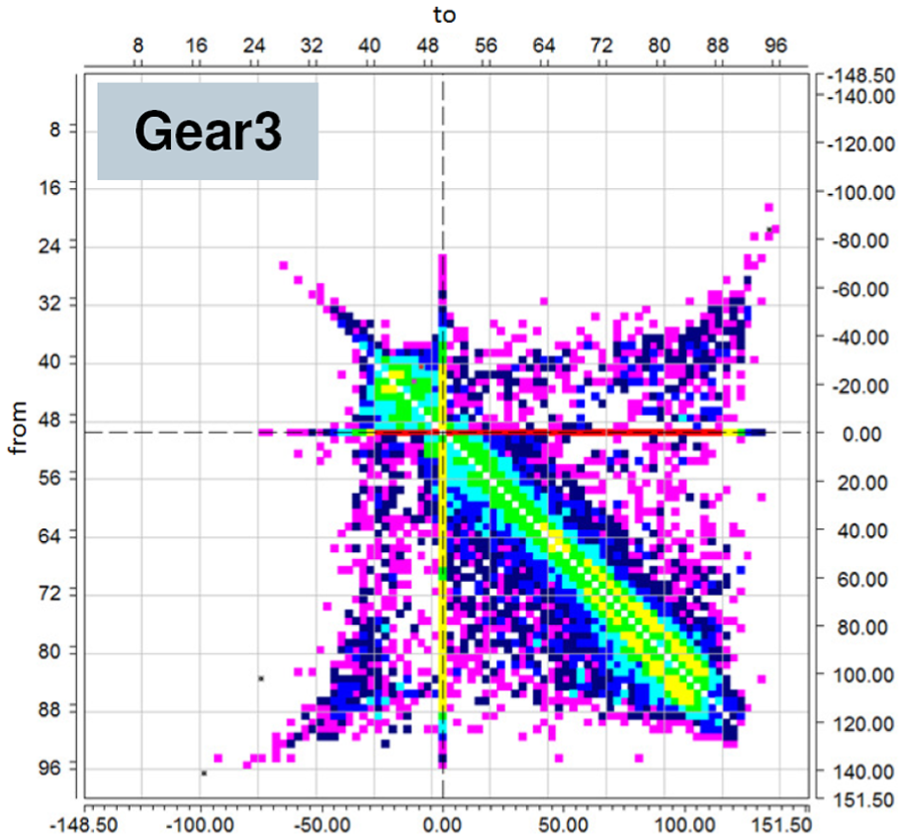
Rotating rainflow matrix for gear 3.

Rotating rainflow matrix for gear 4.

Rotating rainflow matrix for gear 5.
Cumulative damage comparison between full-vehicle road test and rig reliability test.
Input loading spectrum under average rotation speed.

Input loading spectrum under maximum rotation speed.
Conclusion
The actual customer operation testing data in typical cases are collected to establish 90% customer damage calculation model for powertrain, and classified counting is used on powertrain torque and its corresponding rotation speed. Then, the least square method is adopted to estimate the Weibull distribution parameters. Combined with customer survey results, the 90% customer cumulative damage for four typical types of roads used by customers is calculated. Finally, the Monte Carlo simulation method is applied to determine the 90% customer total cumulative damage.
Process Builder Module in Tecware is applied to establish data gear split model for powertrain and process the customer testing data as rotating rainflow counting cyclic matrix to eliminate the small loads which have a relatively smaller influence on fatigue life. According to fatigue damage equivalent principle, the compressed block loading spectrum of passenger vehicle powertrain rig reliability test is obtained.
The loading spectrum formulated integrates the actual vehicle operation cases and rig reliability test and achieves the replacement of full-vehicle road test with powertrain rig reliability test, thus shortening the testing period and lowering the testing cost.
Footnotes
Academic Editor: Baozhen Yao
Declaration of conflicting interests
The author(s) declared no potential conflicts of interest with respect to the research, authorship, and/or publication of this article.
Funding
The author(s) disclosed receipt of the following financial support for the research, authorship, and/or publication of this article: This work was supported by the National Natural Science Foundation of China (nos 51378075 and 51678065), Industrial Technology Research and Development Project of Jilin Provincial Commission of Development and Reform (no. 2015y73), and Key Projects of Jilin Provincial Science and Technology Department (no. 20160204012SF).