
Abstract
Fouling in heat exchangers significantly compromises energy efficiency in crude oil refining, leading to increased operational costs and environmental impacts. This study presents a predictive model aimed at enhancing heat exchanger performance by minimizing fouling resistance. Model fitting was conducted using approaches of varying complexity, with measures taken to avoid overfitting. The models were subsequently refined to incorporate key variables, such as inlet and outlet temperatures and mass flow rates, ensuring robustness and generalizability. The final simplified model comprises only 19 terms, yet achieved high predictive performance (R2 = 0.961; predicted R2 = 0.956) and effectively addressed multicollinearity. The selected model identified significant linear, quadratic, and interaction effects among thermal and flow parameters, with the mass flow rates of the hot fluid (MFH) and cold fluid (MFC) emerging as particularly influential. Notably, the model demonstrated that fouling resistance decreases substantially with increasing hot fluid flow rate. Optimization using a desirability function identified 37 parameter combinations that achieved a fouling resistance (RFC) of 0.001 m2°C/W with a maximum desirability score of 1.00, consistently favoring high MFH values (~93.00 kg/s) and hot fluid outlet temperatures (THO) near 43.00°C. These findings confirm the model’s robustness and practical applicability, providing actionable insights for operational strategies aimed at minimizing fouling while maintaining thermal efficiency.
Keywords
Introduction
Amid escalating energy prices and the gradual depletion of conventional energy resources, enhancing energy efficiency has become a strategic imperative across industrial sectors. This urgency has driven significant advancements in the design and optimization of energy systems, particularly those involving thermal management. The development and application of heat exchangers—key components in thermal management systems—span a broad range of industrial contexts, underscoring their essential role. 1 Heat exchangers facilitate the transfer of thermal energy between fluids without mixing, thereby directly influencing the overall efficiency of numerous processes. 2 To improve heat transfer efficiency, optimize energy recovery, and enhance cost-effectiveness, researchers and manufacturers have explored various strategies, including optimal design, precise control of operating conditions, and routine maintenance. 3 Hameed et al. 4 introduced a novel oscillation technique for multi-tube heat exchangers, demonstrating a fivefold improvement in heat transfer and enhanced thermal performance at specific Reynolds numbers, thus emphasizing the potential of passive technologies for efficiency enhancement.
Despite their advantages, heat exchangers are susceptible to fouling—the accumulation of solid matter on their surfaces—which significantly reduces their operational efficiency. Fouling impairs heat transfer, restricts fluid flow, promotes corrosion, and contaminates working fluids.5,6 These effects result in increased equipment requirements, production losses due to fouling-related downtime, elevated costs for deposit removal, and greater consumption of fuel, water, and electricity across various industrial sectors. 7 The petrochemical industry is among the most severely affected. Deposits can be identified through filtration and chemical analysis, and subsequently addressed via chemical treatments. 8 Following fouling detection, systematic cleaning is required. Short cleaning intervals lead to increased production downtime, whereas extended intervals exacerbate energy consumption and environmental impacts. 9 These challenges highlight the growing importance of predictive maintenance over routine, systematic maintenance.
In response, researchers are increasingly prioritizing the prediction of fouling, prompting the development of methods to enhance predictive accuracy.10,11 Traditional approaches—such as experimental investigations and computational fluid dynamics (CFD) simulations—often face limitations in terms of time efficiency and predictive accuracy when applied to fouling analysis. 12 Consequently, research efforts have increasingly focused on the use of statistical modeling algorithms. For instance. Elghool et al. 13 employed multi-objective optimization for heat pipe–heat sink (HP–HS) systems in thermo-electric generators (TEGs), achieving a 36.7% improvement in thermal efficiency and a 17.9% reduction in cost, thereby demonstrating the potential of integrated design approaches in predictive modeling.
Design of Experiments (DOE) methods are statistical techniques employed to investigate the nonlinear behavior of complex heat transfer systems. Sahin 14 applied the Taguchi method to evaluate the influence of design parameters—such as Reynolds number, fin height, and fin pitch—on the performance of heat exchangers equipped with circular fins. Performance was assessed using the Nusselt number and friction expanded this line of research by analyzing perforated fin configurations under forced convection, demonstrating that square perforations reduced thermal resistance by 16°C and enhanced turbulence, while circular perforations increased heat transfer by up to 51.29% compared to solid fins. Wang et al. 15 addressed triangular leakage zones between tubular heat exchanger baffles by employing response surface methodology (RSM) with a central composite design to study the effects of skew angle, overlap, and inlet velocity on the Nusselt number and pressure drop. Strong correlations were observed, with coefficients of determination of 0.943 for the Nusselt number and 0.999 for the friction factor. Maddah et al. 16 investigated the effects of nanofluid concentration, Reynolds number, and twist ratio on the thermal performance of a double-tube heat exchanger using an Al2O3–TiO2 hybrid nanofluid. Al Kumait et al. 17 further explored nanofluid applications, demonstrating that TiO2/water nanofluids in helical-ribbed tubes enhanced turbulent kinetic energy and Nusselt numbers by approximately 2%, with minimal deviation in friction factor models.
The most critical efficiency characteristics were identified using a full factorial design combined with statistical analyses, including t-tests, ANOVA, and F-tests. Parameters such as nanoparticle concentration, Reynolds number, and swirl ratio were shown to enhance heat exchanger efficiency. Wang et al. 18 investigated heat transfer enhancement in drag-reducing surfactant fluids using photo-rheological counterions, identifying optimal surfactant/counterion concentrations (4 mM/5 mM) that improved thermal performance. Bisognin et al. 19 employed a fractional factorial 25−1 design to evaluate both the individual and interactive effects of particle size, gas velocity, particle thermal conductivity, tube diameter, and tube spacing on the heat transfer coefficient in a fluidized bed heat exchanger with a horizontal tube arrangement. Predictive models were developed based on 16 experimental trials to assess the statistical significance of each coefficient. Chowdhury and Borah 20 analyzed how the heat transfer rate, number of transfer units (NTUs), and heat exchanger efficiency are influenced by the inlet temperature of the hot fluid and the mass flow rates of both hot and cold fluids. These performance characteristics were modeled, analyzed, and optimized using a Box–Behnken design and response surface methodology. The resulting regression models for heat transfer rate, NTU, and efficiency showed strong agreement with experimental data, with R2 and adjusted R2 values exceeding 90%. The study concluded that optimal performance was achieved with hot and cold fluid mass flow rates of 50 and 200 L/h, respectively, and a hot fluid inlet temperature of 80°C. Jradi et al. 21 utilized a central composite design to assess the thermal performance of a cross-flow heat exchanger. Input variables included acid inlet and outlet temperatures, vapor temperature, acid density, volumetric flow rate, and time, while fouling resistance served as the response variable. Both the main effects and interactions of operational parameters significantly influenced fouling resistance. The statistical indicators R2, adjusted R2, and predicted R2 approached 1.0, indicating a high degree of model accuracy, and the regression curves demonstrated strong fit. Finally, Hallaji et al. 22 conducted a comprehensive Taguchi experimental design study to evaluate the reduction in heat transfer and fouling rate of aqueous CaSO4 solutions. They investigated the effects of flow rate, CaSO4 concentration, heat flux, and bulk temperature under conditions of forced convection and supercooled flow boiling. ANOVA results confirmed strong agreement between experimental outcomes and model predictions.
The primary objective of this study is to develop and validate an optimized predictive model for heat exchanger fouling in crude oil refining, utilizing factorial design and multistep regression analysis. This model aims to enable refineries to minimize energy losses, reduce environmental impacts, and optimize maintenance schedules while maintaining operational efficiency. The novelty of this work lies in a comprehensive approach that balances model complexity and predictive accuracy through the systematic reduction of higher-order polynomial terms, while preserving essential interaction effects. In contrast to earlier studies that prioritized maximizing R2 through complex polynomial expansions—often at the expense of severe multicollinearity—this study explicitly addresses overfitting and multicollinearity by employing term elimination and variance inflation factor (VIF) analysis, thereby resolving a critical gap in fouling prediction methodologies.
Methodology
Box–Behnken method
The Box–Behnken design (BBD) is a robust and efficient technique used in response surface methodology (RSM) to optimize experimental processes. Developed by George E. P. Box and Donald W. Behnken in 1960, this design is particularly advantageous because it reduces the number of experimental runs while still providing high-quality predictions for the response variable within the experimental region. 23 BBD is widely applied in various fields, including engineering, chemistry, and biotechnology, due to its ability to efficiently investigate quadratic response surfaces without requiring a full three-level factorial experiment. 24
The relationship between the model response (

where
The Box–Behnken design was employed to evaluate the experimental variables, and Design-Expert software was utilized for regression and graphical analysis. A multicriteria optimization approach based on the desirability function was also applied. 25 The objective of the optimization procedure was to minimize fouling resistance to 0.001 m2°C/W while maximizing heat exchanger efficiency, without compromising other performance criteria.
Evaluation of model effectiveness
To effectively validate a model’s performance, it is essential to employ a range of statistical metrics that assess various aspects, including explanatory power, predictive accuracy, and robustness.26–30 Metrics such as the coefficient of determination (R2), adjusted R2, and predicted R2 evaluate how well the model accounts for variance in the data, thereby offering insights into its explanatory capabilities. Additionally, advanced metrics such as adequate precision, F-statistics, and p-values help assess the model’s reliability and statistical significance. To further examine the model’s fit and complexity, criteria such as the prediction error sum of squares (PRESS), −2 log-likelihood, Bayesian information criterion (BIC), and corrected Akaike information criterion (AICc) are critical. Collectively, these metrics provide a comprehensive evaluation of the model’s performance and its overall adequacy in representing the data.31–35
Experimental procedure and data collection
The atmospheric distillation unit U100 serves as the primary processing unit at a refinery in Algiers. It fractionates crude oil into various end products, including kerosene, diesel, fuel, liquefied gas, and light and heavy solvents. These products may be marketed directly or subjected to further treatment processes. One of the three centrifugal pumps, P101, transfers crude oil from storage tanks at ambient temperature to the atmospheric distillation unit. The oil then flows through two circuits of the E101 heat exchanger battery (CBA and FED). 36 On the tubular side of the battery, the oil is preheated via overhead reflux (RT), consisting of a mixture of light products collected from the top of the C101 distillation column at tray No. 46. Subsequently, the oil passes through an electrostatic desalter, where treated water and caustic soda are added. This mixture is injected both at the inlet of the heat exchanger E101 and at the inlet of the desalter to wash the crude oil and remove the salts present (Figure 1). The inlet and outlet temperatures of the two fluids are measured at the ends of the heat exchanger using four thermocouples. Simultaneously, the flow rates of the crude oil and the return flow at the heat exchanger inlet are monitored using flow meters. The physical properties of the two fluids are provided by the refinery’s control room.

Simplified representation of the crude oil preheating circuit.
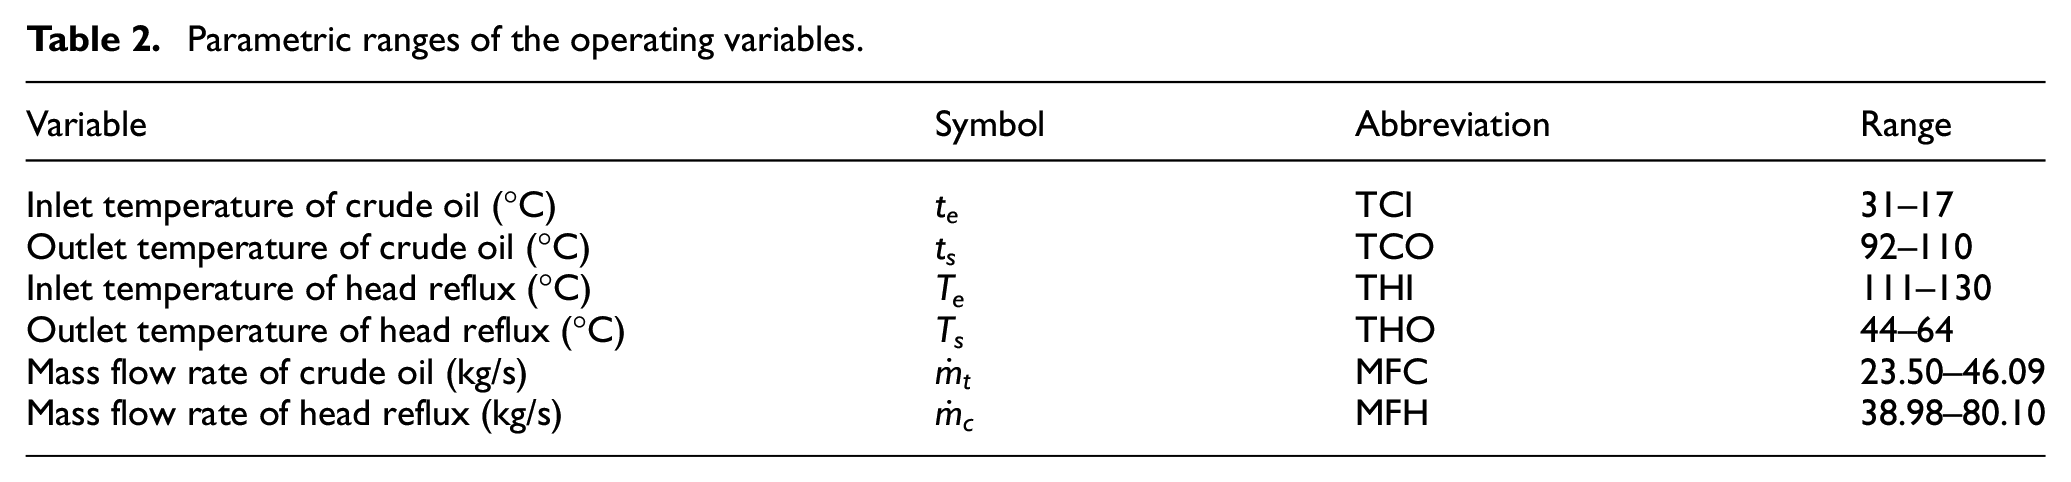
The present study utilized data collected over 290 days, from March 14, 2019, to December 17, 2019, from the E101 CBA heat exchanger cell, located within the preheating circuit of the Algiers refinery. This cell comprises three counterflow shell-and-tube heat exchangers connected in series. The characteristics of these heat exchangers are presented in Table 1. The operating variable ranges corresponding to the heat exchanger used in this study are provided in Table 2.
Characteristics of the E101 CBA heat exchanger.

Parametric ranges of the operating variables.
The experimental calculations of the overall heat transfer coefficient (U
t
) and fouling resistance (

For a quasi-isobaric process, the heat transfer rate from the head reflux to the crude oil can be expressed via an energy balance as:

The overall heat transfer coefficient in the presence of fouling is defined by:

The logarithmic mean temperature difference (ΔT LM ) for a system of three counterflow shell-and-tube heat exchangers is given by:

The heat exchanger under investigation undergoes mechanical cleaning during transitions between operational cycles. Consequently, each new process begins without any fouling. The initial heat transfer coefficient at the start of each process is regarded as the clean design value (U p ).
The fouling resistance over time (RFC) is calculating using the following equation:

To select the optimal operating parameters, the thermal efficiency (ε) is determined by the ratio of the actual heat transfer rate to the maximum possible heat transfer rate, as given by:

The actual heat transfer rate is expressed as:

The maximum possible heat transfer rate is calculated by:

To determine the maximum possible heat transfer rate
Table 3 presents the thermal and flow statistics of the heat exchanger used for crude oil processing. The tubing section includes four temperature variables (A–D). The crude oil inlet temperature (TCI) ranged from 13.00°C to 31.00°C, with an average of 24.25°C and a standard deviation of 4.08°C. This range and variability reflect fluctuations in the incoming crude oil temperature. The crude oil outlet temperature (TCO) varied between 92.00°C and 119.00°C, with an average of 104.16°C, indicating an average thermal increase of approximately 80°C due to heat exchange. The average inlet temperature of the head reflux (THI) was 121.08°C, ranging from 108.42°C to 136.00°C, while the average outlet temperature (THO) was 63.39°C, with a range of 42.00°C–81.00°C. The average temperature drop of 57.69°C in the head reflux highlights its critical role in thermal energy transfer. The shell-side mass flow rates of head reflux and crude oil are represented by MFH and MFC, respectively. The crude oil mass flow rate (MFC) ranged from 23.50 to 92.72 kg/s, with an average of 40.60 kg/s and a standard deviation of 10.46 kg/s. The head reflux mass flow rate (MFH) averaged 54.20 kg/s, with a range of 23.22–91.42 kg/s. Figure 2 illustrates the distribution and behavior of fouling resistance (RFC) in the crude oil refining system. The distribution is right-skewed, with a higher concentration of observations at lower RFC values. The highest frequency was observed in the 0.25 m2°C/W bin, accounting for 46.21% of the data. This indicates that fouling resistance is low nearly half the time, suggesting efficient operational performance.
Statistical analysis of heat exchanger parameters in crude oil processing.


Relative frequency distributions for various RFC categories.
As RFC values increase, their frequency decreases. The 0.75 and 1.25 m2°C/W bins account for 16.77% and 15.16% of the observations, respectively. Only 6.45% of cases exhibited RFC values greater than 2.25 m2°C/W, indicating that high levels of fouling are relatively rare. No occurrences were recorded at 4.25 m2°C/W, and the highest observed bin (4.75 m2°C/W) showed a frequency of just 0.12%, underscoring the infrequency of severe fouling events.
This distribution suggests that the system generally operates under low to moderate fouling conditions. However, periods of elevated fouling resistance may adversely affect performance and increase maintenance requirements.
Additionally, the correlation matrix presented in Figure 3 illustrates the relationships between fouling resistance (RFC) and key process parameters, thereby revealing variables associated with fouling behavior. RFC exhibits the strongest positive correlation with the crude oil inlet temperature (TCI), with a coefficient of 0.502, indicating that higher TCI values tend to increase fouling resistance. This observation is consistent with the variability of TCI reported in Table 3. Conversely, RFC shows a moderate negative correlation with the crude oil mass flow rate (MFC; r = −0.484), suggesting that higher flow rates may reduce fouling due to enhanced heat transfer and decreased deposition. Weaker negative correlations were also observed between RFC and the crude oil outlet temperature (TCO; r = −0.172), head reflux inlet temperature (THI; r = −0.244), and head reflux outlet temperature (THO; r = −0.120). A modest positive correlation was found between RFC and the head reflux mass flow rate (MFH; r = 0.110), indicating a limited influence of this variable on fouling resistance.

Input-output variable correlations.
Results
The model analysis begins with insights from Tables 4 and 5, which evaluate model performance across varying levels of complexity. The results indicate that model fit improves with increasing complexity; however, higher-order models also carry a greater risk of overfitting. Table 4 presents the fit analysis of the reduced quartic model, which was selected by Design-Expert as the optimal model. As the model complexity increases—from linear to fifth-order—the standard deviation decreases from 0.5556 to 0.0761, and model fit metrics improve accordingly. For example, the fifth-order model achieved an R2 of 0.998, compared to 0.606 for the linear model, indicating a much better explanation of data variance. However, this improvement comes at the potential cost of model simplicity and generalizability. In the quartic model, the adjusted R2 and predicted R2 reached 0.9928 and 0.9549, respectively, suggesting a strong balance between fit and predictive ability. The PRESS statistic, which assesses predictive performance, decreased substantially—from 202.86 in the linear model to 8.41 in the cubic model—but rose slightly to 22.54 in the quartic model, indicating a potential onset of overfitting. Since PRESS and predicted R2 values are unavailable for the fifth-order model, the risk of overfitting at that level cannot be excluded. Thus, the quartic model likely offers the best trade-off between complexity and performance.
Model fit analysis across various complexity levels for the reduced quartic model.

Evaluation of model fit and predictive accuracy for the reduced quartic model.

Table 5 supports this conclusion by presenting a detailed evaluation of the reduced quartic model’s fit and predictive accuracy. The model exhibits a low standard deviation of 0.086, indicating minimal dispersion of residuals. It achieves an R2 of 0.992, explaining 99.2% of the variance in the dataset. The adjusted R2 (0.991) and predicted R2 (0.988) are closely aligned, with a difference of only 0.003, suggesting excellent predictive performance and minimal overfitting. The model’s coefficient of variation (C.V.) is 8.11%, reflecting strong precision relative to a mean of 1.06. Furthermore, the adequate precision ratio of 166.010 significantly exceeds the recommended threshold of 4, indicating a robust signal-to-noise ratio.
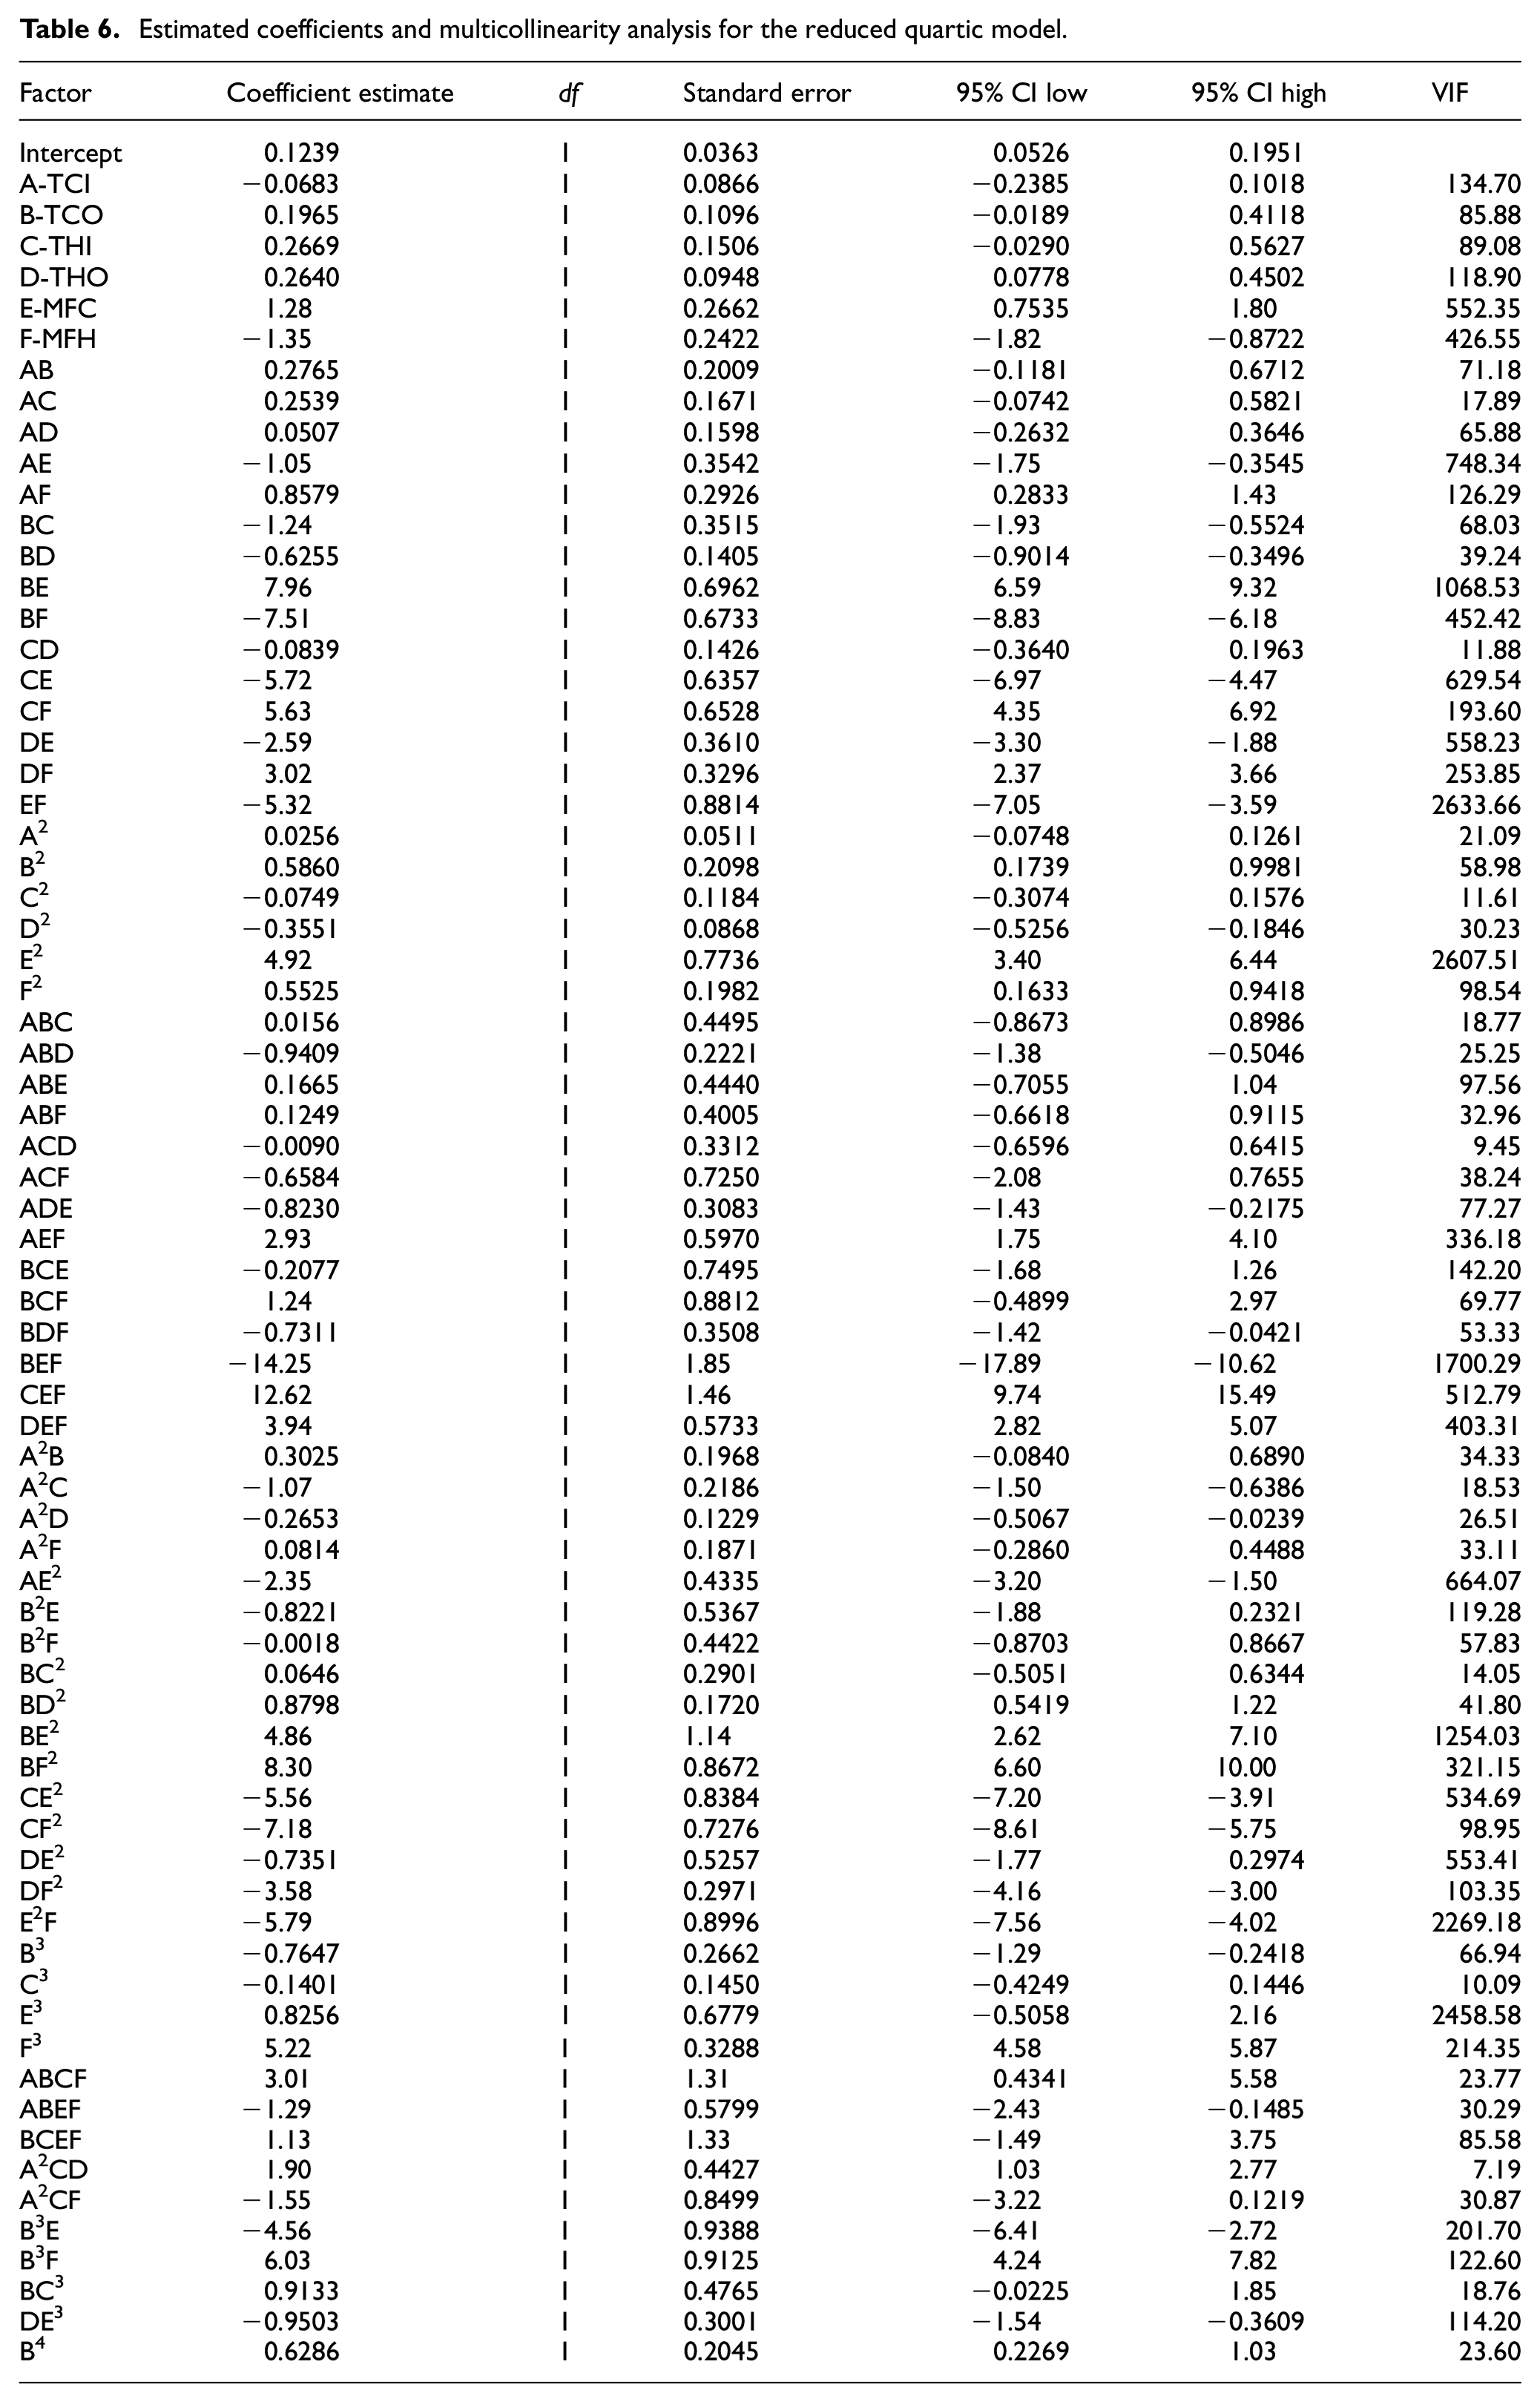
Table 6 and Figure 4 provide additional insights into the characteristics of the reduced quartic model. Table 6 presents a detailed multicollinearity analysis, including estimated coefficients and associated statistical measures. The model comprises 72 terms, ranging from main effects (TCI, TCO, THI, THO, MFC, and MFH) to complex interaction and higher-order terms. A notable feature of the model is the presence of high VIF values for many terms, indicating severe multicollinearity. For example, the interaction term MFC × MFH exhibits the highest VIF of 2633.66, followed closely by MFC2 at 2607.51. These extreme values suggest that these predictors are highly correlated with other variables, which may result in unstable and unreliable coefficient estimates. The main effects MFC and MFH also show substantial VIFs of 552.35 and 426.55, respectively, further highlighting the multicollinearity concern.
Estimated coefficients and multicollinearity analysis for the reduced quartic model.

Statistical analysis of the reduced quartic model’s fit for the crude oil refining process.
The coefficient estimates vary considerably in both magnitude and direction. The largest positive coefficient is 12.62 for the THI × MFC × MFH interaction, while the most negative is −14.25 for TCO × MFC × MFH. Many coefficients—particularly those associated with higher-order interaction terms—exhibit large standard errors relative to their estimated values, resulting in wide 95% confidence intervals that often include zero. This observation suggests that many of these complex terms may not be statistically significant predictors in the model.
Figure 4 presents a statistical evaluation of the reduced quartic model’s fit for the crude oil refining process. The model yielded a notably low PRESS value of 6.19, indicating strong predictive performance. This result suggests that the model’s predictions are likely to be accurate when applied to new, unseen data. Additionally, the −2 log-likelihood value of −1411.37 further supports the model’s excellent fit to the observed data. However, the Bayesian Information Criterion (BIC) of −945.69 and the corrected Akaike Information Criterion (AICc) of −1248.96 are relatively high, which raises concerns. Elevated values for BIC and AICc suggest a poor balance between model fit and complexity, indicating potential overfitting or unnecessary model complexity.
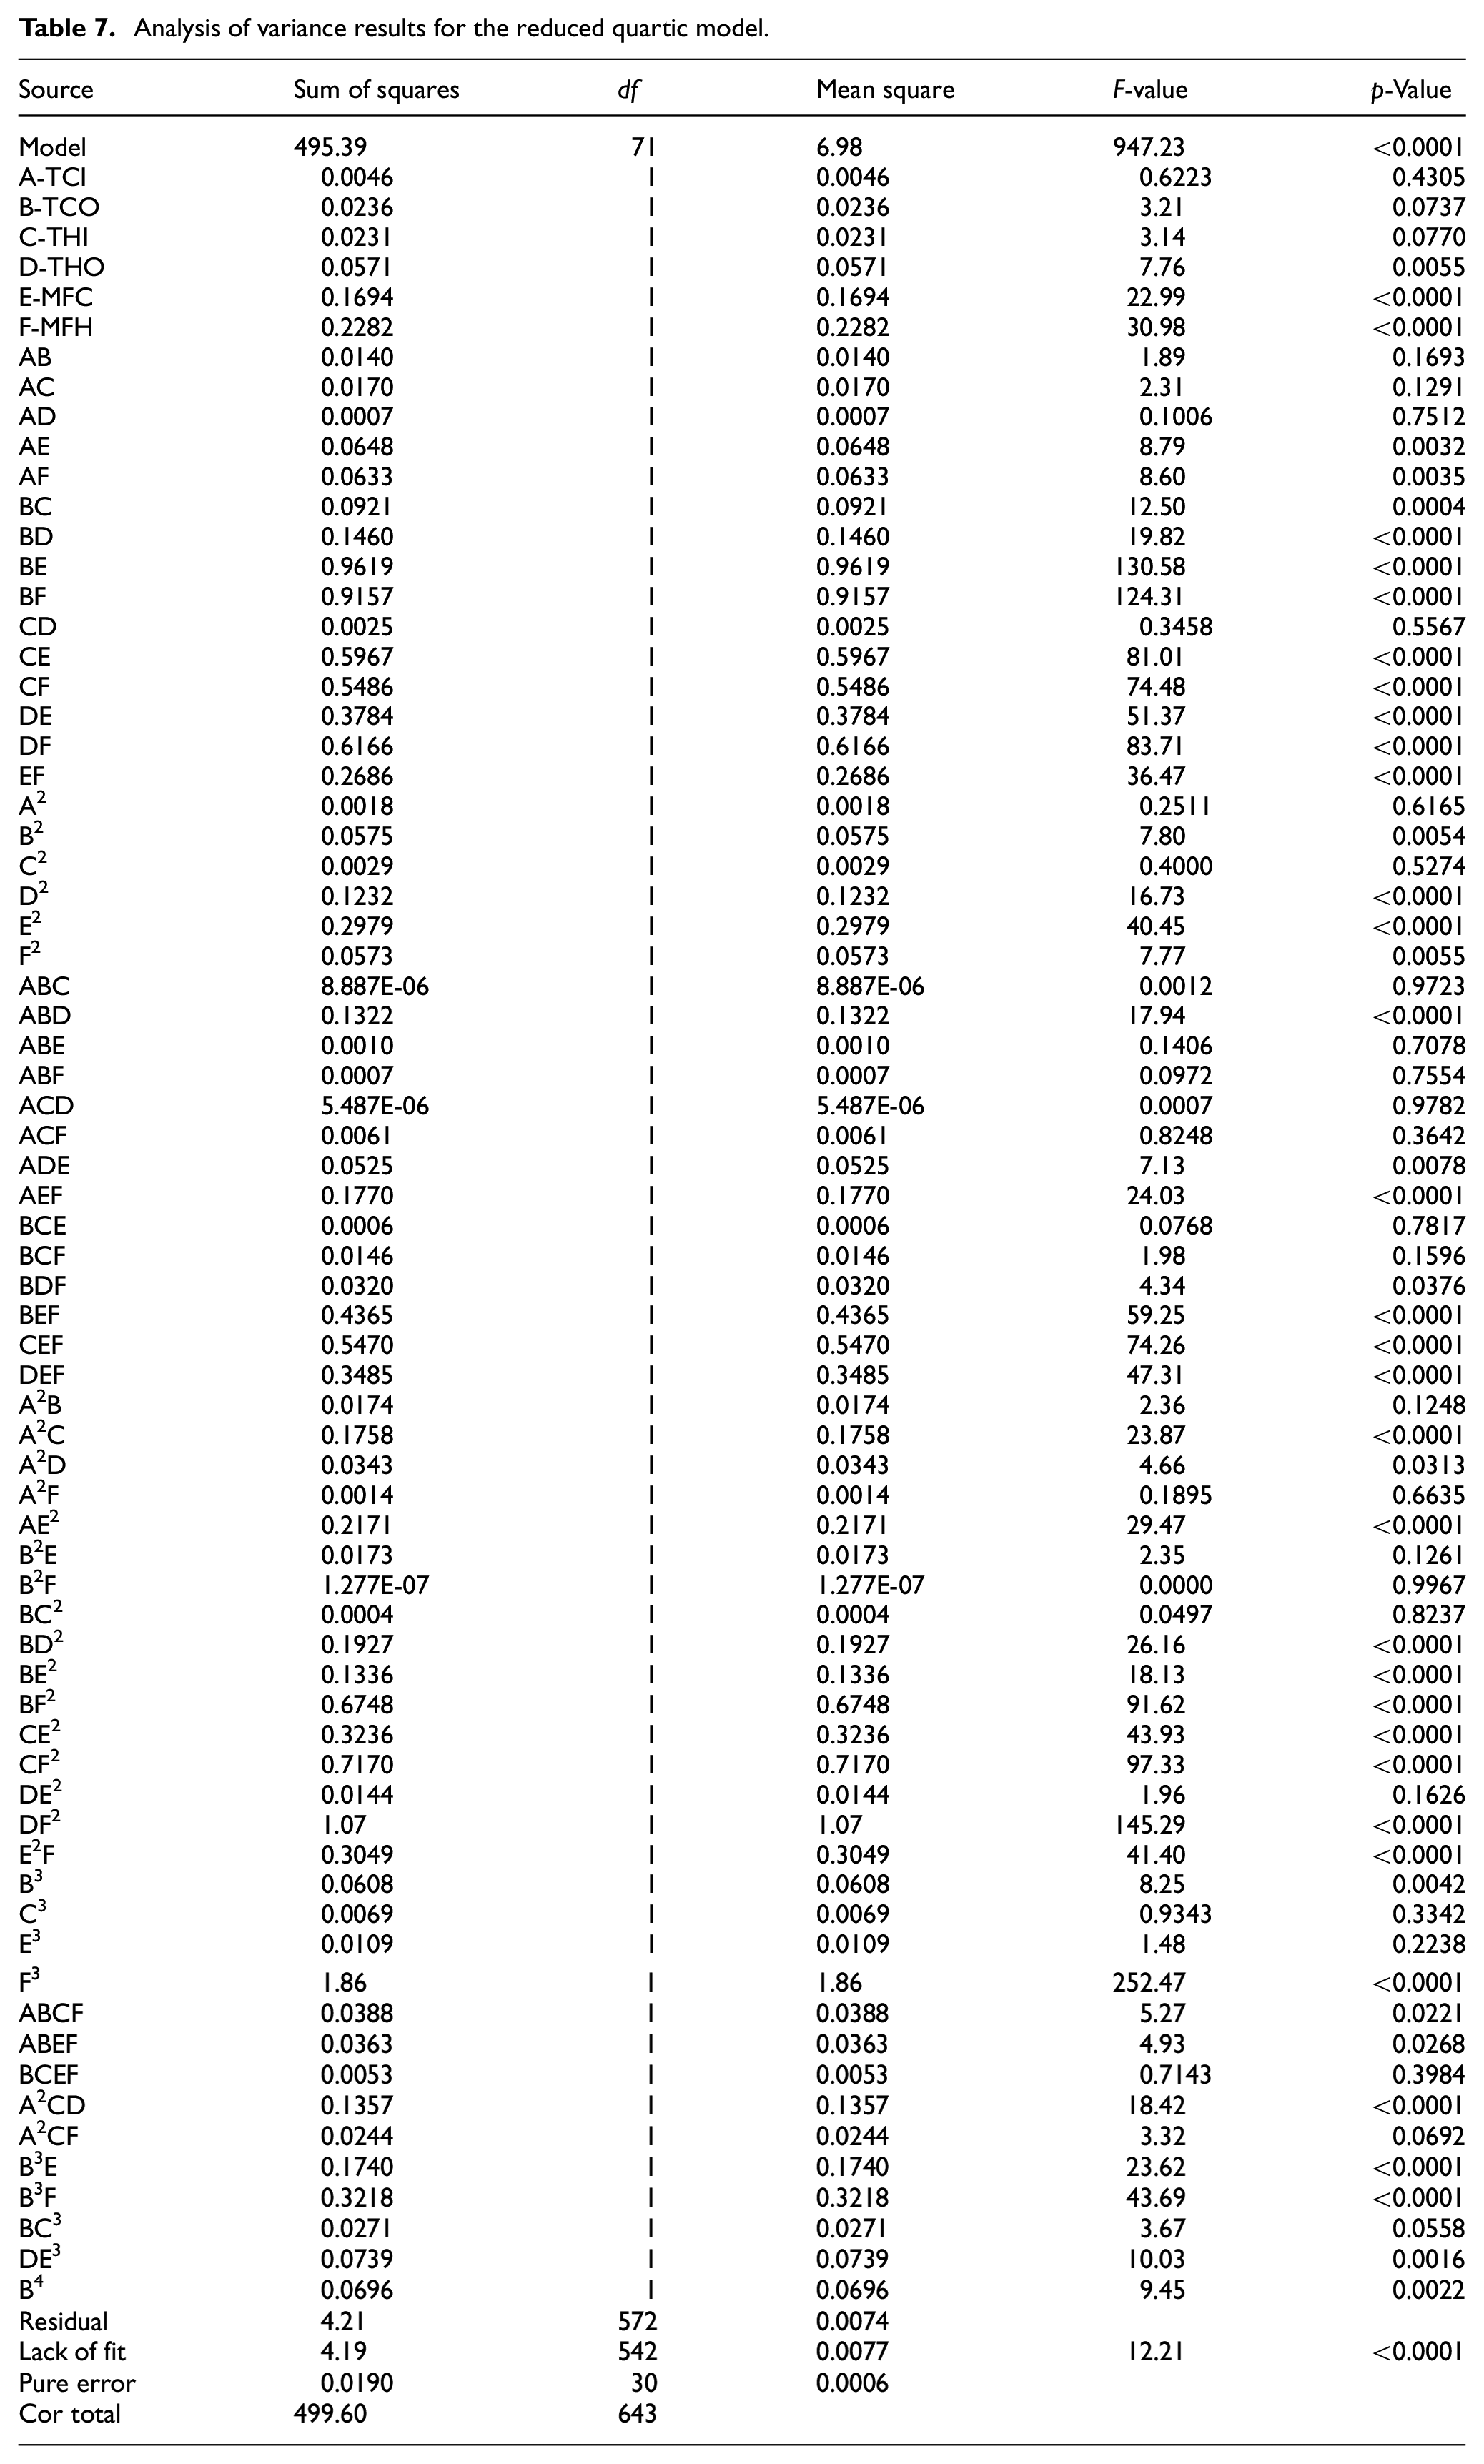
To address the complexity issues identified in the reduced quartic model, Tables 7 and 8 present analyses of variance (ANOVA) for the original and improved models. These analyses aim to resolve the challenges associated with model overcomplexity while maintaining predictive accuracy. Table 7 presents the ANOVA results for the reduced quartic model, highlighting both its strengths and limitations. The model demonstrates strong explanatory power, with an F-value of 947.23 and a p-value of <0.0001, indicating that the model is statistically significant overall. Among the main effects, MFC (E) and MFH (F) exert substantial influence (p < 0.0001), whereas TCI (A) shows minimal impact (p = 0.4305). Several interaction terms—BE, BF, CE, CF, DE, and DF—are also highly significant (p < 0.0001), indicating complex interactions among variables. Higher-order terms such as F3 (p < 0.0001) and B 4 (p = 0.0022) capture significant nonlinear effects. However, despite its high explanatory power, the model demonstrates a significant lack of fit (F = 12.21, p < 0.0001), raising concerns about its ability to fully capture variability in the data. In addition, elevated BIC and AICc values suggest the presence of unnecessary or redundant terms, contributing to excessive model complexity.
Analysis of variance results for the reduced quartic model.
Analysis of variance results for the selected model.

Table 8 presents the ANOVA for a revised model designed to resolve these overcomplexity issues. This improved model includes only 19 terms, significantly reducing model complexity while preserving strong explanatory performance (F = 821.09, p < 0.0001). All retained terms are statistically significant (p < 0.0001). The primary effects A–TCI, D–THO, E–MFC, and F–MFH are especially influential, with F–MFH exhibiting the highest F-value (104.20). Among the interaction terms, BE (1733.50), CE (694.94), and DF (391.15) show exceptionally high F-values, highlighting strong synergistic effects. Quadratic terms (B2, D2, E2, and F2) are also present, with E2 being the most significant (F-value = 591.36), suggesting pronounced nonlinear effects. The simplified model reduces the number of terms from 71 in the reduced quartic model to 19, improving interpretability, reducing overfitting risk, and enhancing generalizability. Despite these improvements, the simplified model still exhibits a significant lack of fit (F = 50.99, p < 0.0001), implying that some systematic variation in the data remains unaccounted for.
The selected model is presented in Tables 9 and 10 and compared visually in Figure 5. Table 9 outlines the estimated coefficients for the selected model, highlighting key interactions in the crude oil refining process. This model includes several prominent interaction terms, notably BE (MFC × THI), which has a coefficient of 4.71—indicating a strong positive synergistic effect between these variables. This interaction also features a narrow confidence interval (4.49–4.94) and a low VIF of 6.76, underscoring its reliability and statistical importance. In contrast, the CE (MFC × TCO) interaction demonstrates a significant negative effect, with a coefficient of −3.47 and a confidence interval ranging from −3.73 to −3.21.
Coefficients for the selected model.

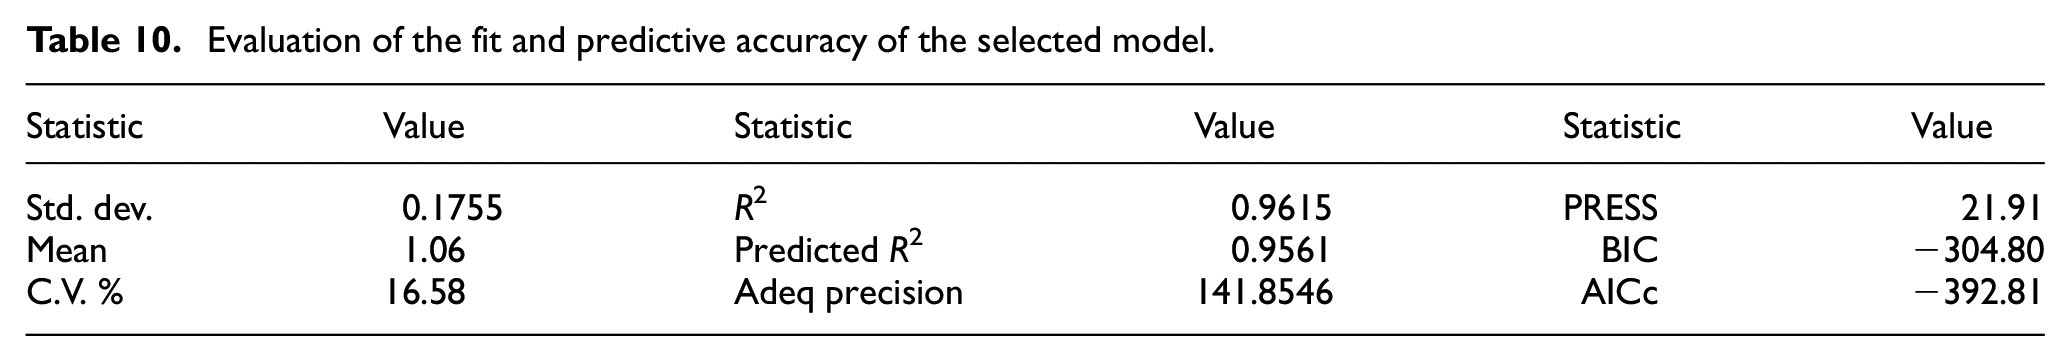
Evaluation of the fit and predictive accuracy of the selected model.
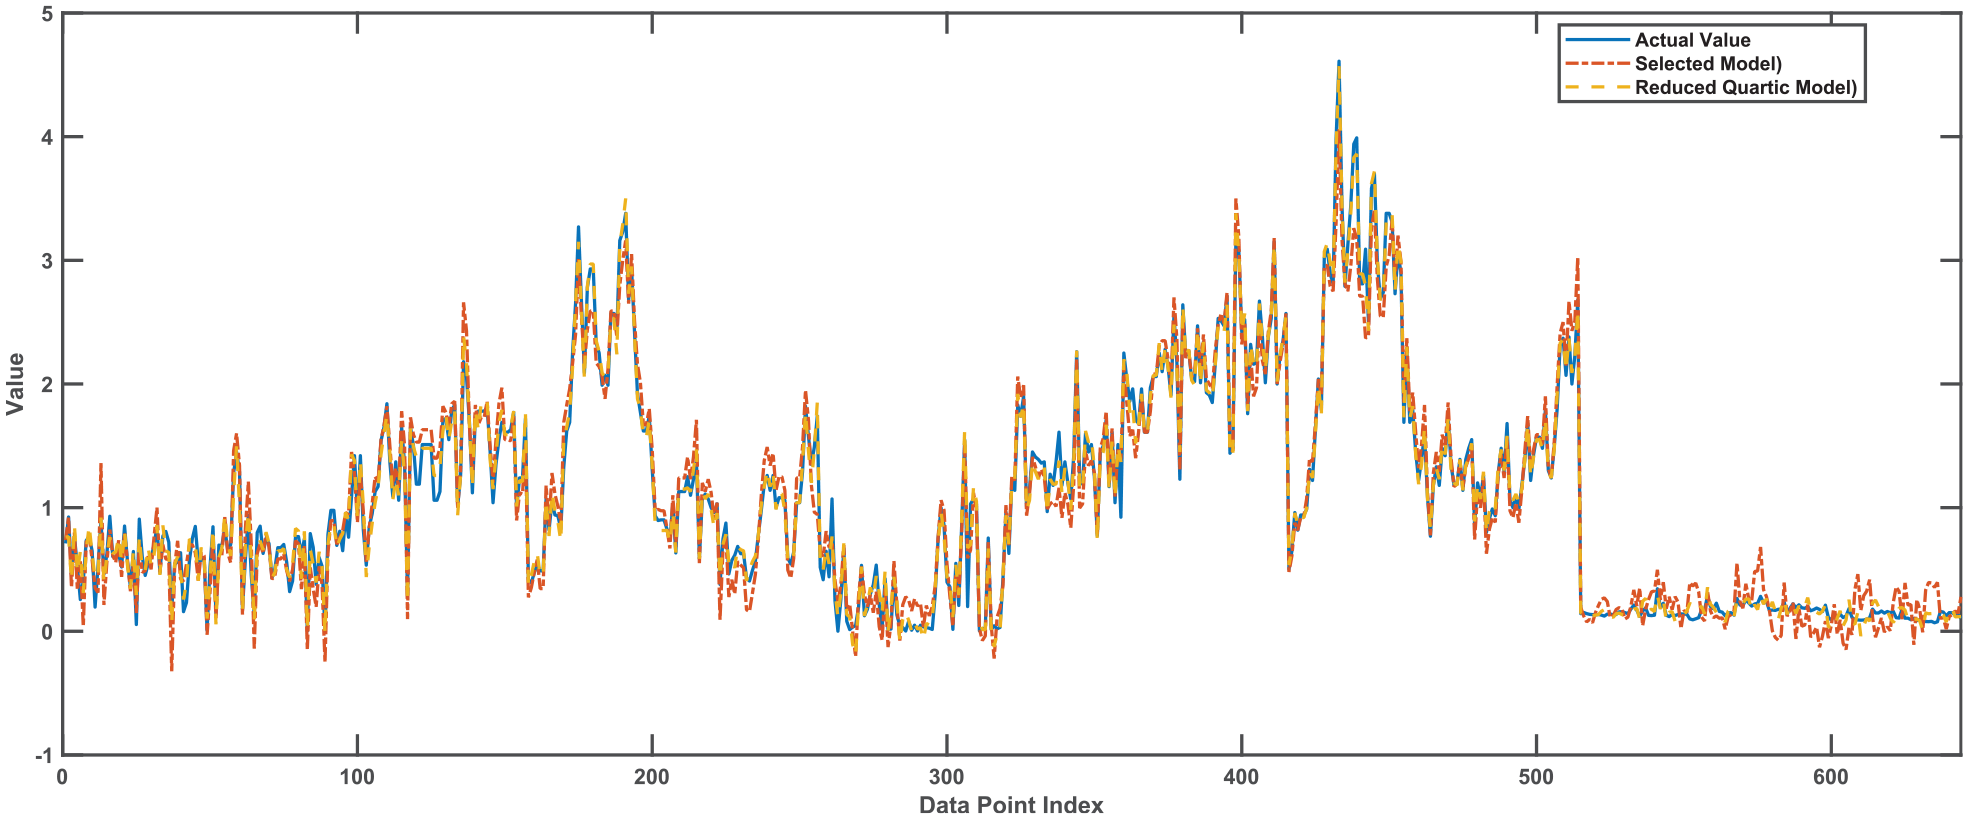
Comparison of actual and predicted values.
The primary effects differ significantly, with MFH (F) having the most detrimental impact (−1.33) and MFC (E) exhibiting the most favorable impact (0.9394). However, the MFC term shows a high VIF of 43.55, suggesting the presence of multicollinearity. The quadratic terms indicate notable nonlinear effects, particularly for E2 (MFC2), which has a substantial positive coefficient of 4.63, suggesting significant curvature in the response surface. However, E2 also has a high VIF (37.75), implying possible correlation with other predictors. Both positive and negative quadratic effects are observed: B2 (THI2) and E2 (MFC2) exhibit positive effects, while D2 (THO2) and F2 (MFH2) exhibit negative effects. Among these, E2 appears to be the most influential quadratic term in the refining process, followed by F2 (−1.77). Despite the elevated VIF values, the confidence intervals for these terms are relatively narrow, indicating high precision in the coefficient estimates.
The fit and predictive accuracy of the selected crude oil refining model are evaluated in Table 10. The model demonstrates a high coefficient of determination (R2) of 0.9615, accounting for 96.15% of the variance in the dataset. Its strong predictive capability—without evidence of overfitting—is confirmed by a predicted R2 of 0.9561. The model’s standard deviation of 0.1755 indicates low residual dispersion, while a coefficient of variation (C.V.) of 16.58% reflects moderate relative variability. Furthermore, the model’s ability to navigate the design space effectively is supported by a high signal-to-noise ratio of 141.8546, substantially exceeding the recommended threshold of 4.
The model’s predictive strength is further reinforced by a low PRESS value of 21.91, which supports the high predicted R2 and confirms the model’s reliability despite its reduced complexity. The negative values of the Bayesian Information Criterion (BIC = −304.80) and the corrected Akaike Information Criterion (AICc = −392.81) indicate a favorable balance between model fit and complexity, with lower values generally preferred. These improvements demonstrate that the simplified model performs better than the more complex reduced quartic model in terms of both parsimony and accuracy. Figure 5 illustrates that the selected model aligns more closely with the actual data points compared to the previous model, reinforcing its utility despite its more streamlined structure.
Figure 6 illustrates the relationships between key parameters and the coded response factor (RFC), complementing the statistical analysis presented in the preceding tables. Several variables are shown to influence heat exchanger fouling resistance and efficiency. In Figure 6(a), the RFC decreases from 0.2 to −0.2 as the crude oil inlet temperature (TCI) increases from 13°C to 31°C, indicating a modest negative linear trend. This observation aligns with the positive correlation between TCI and RFC shown in Figure 3, suggesting that higher TCI levels may contribute to reduced fouling resistance. As depicted in Figure 6(b), the RFC peaks between 62°C and 71.5°C, exhibiting a nonlinear, quadratic relationship with the hot fluid outlet temperature (THO). This behavior supports the presence of significant quadratic effects, as reflected in Table 9, further validating the inclusion of quadratic terms in the selected model.

Effects of key operating parameters on the fouling resistance (RFC) of a heat exchanger system.
Figure 6(c) and (d) provide insights into heat exchanger system optimization, highlighting complex nonlinear interactions. Figure 6(c) illustrates a parabolic relationship between the cold fluid mass flow rate (MFC) and RFC, with a minimum fouling resistance of approximately 0 m2°C/W observed at MFC values between 58 and 63 kg/s. This suggests that a moderate increase in MFC can reduce fouling resistance, whereas excessively high flow rates may lead to increased fouling due to enhanced turbulence. Therefore, careful calibration of MFC is required to achieve optimal performance. The inclusion of both linear (MFC) and quadratic (MFC2) terms in the selected model (see Table 9) captures this complex relationship. Similarly, Figure 6(d) reveals a concave relationship between the hot fluid mass flow rate (MFH) and RFC. While moderate MFH values appear to slightly reduce fouling resistance, significantly high flow rates result in a substantial decline in RFC. However, optimizing for high MFH values must consider potential trade-offs, such as increased energy consumption and efficiency losses. As shown in Table 9, the selected model includes both negative linear (MFH) and quadratic (MFH2) terms, accurately reflecting these observed correlations.
Table 11 presents the optimization outcomes, synthesizing the insights from the preceding analysis. The results indicate that the application of the desirability function technique effectively reduced the heat exchanger fouling resistance (RFC). This outcome is attributed to the predictive capacity of the selected model and the parameter relationships illustrated in Figure 6. Out of 100 evaluated scenarios, only 37 achieved the target RFC of 0.001 m2°C/W with an ideal desirability score of 1.000. These optimal solutions exhibit consistent patterns in several parameters, most notably a hot fluid outlet temperature (THO) of 43.00°C and a hot fluid mass flow rate (MFH) of 93.00 kg/s. In contrast, other parameters—such as the cold fluid inlet temperature (TCI) and its mass flow rate (MFC)—exhibited greater variability. As shown in Figure 6(c) and (d), the interactions among MFC, MFH, and RFC are complex and nonlinear, featuring both parabolic and inverse parabolic trends. These findings underscore the importance of carefully balancing thermal and flow variables to optimize fouling resistance.
Optimal parameter configurations for minimizing fouling in heat exchangers.

The results validate the accuracy of the model presented in Table 9 for forecasting system behavior and offer valuable insights into the operational flexibility of heat exchangers. The model’s ability to capture complex system dynamics enables it to achieve optimal RFC values across a wide range of input conditions, indicating the existence of multiple efficient operating strategies. The consistent presence of high hot fluid mass flow rates (MFH) among the top-performing solutions reinforces the finding that elevated MFH values significantly reduce fouling resistance. This is supported by the negative linear and quadratic coefficients for MFH in the selected model (Table 9). These optimization results further confirm the intricate interactions among system variables, as indicated by the significant interaction terms in the prior analysis. Moreover, they provide practical guidance for operating heat exchanger systems to minimize fouling resistance while maintaining thermal efficiency under diverse operating conditions. Although the simplified model is less complex than the reduced quartic model, the optimization outcomes demonstrate its robustness and practical applicability in supporting operational decision-making (Table 9).
Discussion
The development of the quartic regression model for predicting fouling resistance in crude oil refining heat exchangers represents a significant advancement in balancing statistical rigor with operational utility. The observed progression in model performance—from linear to higher-order polynomials—demonstrates the classic trade-off between model fit and overfitting, a key consideration in thermal systems modeling. This trend aligns with the findings of Jafari et al., 37 who reported optimal predictive performance using response surface methodology (RSM) for spiral heat exchangers, while also cautioning against the multicollinearity risks introduced by interaction and quadratic terms. The present study addresses this issue directly through variance inflation factor (VIF) analysis, systematically removing terms with excessive collinearity while preserving essential interactions.
The statistical validation metrics achieved by the reduced quartic model reflect significant improvements over previous approaches. The substantial reduction in predictive residual error sum of squares (PRESS = 21.91) and the high signal-to-noise ratio (141.85) demonstrate superior predictive accuracy and model robustness. These improvements surpass those reported in comparable studies, including the central composite design (CCD) model proposed by Jradi et al. 21 (R2 = 0.988) and the VIF-agnostic quadratic model of Wang et al. 15 Notably, the present model retains only the most impactful nonlinear terms (e.g. MFC2 and MFH2), consistent with nanofluid behavior described by Maddah et al., 16 while introducing a replicable term-elimination framework—an element often overlooked in the design of experiments literature.19,20
From a practical standpoint, the optimization scenarios summarized in Table 11 identified operational settings—specifically, THO = 43°C and MFH = 93 kg/s—that achieved minimal fouling resistance (RFC = 0.001 m2°C/W), aligning with the 10.4% efficiency gain trends reported by Guo et al. 38 However, the nuanced balance between high MFH rates and turbulence-induced fouling, as illustrated in Figure 6(d), underscores the importance of strategic parameter tuning. This observation mirrors the operational complexity highlighted by Al Kumait et al. 17 in nanofluid-enhanced systems and reinforces the need for a multifactorial optimization framework.
A key innovation of this study lies in the quantitative control of multicollinearity through VIF thresholds. By systematically excluding terms with VIF values exceeding 2000—such as MFC × MFH—the model avoids the coefficient instability reported in previous studies. This approach is consistent with best practices described by Jaberi and Ghassemi, 39 who addressed similar concerns in factorial design modeling for desalination systems. The final model, reduced by 73% (from 72 to 19 terms), maintained high predictive performance (R2 = 0.9615; predicted R2 = 0.9561), exceeding the R2 range (0.943–0.999) typically reported for RSM-based models.15,21
Furthermore, the use of the desirability function within Design-Expert software highlighted the role of nonlinear curvature effects, particularly in the relationship between MFC and RFC. This finding resonates with the work of Li et al., 40 who showed that neglecting curvature in finned-tube heat exchanger optimization led to suboptimal outcomes. Likewise, the identification of an optimal THO near 71°C for fouling minimization supports the conclusions drawn by Jiang et al. 41 regarding crystallization fouling thresholds in non-metallic exchangers.
The model’s interaction terms also provide deeper insights into process behavior. For instance, the parabolic response of RFC to MFC (see Figure 6(c)) aligns with the nonlinear turbulence–resistance relationships reported by Ibrahim et al. 42 The identification of specific thresholds—such as the RFC minimum in the 58–63 kg/s MFC range—offers practical guidance not typically available from CFD-based studies, 12 reaffirming the value of empirical modeling for real-time decision-making.
Finally, the integration of diagnostic tools such as PRESS, R2 disparity, and lack-of-fit analysis facilitated effective overfitting control. This approach is consistent with findings by Song et al., 43 who emphasized the adverse effects of multicollinearity on model reliability in plate heat exchangers. Despite modest lack-of-fit indicators, the performance of the simplified model suggests that further improvements may be achieved by hybridizing with machine learning or physics-informed frameworks—an approach already explored by Alqahtani et al. 44 and van Veen 45 in nanofluid and steam injection modeling, respectively.
Conclusions
This study was conducted to address the critical need for effectively modeling and optimizing the performance of heat exchanger systems in crude oil refining operations, with a particular focus on minimizing fouling resistance. The objective was to develop a predictive model that balances statistical adequacy and interpretability while reliably estimating system behavior under varying operating conditions. Given the complexity and nonlinear interactions among thermal and flow parameters, the aim was to identify a model that not only provides a high-quality fit to empirical data but also avoids the typical pitfalls of overfitting and multicollinearity associated with high-complexity regression models.
To achieve this, a series of polynomial regression models—ranging from linear to fifth-order—were developed and evaluated using Design-Expert software. Performance was assessed using statistical indicators such as R2, adjusted R2, predicted R2, PRESS, and VIF, alongside ANOVA diagnostics and multicollinearity analyses. The initial results showed that increased model complexity improved variance explanation but at the cost of overfitting, as indicated by the lack of projected R2 and PRESS values for the highest-order models. The initial reduced quartic model demonstrated near-optimal fit (adjusted R2 = 0.9928; predicted R2 = 0.9549), but suffered from severe multicollinearity, with VIF values exceeding 2600 for some predictors—limiting its interpretability and generalizability.
A simplified model was then developed, reducing the number of terms from 71 to 19. This model retained high predictive power (R2 = 0.9615; predicted R2 = 0.9561), with a lower residual standard deviation (0.1755) and a significantly reduced PRESS (21.91), indicating robust predictive reliability. It also achieved improved information criteria values (BIC = −304.80; AICc = −392.81), reflecting a more balanced trade-off between model fit and simplicity. While multicollinearity was not entirely eliminated—some terms, such as MFC, still exhibited elevated VIFs—its most extreme manifestations were effectively mitigated, contributing to greater model stability.
The final model yielded meaningful insights into system behavior. It identified MFH (hot fluid mass flow rate) and MFC (cold fluid mass flow rate) as the most influential variables, both in their linear effects and through their interactions and quadratic terms. Notably, the MFC × THI and MFC × TCO interaction terms exhibited strong synergistic and antagonistic effects, respectively, as evidenced by their tight confidence intervals and high F-values. The quadratic effects of MFC2 and MFH2 revealed significant nonlinear trends relevant to system optimization. These findings were visually supported by response surface plots and interaction diagrams, which showed parabolic and concave patterns in RFC behavior. For instance, RFC was minimized within the 58–63 kg/s range of MFC and maximized at intermediate THO values, highlighting the complexity of the response surface and the necessity of multidimensional optimization.
In summary, this study demonstrates that simplifying a high-complexity regression model to retain only statistically significant and operationally meaningful terms can yield a robust, interpretable, and highly predictive framework for optimizing heat exchanger performance in crude oil refining. The final model preserves key linear, interaction, and nonlinear effects while mitigating overfitting and multicollinearity. Through rigorous statistical evaluation and optimization analysis, it offers actionable insights for engineers and plant operators, supporting efforts to reduce fouling resistance, enhance energy efficiency, and improve overall process reliability. Future research should explore the real-time implementation of such models, the incorporation of dynamic process variables, and the integration of machine learning techniques to increase adaptability and scalability across diverse industrial contexts.
Footnotes
Handling Editor: Sharmili Pandian
Author contributions
Conceptualization: K.I., K.D., N.B.; methodology and software validation: K.I., K.D., N.B., B.Z.; formal analysis and writing—original draft: K.I., K.D., N.B., R.A., D.A., J.A.Y., B.Z., L.M., C.A.G.S.; writing—review and editing: N.B., C.A.G.S., L.M., I.C.; visualization: K.I., N.B., I.C. All authors have read and agreed to the published version of the manuscript.
Funding
The author(s) received no financial support for the research, authorship, and/or publication of this article.
Declaration of conflicting interests
The author(s) declared no potential conflicts of interest with respect to the research, authorship, and/or publication of this article.
Data availability statement
The authors confirm that the data supporting the findings of this study are available within the article.