
Abstract
Centrifugal fans are widely used in various industries. When the efficiency of the centrifugal fan is low, it is often desired to improve its efficiency by replacing the impeller and keeping other components unchanged. The blade angle distribution on the blade streamline can produce different shape blades, which will affect the efficiency of the impeller. However, the blade angle distribution law of the centrifugal fan with good performance is still unclear. In order to improve the performance of centrifugal fans by adjusting the blade angle distribution law, the four different blade angle distribution optimization strategies are designed, the best performance centrifugal fan is obtained through comparative analysis. The investigation shows that compared with the original fan, the efficiency of schemes 1–2 and 4–3 is increased by more than 5%. The pressure distributions on the blade surface are more uniform for schemes 3–6 and 4–3. For schemes 1–2 and 4–3, the number and area of low-pressure zones between the inlet blades are reduced, and the vortices and secondary flows between blades are reduced. Therefore, the impeller performs better under all flow rate operation conditions. The investigation of the external characteristic experimental test of the selected schemes reveals, that the efficiency of schemes 1–2 and 4–3 is 5%–10% higher than the original fan. Scheme 4–3 has a wider high-efficiency area, better overall efficiency, and lower power than scheme 1–2. Scheme 4–3 can meet the pressure rise requirements of the fan, and is an optimal fan optimization scheme with the best fan performance. In this paper, the effect of blade angle distribution on centrifugal fan is studied, and the efficiency of centrifugal fan is improved significantly. The achievements provide scientific guidance for performance optimization of centrifugal fan.
Introduction
Centrifugal fans are widely used in chemical industries, mines, metallurgy, agriculture, and breeding. 1 The core component of the centrifugal fan is the impeller, which directly affects the aerodynamic performance of the centrifugal fan. Therefore, optimizing the centrifugal fan impeller to improve its aerodynamic characteristics is of great significance for the safe and efficient operation of the fan.
Blade shape is the key factor affecting the performance of centrifugal fans. Wang et al. 2 found that the aerodynamic performance of the fan can be significantly improved by appropriately trimming the blade leading edge. Wang et al. 3 improved the flow rate and aerodynamic performance of the fan by proposing bionic equal-thickness blades (BETBs) to optimize the centrifugal fan. Zhou et al. 4 used multi-arc and complex curved blades to improve the aerodynamic performance of centrifugal fans. Ragauskas et al. 5 optimized the centrifugal fan by controlling blade shape with two design variables. Meng et al. 6 obtained optimization parameters of multi-blade centrifugal fan by proposing an optimization process combined the extreme learning machine (ELM) with particle swarm optimization (PSO) to optimize the blade profile. Zheng et al. 7 acquired improved optimized centrifugal fan by adjusting the linear fitting function of the radian edge of the front disk of the impeller. Zhang et al. 1 applied the steepest descent method to modify the blade profile of backward centrifugal fan and demonstrated optimized blade profile along the gradient descent effectively increased the total pressure and efficiency of the original model. Shao et al. 8 designed a new type of centrifugal fan blade by extracting the mid-arc section from the prototype blade to integrate an airfoil, which was transplanted and coupled to the mid-arc section in order to improve the airflow characteristics and performance of centrifugal fan. Zheng et al. 7 investigated the impact of different shroud streamlines on the performance of centrifugal fans, found that increased curvature increased the inter-blade flow channel flow and decreased flow loss. Ou et al. 9 explored the impact of load distribution between main and splitter blades on aerodynamic performance for high-load centrifugal compressors, the results showed that appropriately reducing the load ratio of the splitter blades are beneficial to suppressing the vortex of the splitter blades and reducing the suction surface. In summary, changes of blade shape can significantly affect the starting performance of the fan.
The blade shape is determined by the inlet angle, outlet blade angle, and the blade angle distribution rules on the blade streamlines. Researches show that the blade inlet angle and outlet angle are key parameters affecting performance of fluid machinery. Ye et al. 10 used experimental investigation to optimize the blade inlet angle and outlet angle of the mixed flow impeller based on the sound surface method. Hamzah et al. 11 found the optimum blade inclination angle for best performance of vortex turbines by studying effect of four variations of angle blade inclination on the performance of vortex turbines. Chen et al. 12 obtained the optimal blade inlet angle to effectively improve pump performance by studying the effect of six different blade inlet angles on the performance of a single-blade centrifugal pump impeller. Cheng et al. 13 studied the influence of different blade angles on the hydraulic characteristics of shaft tubular pump through model tests to obtain the corresponding blade angle for the optimal efficiency point. Sakran et al. 14 studied the influence of blade outlet angle on the hydraulic performance of centrifugal pump, and found that the change of blade outlet angle can affect the static pressure, relative velocity and energy loss in the pump, and the increase of blade outlet angle leaded to the rise of water head and pressure. Chen et al. 15 studied the effects of four different blade inlet angles on the performance of single-blade centrifugal pump, and found that appropriately increasing the blade inlet angle could increase the range of high pressure zone in the middle of the impeller and improve the energy conversion capacity of the impeller. Too small or too large blade inlet angle was not conducive to reduce the impact loss caused by the collision between the impeller outflow flow and the liquid flow in the volute. Fordjour et al. 16 studied the influence of blade inlet angle on the hydraulic performance of pump as turbine (PAT), found that the hydraulic performance increased with the increase of blade inlet angle. Gulabrao and Khedekar 17 investigated four centrifugal pump models’ static load state and vibration characteristics with different blade outlet angles to optimize the outlet angle. Xiao et al. 18 investigated the impact of blade angle on centrifugal fan performance, found that increasing the blade angle can improve fan efficiency. Ding et al. 19 explored the impact of five different blade outlet angles on the performance of centrifugal fans, concluded that changing the blade outlet angle impacted fan performance significantly. Zhou and Wang 20 investigated the effect of a mixed-flow pump’s blade outlet inclination angle on hydraulic performance, found that a positive blade outlet inclination angle can reduce the impeller outlet pressure pulsation while a negative inclination angle increased the head. It can be seen that the blade inlet angle and outlet angle are important parameters to optimize the performance of various kinds of fluid mechanical.
There are no unified design standard and methods for changing the blade angle from the inlet to the outlet. The blade angle distribution pattern between the inlet angle and outlet angle on the blade streamlines is an important factor affecting fluid machinery. 21 Some scholars conducted investigations on this issue. Pan et al. 22 analyzed the impact of single-arc, double-arc, and linear blade angle distributions on the performance of centrifugal pumps. The authors found that the double arc and linear blade angle distributions were similar in the impact of the pump head. The centrifugal pump head with a single-arc blade was slightly lower. Wang et al. 23 designed forward-bending blade hydraulic turbine impellers with three different blade angle distributions: linear, cubic polynomial, and quintic polynomial. They found that the impeller with a linear blade angle changing performed better and was characterized by a flatter efficiency curve in non-optimal operating conditions. Ruan et al. 24 designed low-specific-speed Francis turbine blades for cooling towers with three different blade angle distributions: linear, convex, and concave. The results show that the turbine with concave blades owned higher efficiency under small flow rate conditions while the turbine with convex blades owned greater power under large flow rate conditions.
All the studies above show that the blade’s inlet angle, outlet angle, and angle distribution patterns between them along the blade streamlines are key factors affecting the performance of the impeller. These parameters are collectively called the blade angle distribution patterns. However, the blade angle distribution patterns along the blade streamlines are ever-changing. Different blade angle distribution patterns correspond to various blade shapes, which will inevitably affect the aerodynamic performance of the impeller. However, the influence of the blade angle distribution on the centrifugal fan impeller is currently unclear.
Therefore, in order to improve the performance of centrifugal fan impellers, the influence of different optimization strategies based on blade angle distribution rules on centrifugal fan performance is investigated by introduction of basic theory of the influence of blade angle distribution on blade shape, designing of different optimization strategy based on blade angle distribution, and comparison for numerical calculation performance of different optimization schemes corresponding to centrifugal fans. Finally, a centrifugal fan impeller with excellent efficiency, pressure rise, and power is obtained. The research achievement can provide a reference for the performance optimization of centrifugal pump fans.
Basic theory of blade angle distribution law
Basic theory of the influence of blade angle distribution on blade shape
The blade profile is formed of the spatial streamlines on each flow surface. The spatial streamline can be determined by the relationship between the streamline length s and the axial surface angle θ.

In Figure 1, the axial surface streamline micro-element segment ds is replaced and expanded by the corresponding micro-element segment dR on the cone generatrix. The fluid particle moves along the axial streamline ds, and the corresponding angle of movement on the cone surface is dψ. It is assumed that the actual length of the spatial streamline segment is dL, the circumferential projected length is du, and the corresponding axial angle on the plane is dθ.

Projection of spatial streamlines on the axis and plane.
Therefore:

Where, β is the blade angle.
Because:

Therefore


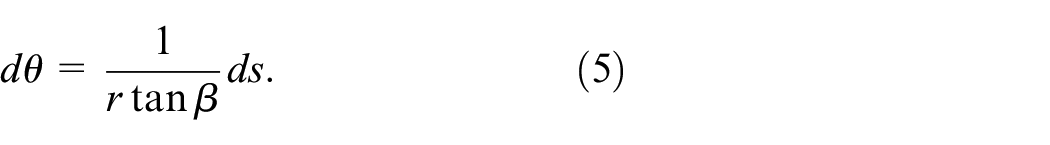
Equation (5) shows the relationship between the displacement along the axial streamline and the plane angular displacement. The spatial shape of blade can be obtained by integrating equation (5). This equation is called the blade profile differential equation.
As long as the blade inlet angle, blade outlet angle, and the changing law of the blade angle β from the inlet to the outlet are given, the streamlined shape of the blade surface can be obtained through integration. Hence, the spatial shape of the blade can be determined.
Setting method of blade angle distribution rule
Figure 2 shows the axial streamline diagram of a fluid machinery impeller. The runner blade comprises shroud streamline, hub streamline, leading edge, and trailing edge. The shroud streamlines and hub streamlines are the key streamlines for determining the shape of the blade. When both of the distribution rules of the blade angle β from the blade leading edge to the trailing edge on the shroud streamline and the hub streamlines are provided, the blade shape can be obtained by integrating the blade profile differential equation (5).

Shaft view of fluid machinery impeller.
Figure 3 is the schematic diagram of the distribution pattern of the blade angle along the blade streamline from the inlet to the outlet. In order to determine the distribution pattern, the blade inlet angle β1 and outlet angle β2 on the shroud and hub streamlines are obtained respectively according to the design requirements and parameters firstly. As long as the distribution rules between them on the shroud and hub streamlines are given, the profile streamline of the blade can be obtained from the blade profile differential equation (5). Then, the blade shape can be obtained. The notes here are as follows:
The change between the blade inlet and outlet angles must be a smooth transition to ensure the smoothness of the blade surface;
There is no specific change pattern from the blade inlet angle to outlet angle. Various type change models can be employed based on experience and existing research results. These different forms of blade angle distribution are summarized: linear, concave, convex, and different types of piecewise smooth curves. These methods are also the focus of this study, seeking a blade angle distribution law that can improve the performance of centrifugal fan impeller.

The schematic diagram for the blade angle distribution curve along the axial surface streamlines from the inlet blade angle to outlet blade angle.
Optimization method of centrifugal fan
According to the basic theory and setting method of blade angle distribution, the flow chart of centrifugal fan performance optimization is given in Figure 4. The specific processes are as follows: (1) Step 1: the different optimization schemes with different blade angle distribution rules are designed; (2) Step 2: different centrifugal fans with different shape blades are obtained; (3) Step 3: overall performances of different centrifugal fans including efficiency, pressure rise, power and internal flow field are compared; (4) Step 4: centrifugal fan with optimal overall performances is obtained finally.

The flow chart of centrifugal fan performance optimization.
Design of optimization strategy based on blade angle distribution rules
Basic parameters of the original centrifugal fan
The research object of this study is the GC85-1.2 centrifugal fan. This production is mainly used in Vannamei breeding factories. The operating parameters of the fan are: inlet air flow rate Qr = 91.8 m2/min, pressure rise ΔP = 20 kPa, and design rotating speed n = 13,000 r/min. The geometric parameters of the fan are: inlet diameter D1 = 165.8 mm, outlet diameter D2 = 200 mm, impeller diameter D = 282 mm, number of blades Z = 15, impeller trailing edge width b2 = 29 mm. Figure 5 shows the original centrifugal fan impeller.

Structural diagram of the original centrifugal fan impeller.
Design of different optimization strategies
Four optimization strategies of the blade angle distribution are proposed in order to compare the impact of different blade angle distribution patterns on the performance of centrifugal fans. Figure 6 shows the blade angle distribution curves of different optimization schemes for the four optimization strategies.

Variation blade angle rules for different schemes of different optimization strategies: (a) optimization strategy 1,(b) optimization strategy 2, (c) optimization strategy 3, and (d) optimization strategy 4.
As shown in Figure 6(a), the characteristics of the blade angle distribution of the three optimization schemes in optimization strategy 1 are as follows: Compared with the original blade, the blade angle distribution curves of the three optimization schemes are same on hub streamline and shroud streamline but different on middle streamline. Compared with the original blade, the blade angle distribution of scheme 1-1 on the middle streamline is smoother, and a straight trailing edge is obtained. The blade angle distribution of the trailing edge of scheme 1-2 is adjusted so the trailing edge is twisted. The blade angle distribution of the leading edge of scheme 1-3 has been adjusted so the leading edge is distorted.
As can be seen from Figure 6(b), the characteristics of the blade angle distribution for the five optimization schemes in optimization strategy 2 are as follows: Compared with the original blade, the blade angles on the hub streamline and shroud streamline of the five optimization schemes simultaneously changed by −4°, −2°, +1°, +2°, +3° from schemes 2-1 to 2-5 respectively.
As can be seen from Figure 6(c), the characteristics of the blade angle distribution for the seven optimization schemes in optimization strategy 3 are as follows: Compared with the original blade, the blade angle distribution on the first half part or the latter half of the hub and shroud streamlines for the seven optimization schemes gradually changes. The change values are shown in Table 1.
The blade angle change values of each optimization scheme relative to the original fan in optimization strategy 3.

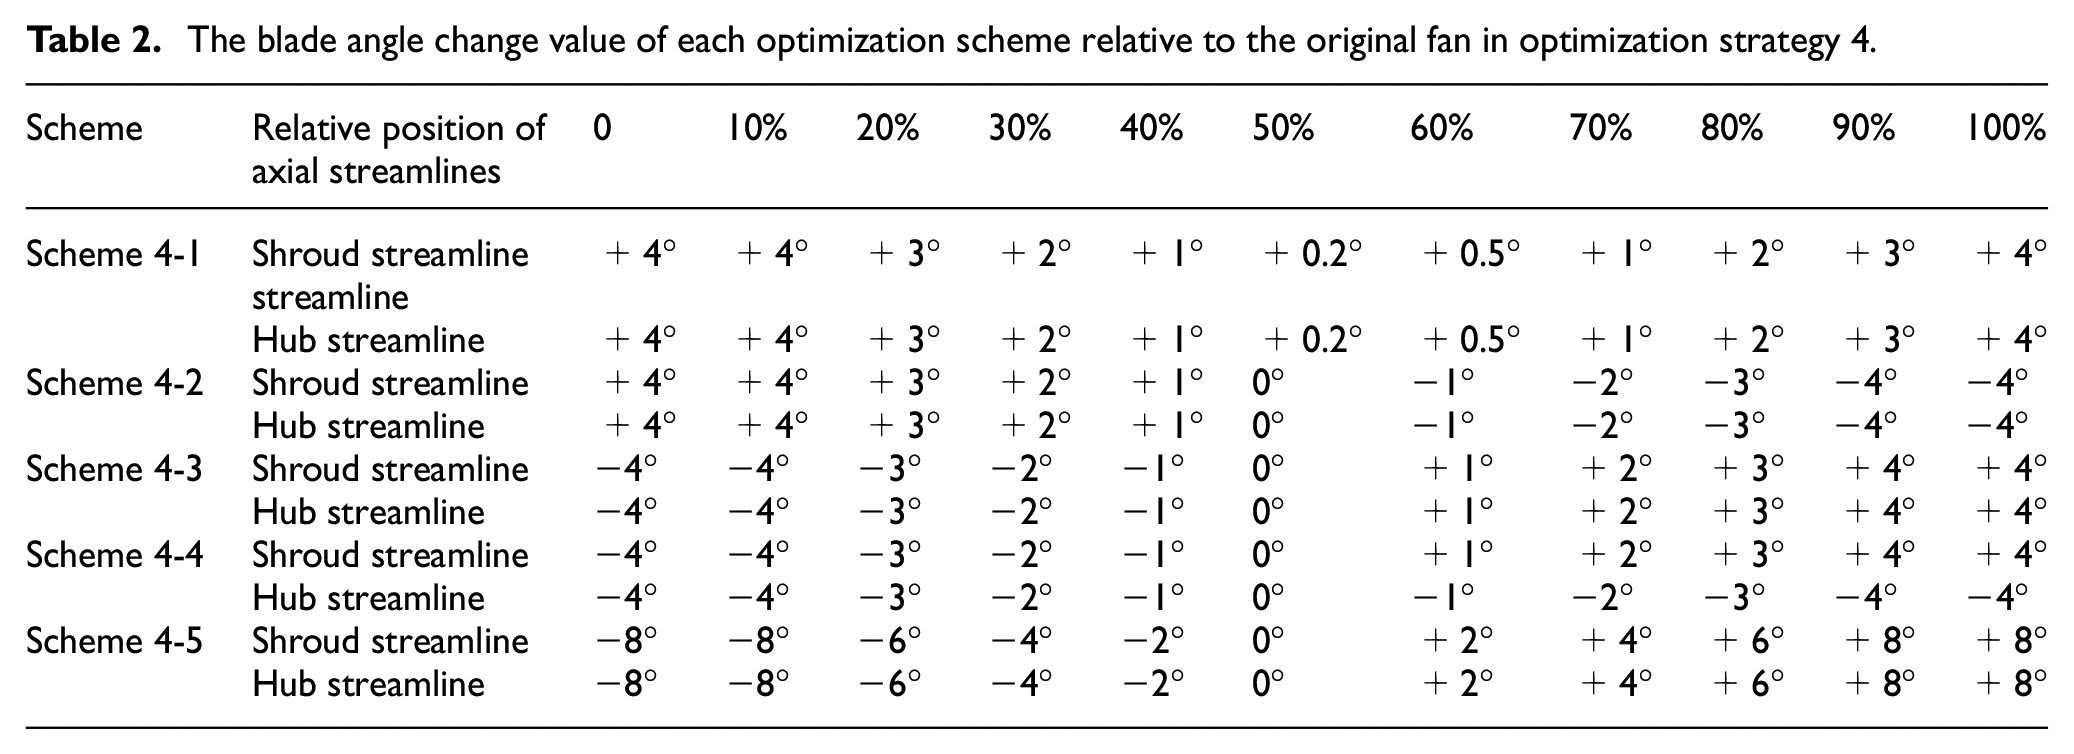
As shown in Figure 6(d), the characteristics of the blade angle distribution for the five optimization schemes in optimization strategy 4 are as follows: Compared with the original blade, the blade angle distribution both on the first half part and the latter half part of the hub and the shroud streamline for the five optimization schemes gradually change. The change values are shown in Table 2.
The blade angle change value of each optimization scheme relative to the original fan in optimization strategy 4.
Blade designing results
Different blades are obtained based on the blade angle distribution rules of different optimization schemes in the four optimization strategies. Figure 7 shows the blade shapes obtained by each optimization scheme in different optimization strategies. The leading and trailing edges of the blades obtained by scheme 1-1 of optimization strategy 1 are straight, the trailing edge obtained by scheme 1-2 is twisted, and the leading edge obtained by scheme 1-3 is also twisted. The blade leading and trailing edges obtained by each optimization scheme in optimization strategies 2, 3, and 4 are straight while the blade shape and wrap angle are different. Table 3 compares blade wrap angles of each optimization scheme in different optimization strategies.

Comparison of blade shapes designed with different strategies: (a) optimization strategy 1, (b) optimization strategy 2, (c) optimization strategy 3, and (d) optimization strategy 4.
Comparison of blade wrap angles obtained by different optimization schemes in different optimization strategies.

Calculation method
The commercial software ANSYS CFX is used in this study to perform numerical calculations on the centrifugal fan. The calculation domain includes the inlet part, impeller, and volute. The computational domain mesh must be created, and boundary conditions must be set to improve the computational efficiency and accuracy of the numerical simulation.
Meshing
The unstructured grid is selected because this kind grid is more suitable for complex geometry. The calculation domain and grid of the centrifugal fan are shown in Figure 8.

Centrifugal fan calculation grid.
In order to take into account both calculation accuracy and calculation time, it is necessary to carry out grid independence checks on the calculation grid to determine the final number of grids. The results of the grid independence check are shown in Figure 9, which shows the pressure difference between the inlet and outlet of the centrifugal fan for six types of grids. The total grids of the six grid schemes are 400,000, 800,000, 1.8, 2.51, 4, and 5.8 million respectively. Grid independence check revealed that when the number of grids is greater than 2 million, the calculated pressure difference of the centrifugal fan no longer fluctuates and becomes stable. Therefore, the total number of grids used in the numerical calculation is finally 2.51 million, 270,000 for inlet part, 780,000 for the impeller, and 1.46 million for the volute respectively.

Grid independence check.
Grid quality indexes as follows: y+ is 50–300, meeting the wall function requirements; the aspect ratio of the grid in the core area of the flow field is less than 20 while the aspect ratio of the grid in the near wall area is less than 40, which basically meets the grid requirements; grid skewness is less than 0.9, grid skewness is normal. The overall mesh quality of the centrifugal fan is greater than 0.1, it is difficult to get higher mesh quality because of the complex fan structure, but it basically meets the engineering application requirements.
Boundary condition settings
The RNG k-ε turbulence model is applied, because this model can better handle flows with high strain rates and large streamline curvatures. 25 The fluid is an ideal gas. The computational domain inlet is set as constant flow rate and temperature. The inlet flow rate for the rated working conditions is 1.83 kg/s, and the inlet total temperature is 298 K. The impeller is set as a rotating part, the speed is 13,000 r/min, and the outlet is a pressure outlet. The impeller outlet and volute inlet are set to dynamic and static handover. The frozen rotor method is used. The roughness of the wall surface for the flow component is not considered since it is a smooth adiabatic wall surface. There is no energy exchange. The near-wall area is solved using a non-slip wall surface and the standard wall surface function.
Results and discussion
In this study, seven flow rate conditions are selected to conduct steady calculation of the centrifugal fan as follows: 74, 84.5, 91.8, 100.9, 108.5, 115.5, and 121.8 m3/min. The rated flow rate is Qr = 91.8 m3/min. Compared with the original fan, the centrifugal fans of different optimization schemes own the same volute but different impellers.
Calculation method of external characteristics
(1) The efficiency is calculated using multivariable efficiency as follows:
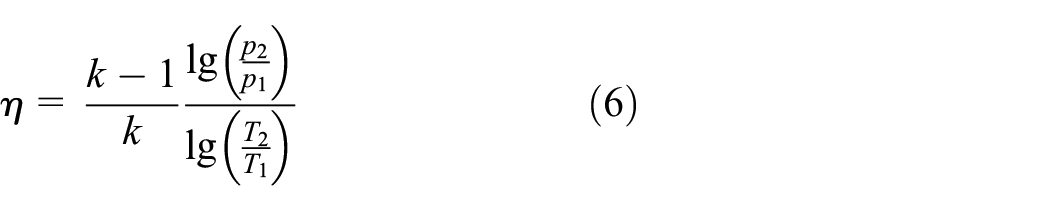
Where, η is the efficiency; k is the specific heat ratio; p2 and p1 are the fan inlet and outlet pressures respectively; T2 and T1 are the fan inlet and outlet temperatures respectively.
(2) The calculation formula of power is as follows:

Where, M is the shaft torque; ω is the rotation angular speed; n is the rotation speed and N is the power.
(3) The pressure rise is the total pressure difference between the inlet and outlet. The calculation formula is as follows:

Where, △p is the pressure rise; Ptotal-out is the outlet total pressure of centrifugal fan; Ptotal-in is the inlet total pressure of centrifugal fan.
Verification of external characteristics and determination of preliminary schemes for each optimization strategy
(1) External characteristic experiment and validation
Figure 10 shows the diagram of the fan’s test field. The test of the centrifugal fan is carried out on a test platform with cast iron and cement. The levelness reaches an accuracy of 0.03 mm within 1 m. A standard mercury column is used for pressure measurement. An orifice plate is used to measure the flow rate. Mercury thermometer is used for temperature measurement. The frequency converter is used to measure current and voltage. The efficiency, power, and pressure rise of the original fan and the final optimized fan are obtained under various flow rate conditions through experiments.

Diagram of the centrifugal fan experiment device.
Figure 11 compares the centrifugal fan external characteristic curves obtained by each optimization scheme of the four optimization strategies. Figure 11(a) shows the comparison of test values and calculated values for the original fan external characteristic curve. The calculated values of the efficiency, power, and pressure rise curve of the original fan are consistent with the distribution trend of the experimental values. The calculated and experimental values in the flow rate range of 80–110 m3/min are relatively consistent. The minimum calculation error of efficiency within this flow range is 0.9%, and the maximum error is 10%. The minimum calculation error of power is 2.4%, and the maximum error is 7.2%. The minimum calculation error of pressure rise is 0.3%, and the maximum error is 7.4%. The calculation error is within the acceptable range. A large error exists between the calculated and experimental values under the large flow conditions. This error may be because as the flow rate increases, the gas compression increases, and the friction and heat exchange with the wall increase, but the numerical calculation ignores these factors. Therefore, the calculation models in this study are reasonable and reliable. The calculation results can be used for further discussion and analysis. Next, the calculation results in the 80–110 m3/min flow rate range are analyzed.
(2) Determination of preliminary schemes in each optimization strategy
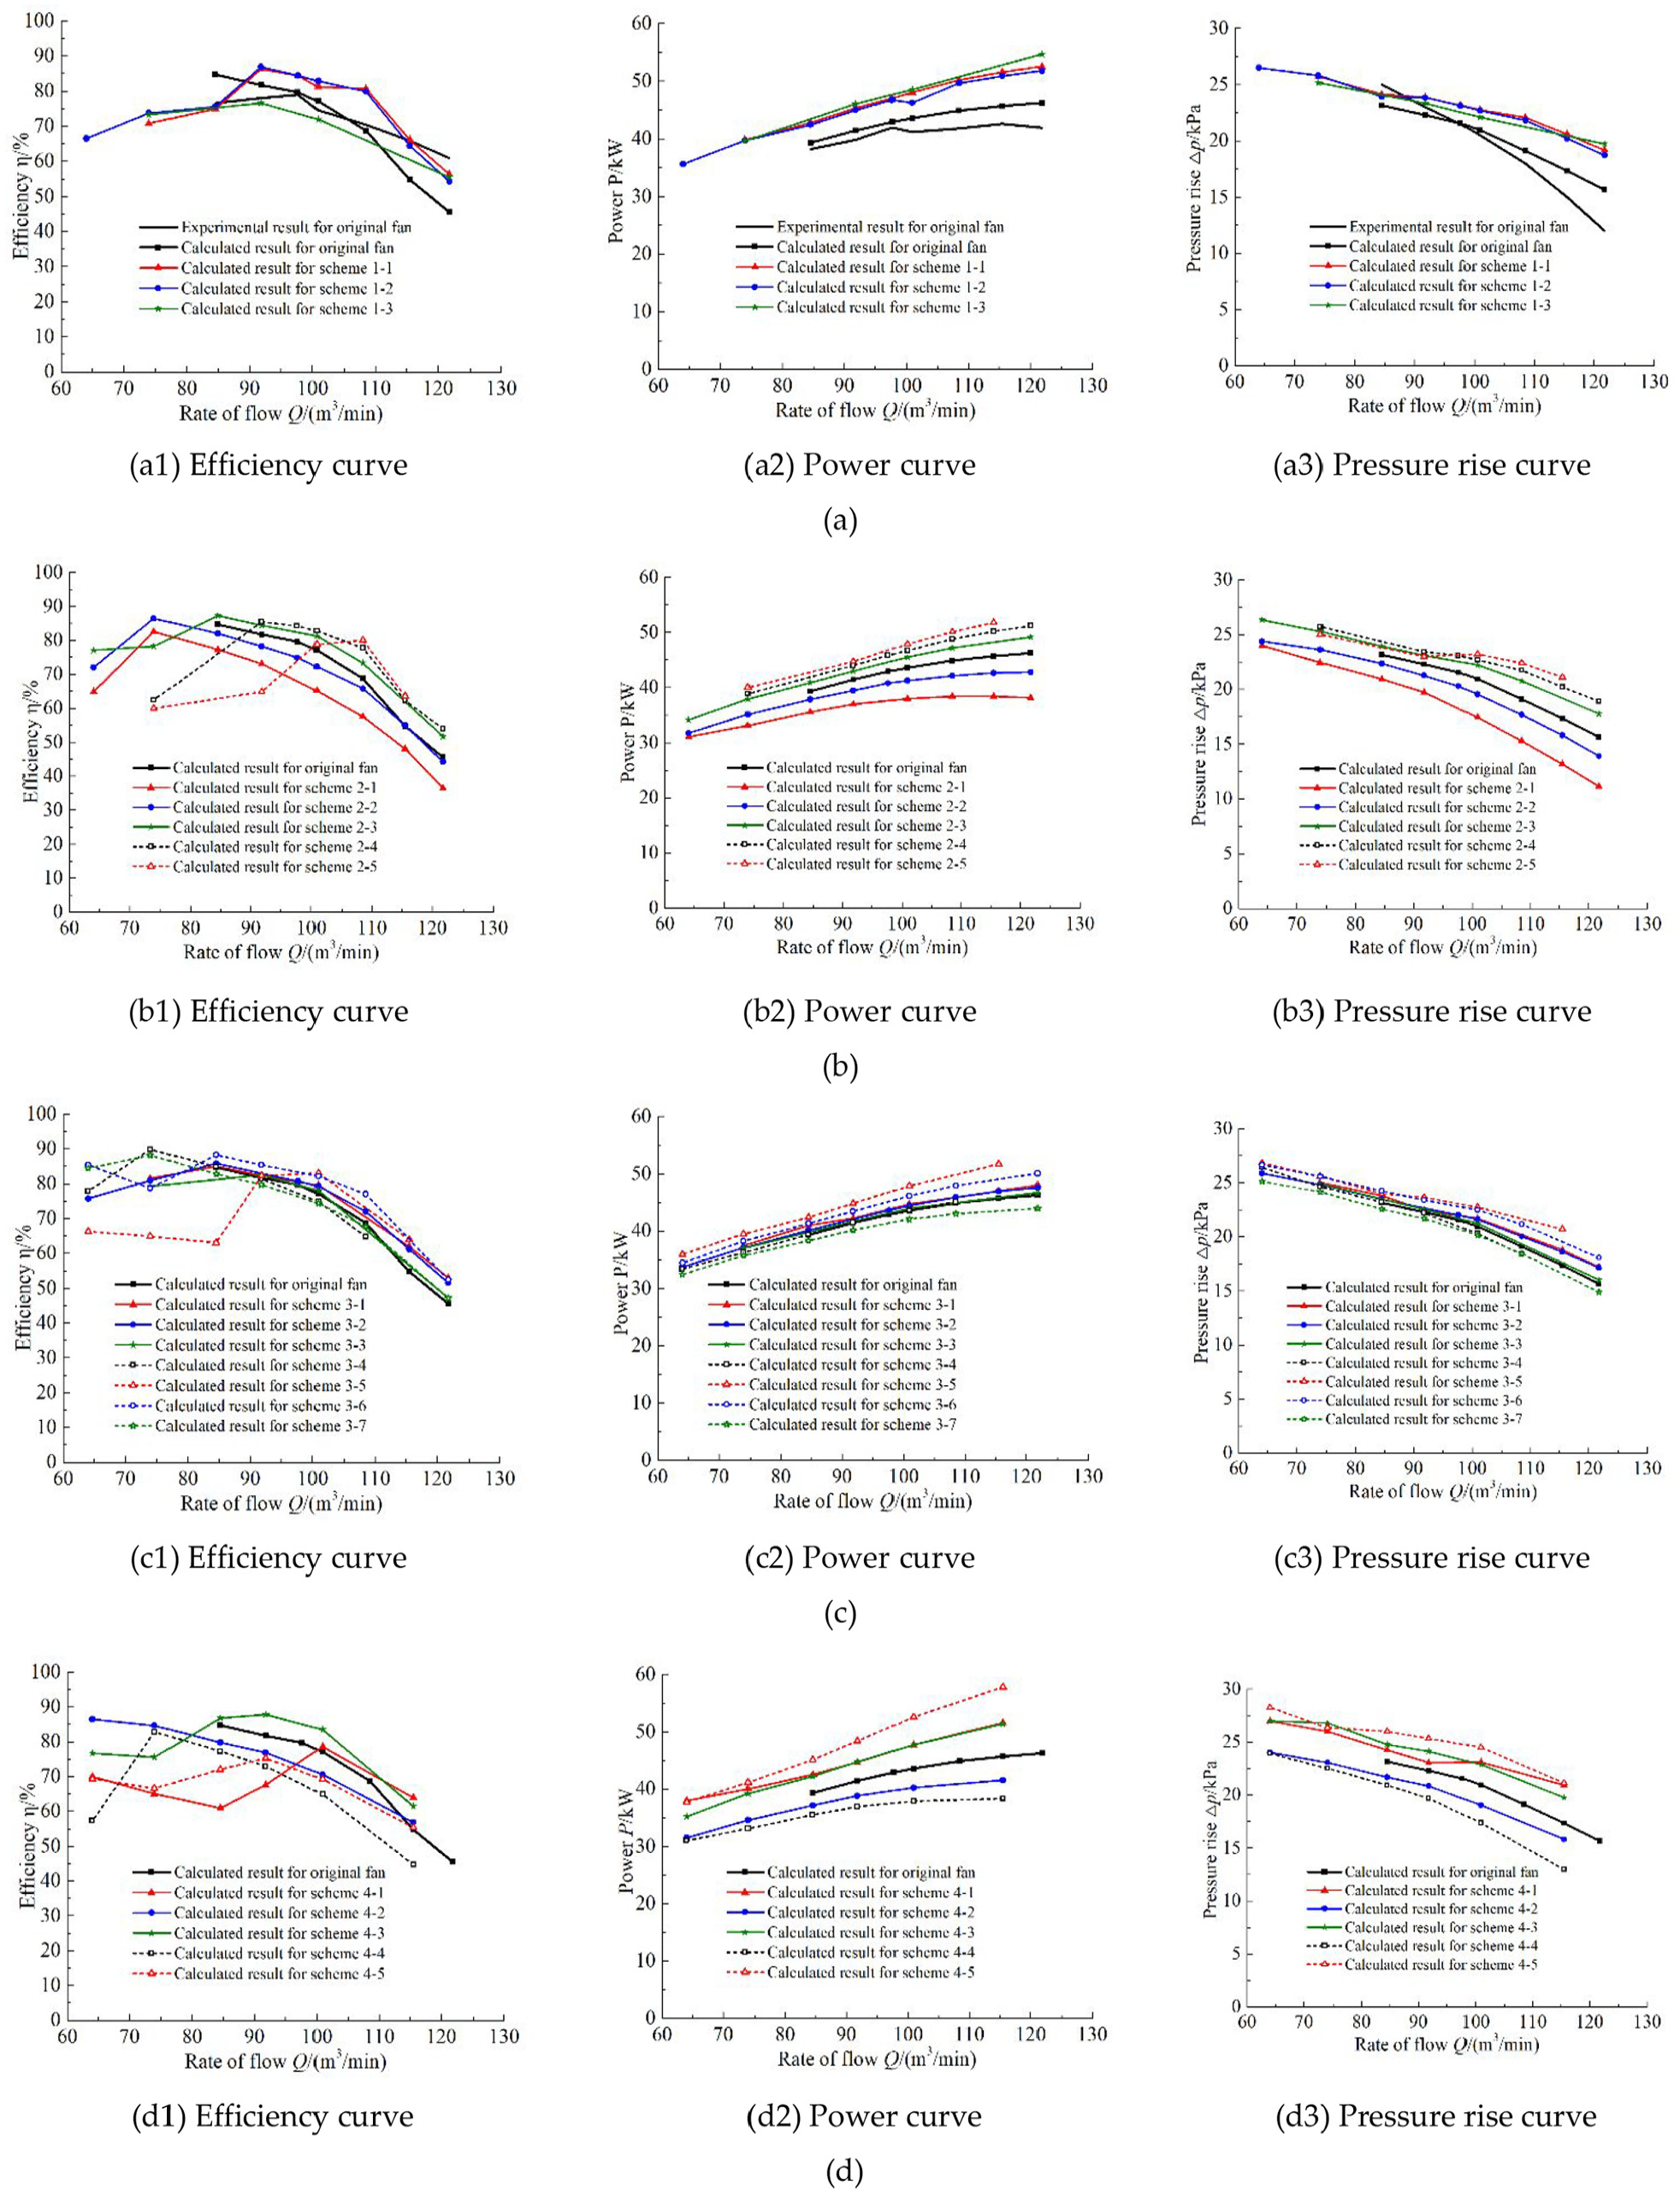
Comparison of the external characteristic curves of centrifugal fans obtained by each optimization scheme of different optimization strategies: (a) optimization strategy 1, (b) optimization strategy 2, (c) optimization strategy 3, and (d) optimization strategy 4.
Figure 11(a) shows that the fan efficiency and pressure rise are significantly improved by scheme 1–1 and scheme 1-2 in optimization strategy 1. Compared with the original fan, in the flow rate range of 90–110 m3/min, the efficiency is increased by approximately 6%, and the pressure rise is increased by approximately 8%. The efficiency and pressure rise curves of the two schemes are very similar. However, the power obtained by the optimization scheme 1–2 is slightly lower than scheme 1–1. Therefore, schemes 1–2 are the preliminary schemes among the various schemes of optimization strategy 1.
Figure 11(b) shows that the fan efficiency and pressure rise obtained by scheme 2–1 and scheme 2–2 in optimization strategy 2 are lower than the original fan, while the efficiency and pressure rise of scheme 2–3, scheme 2–4 and scheme 2–5 are higher than that of the original fan. Although the efficiency of schemes 2–4 and 2–5 are locally higher than schemes 2–3, the high-efficiency area of schemes 2–4 and 2–5 is too narrow. Scheme 2–3 has higher efficiency under various flow rate conditions, with an average increase of about 4% compared to the original fan efficiency. The power of scheme 2–3 is lower than that of schemes 2–4 and 2–5. Therefore, scheme 2–3 is the preliminary scheme among the various optimization schemes of strategy 2.
Figure 11(c) shows that the efficiency of scheme 3-6 in optimization strategy 3 is better than other schemes and the original fan under all working conditions. Scheme 3–6 increases the average efficiency by 5.5% compared with the original fan. The pressure rise of scheme 3–6 is also higher than the original fan. The power of scheme 3–6 is slightly higher than other schemes but lower than scheme 3–5. Therefore, scheme 3-6 is the preliminary scheme among various optimization schemes of optimization strategy 3.
According to Figure 11(d), the fan efficiency obtained by scheme 4–3 of optimization strategy 4 is significantly higher than other schemes and the original fan. Compared with the original fan efficiency, the average efficiency of scheme 4–3 is increased by 5.5%, and the pressure rise is increased by approximately 7.8%. The power of scheme 4–3 is increased but lower than that of scheme 4–5. Therefore, scheme 4–3 is the preliminary scheme among the various optimization schemes of strategy 4.
According to the comparative analysis of the external characteristics for each scheme of the four optimization strategies, the best schemes with the best performances compared to the original fan in each optimization strategy are scheme 1–2 of optimization strategy 1, scheme 2–3 of optimization strategy 2, scheme 3–6 of optimization strategy 3, and scheme 4–3 of optimization strategy 4 respectively as the preliminary schemes.
Comparison of external characteristics for preliminary scheme of each optimization strategy
The preliminary schemes of each optimization strategy are compared and analyzed to obtain the optimal scheme. Figure 12 compares the external characteristic curves of the preliminary schemes. Figure 12(a) shows that the efficiency of the four preliminary schemes has improved compared with the original fan. Scheme 1–2 has the best efficiency in the flow rate range of 90–120 m3/min, while scheme 4–3 has the best efficiency in the flow range of 80–100 m3/min. Compared with the original fan, the efficiency of the two schemes has improved by more than 5%. The pressure rises of the four preliminary schemes are the same and are improved compared with the original fan. The powers of schemes 1–2 and 4–3 are slightly higher than other schemes and the original fan. In general, schemes 1–2 and 4–3 have better overall performance. The flow field characteristics in the impeller of the four preliminary schemes are further analyzed below.
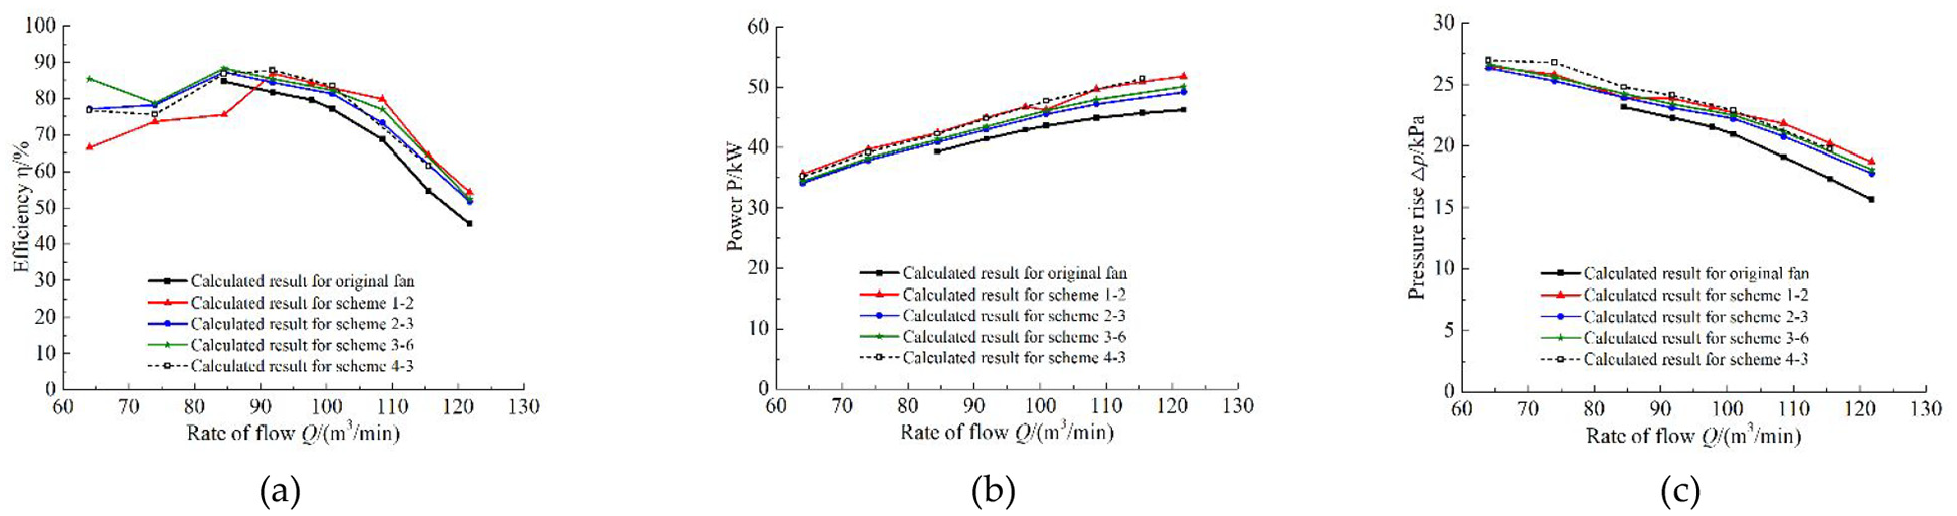
Comparison of external characteristics of each optimization strategy preliminary scheme: (a) Efficiency curve, (b) Power curve, and (c) Pressure rise curve.
Analysis of the internal flow field of four preliminary schemes
The rated flow rate of the centrifugal fan is Qr = 91.8 m2/min. The internal flow field characteristics in the impeller of the four primary schemes are analyzed. The results are compared with the impeller of the original fan under three flow rate conditions of 84.5, 91.8, and 100.9 m3/min.
(1) Blade pressure distribution
Figure 13 shows the blade surface pressure distribution of the original fan and four preliminary schemes under three flow rate conditions. Under the three flow conditions, the pressure distributions on the blade’s suction surface and pressure surface are similar. The pressure distributions from the inlet to the outlet for the original fan and the four optimization schemes gradually increase. The pressure distribution on the suction surface is more uniform than the pressure surface. The pressure distribution on the suction surface is uneven, the pressure gradient is increasing. The inlet and outlet pressure differences of schemes 3–6 and 4–3 are smaller than those of schemes 1–2 and 2–3, which is also why their pressure rises differ. Schemes 1–2 and 2–3 have a large pressure gradient in the inlet of the blade surface. The pressure gradient is large, the pressure distribution is uneven, and there is sudden change and an obvious low-pressure area especially in the area close to the shroud on the pressure surface. This may be due to secondary flows or vortices in the flow field. Compared to schemes 1–2 and 2–3, the pressure distribution of schemes 3–6 and 4–3 are more uniform, the pressure gradient is small, and the pressure field is better. In summary, the pressure field distributions on scheme 3-6 and scheme 4–3 are better.
(2) Pressure distribution on the shroud streamline of the blade surface

Blade surface pressure distribution of different schemes under various flow rate conditions: (a) Q = 84.5 m3/min,(b) Q = 91.8 m3/min, and (c) Q = 100.9 m3/min.
Since the area with a larger pressure gradient on the blade surface of different schemes is located at the blade inlet near the shroud, the pressure distribution on the blade surface is similar under different flow rate conditions. Therefore, the pressure distribution on the shroud streamline of the blade surface under the rated flow condition Qr = 91.8 m3/min is further analyzed below.
Figure 14 shows the pressure distribution on the shroud streamlines of the blade surface under the rated flow conditions. In the figure, the shroud streamline is the intersection line between the shroud and the blade. The abscissa in the figure is the relative position of the streamlines, representing the length of the blade surface streamlines from the leading edge to the trailing edge. Here, 0 represents the position of the blade leading edge, and 1 represents the position of the blade trailing edge.

Pressure distribution on the blade shroud streamlines for different schemes under rated flow conditions: (a) Original fan, (b) Scheme 1–2, (c) Scheme 2–3, (d) Scheme 3–6, and (e) Scheme 4–3.
Figure 14 shows that the pressure difference between the suction and pressure surfaces of schemes 1–2 and 2–3 are significantly higher than schemes 3–6 and 4–3. The pressure distribution on the suction surface of schemes 1–2 and 2–3 changes greatly, especially in the inlet section. The pressure distribution at the leading edge of the original fan blade (l = 0) drastically changes while the pressure changing of the blade leading edge for the four optimization schemes are all relatively gentle, so the four optimization schemes significantly improve the performance of the blade inlet side to reduce vortices and secondary flows. For schemes 1–2 and scheme 2–3, the pressure distribution at the inlet side changes drastically. At the same time, the overall pressure distribution of schemes 3–6 and 4–3 is more uniform, the pressure change at the inlet side is gentler, the secondary flow vortices decrease, and the pressure field is improved.
(3) Pressure distribution in the flow channel between impeller blades
Since the area with a larger pressure gradient on the blade surface of different schemes is located in the blade inlet section near the shroud, the pressure distributions between the blades on the impeller shroud under different flow rate conditions are further analyzed below.
Figure 15 shows the pressure distribution between the blades on the impeller shroud surface under various flow rate conditions. Under different flow rates, the pressure distribution between blades is similar. A low-pressure area at the blade inlet results in a turbulent flow field and secondary flow to reduce the impeller performance. As the flow rate increases, the number of low-pressure areas between the blades increases, and the area of low-pressure area enlarges. That indicates that the impeller inlet flow field becomes more turbulent under large flow conditions. Under each flow rate condition, compared with other optimization schemes and the original fan, schemes 1–2 and 4–3 have fewer inlet low-pressure areas and smaller areas. Therefore, schemes 1–2 and 4–3 have better performance under various flow rate conditions to improve the performance of the original fan inlet area.
(4) Streamline distribution of flow channels between impeller blades

Pressure distribution on the impeller shroud surface under different flow rate conditions: (a) Q = 84.5 m3/min,(b) Q = 91.8 m3/min, and (c) Q = 100.9 m3/min.
Figure 16 shows the streamline distribution between blades on the impeller shroud surface under various flow rate conditions. As the flow rate increases, the overall flow field between the blades becomes smoother, indicating that the overall flow field is better under large flow conditions. Under various flow conditions, compared with the original fan and other optimization schemes, the streamline distribution between blades of schemes 1–2 and 4–3 are more uniform. The vortices and secondary flows between schemes 1–2 and 4–3 blades are significantly reduced. Therefore, schemes 1–2 and 4–3 have better performance under various flow rate conditions to improve the performance of the original fan.
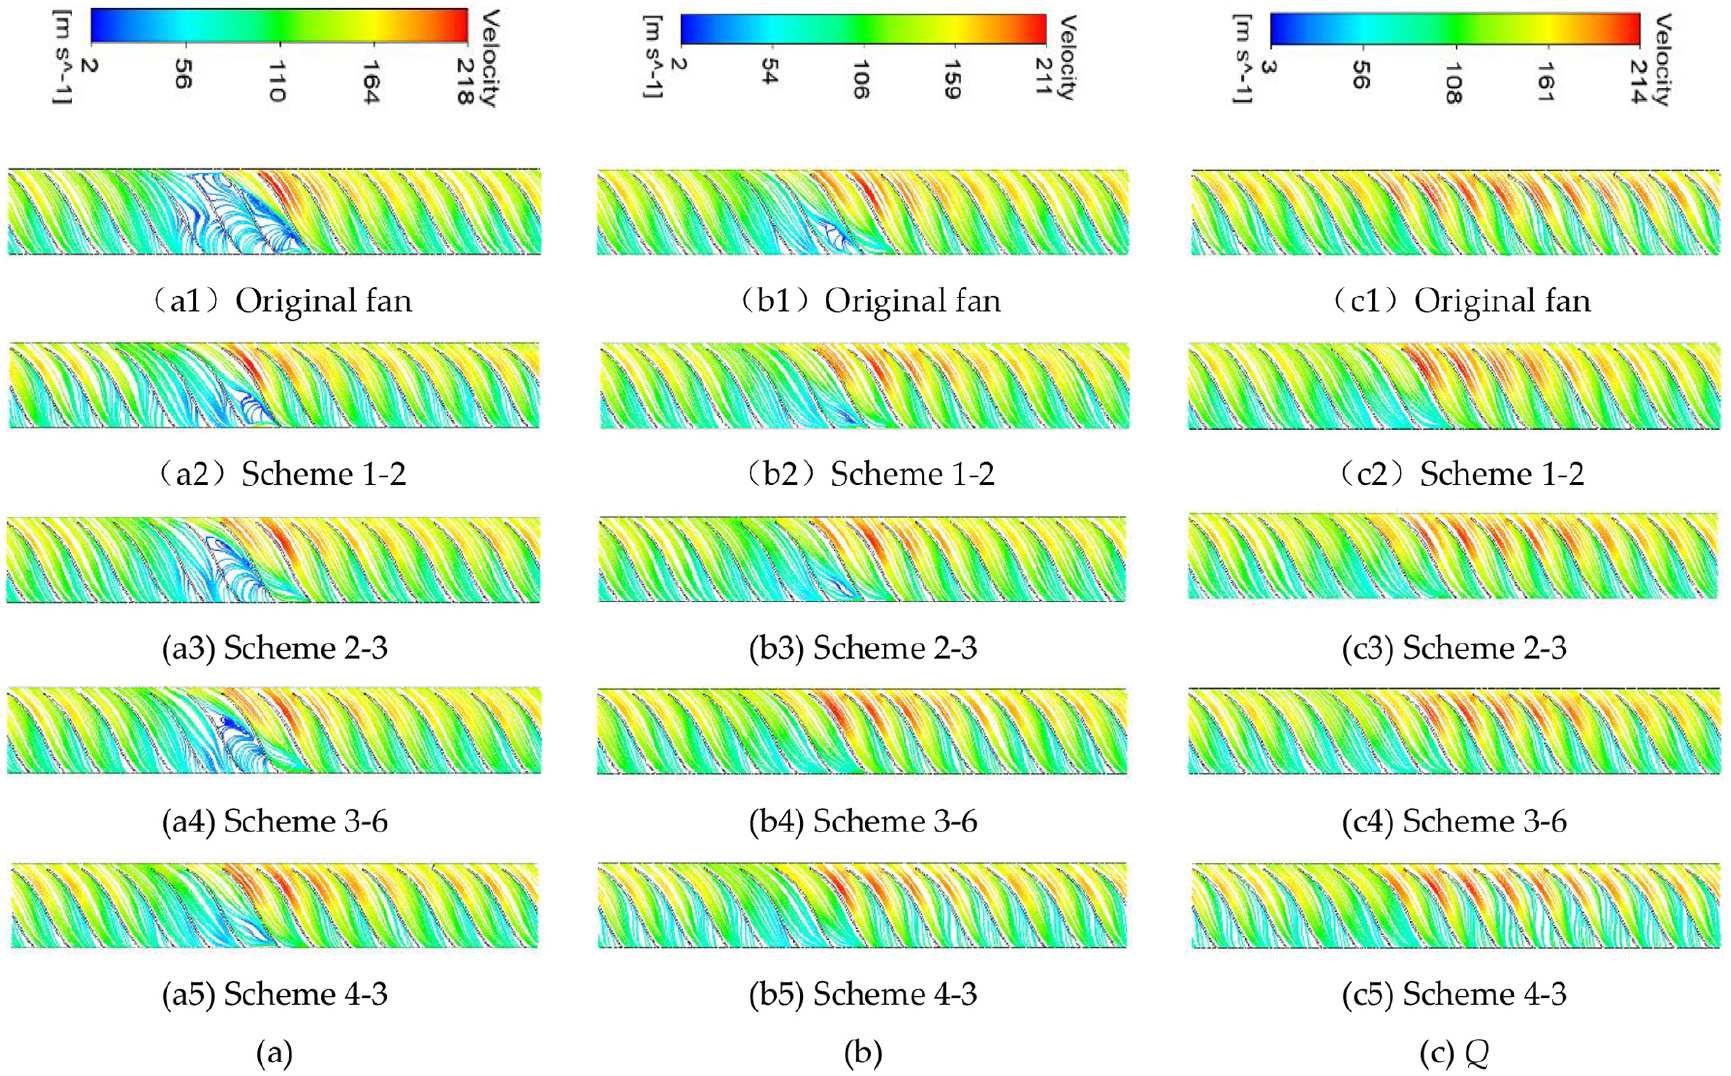
Streamlines between blades on the impeller shroud under different flow rate conditions: (a) Q = 84.5 m3/min,(b) Q = 91.8 m3/min, and (c) Q = 100.9 m3/min.
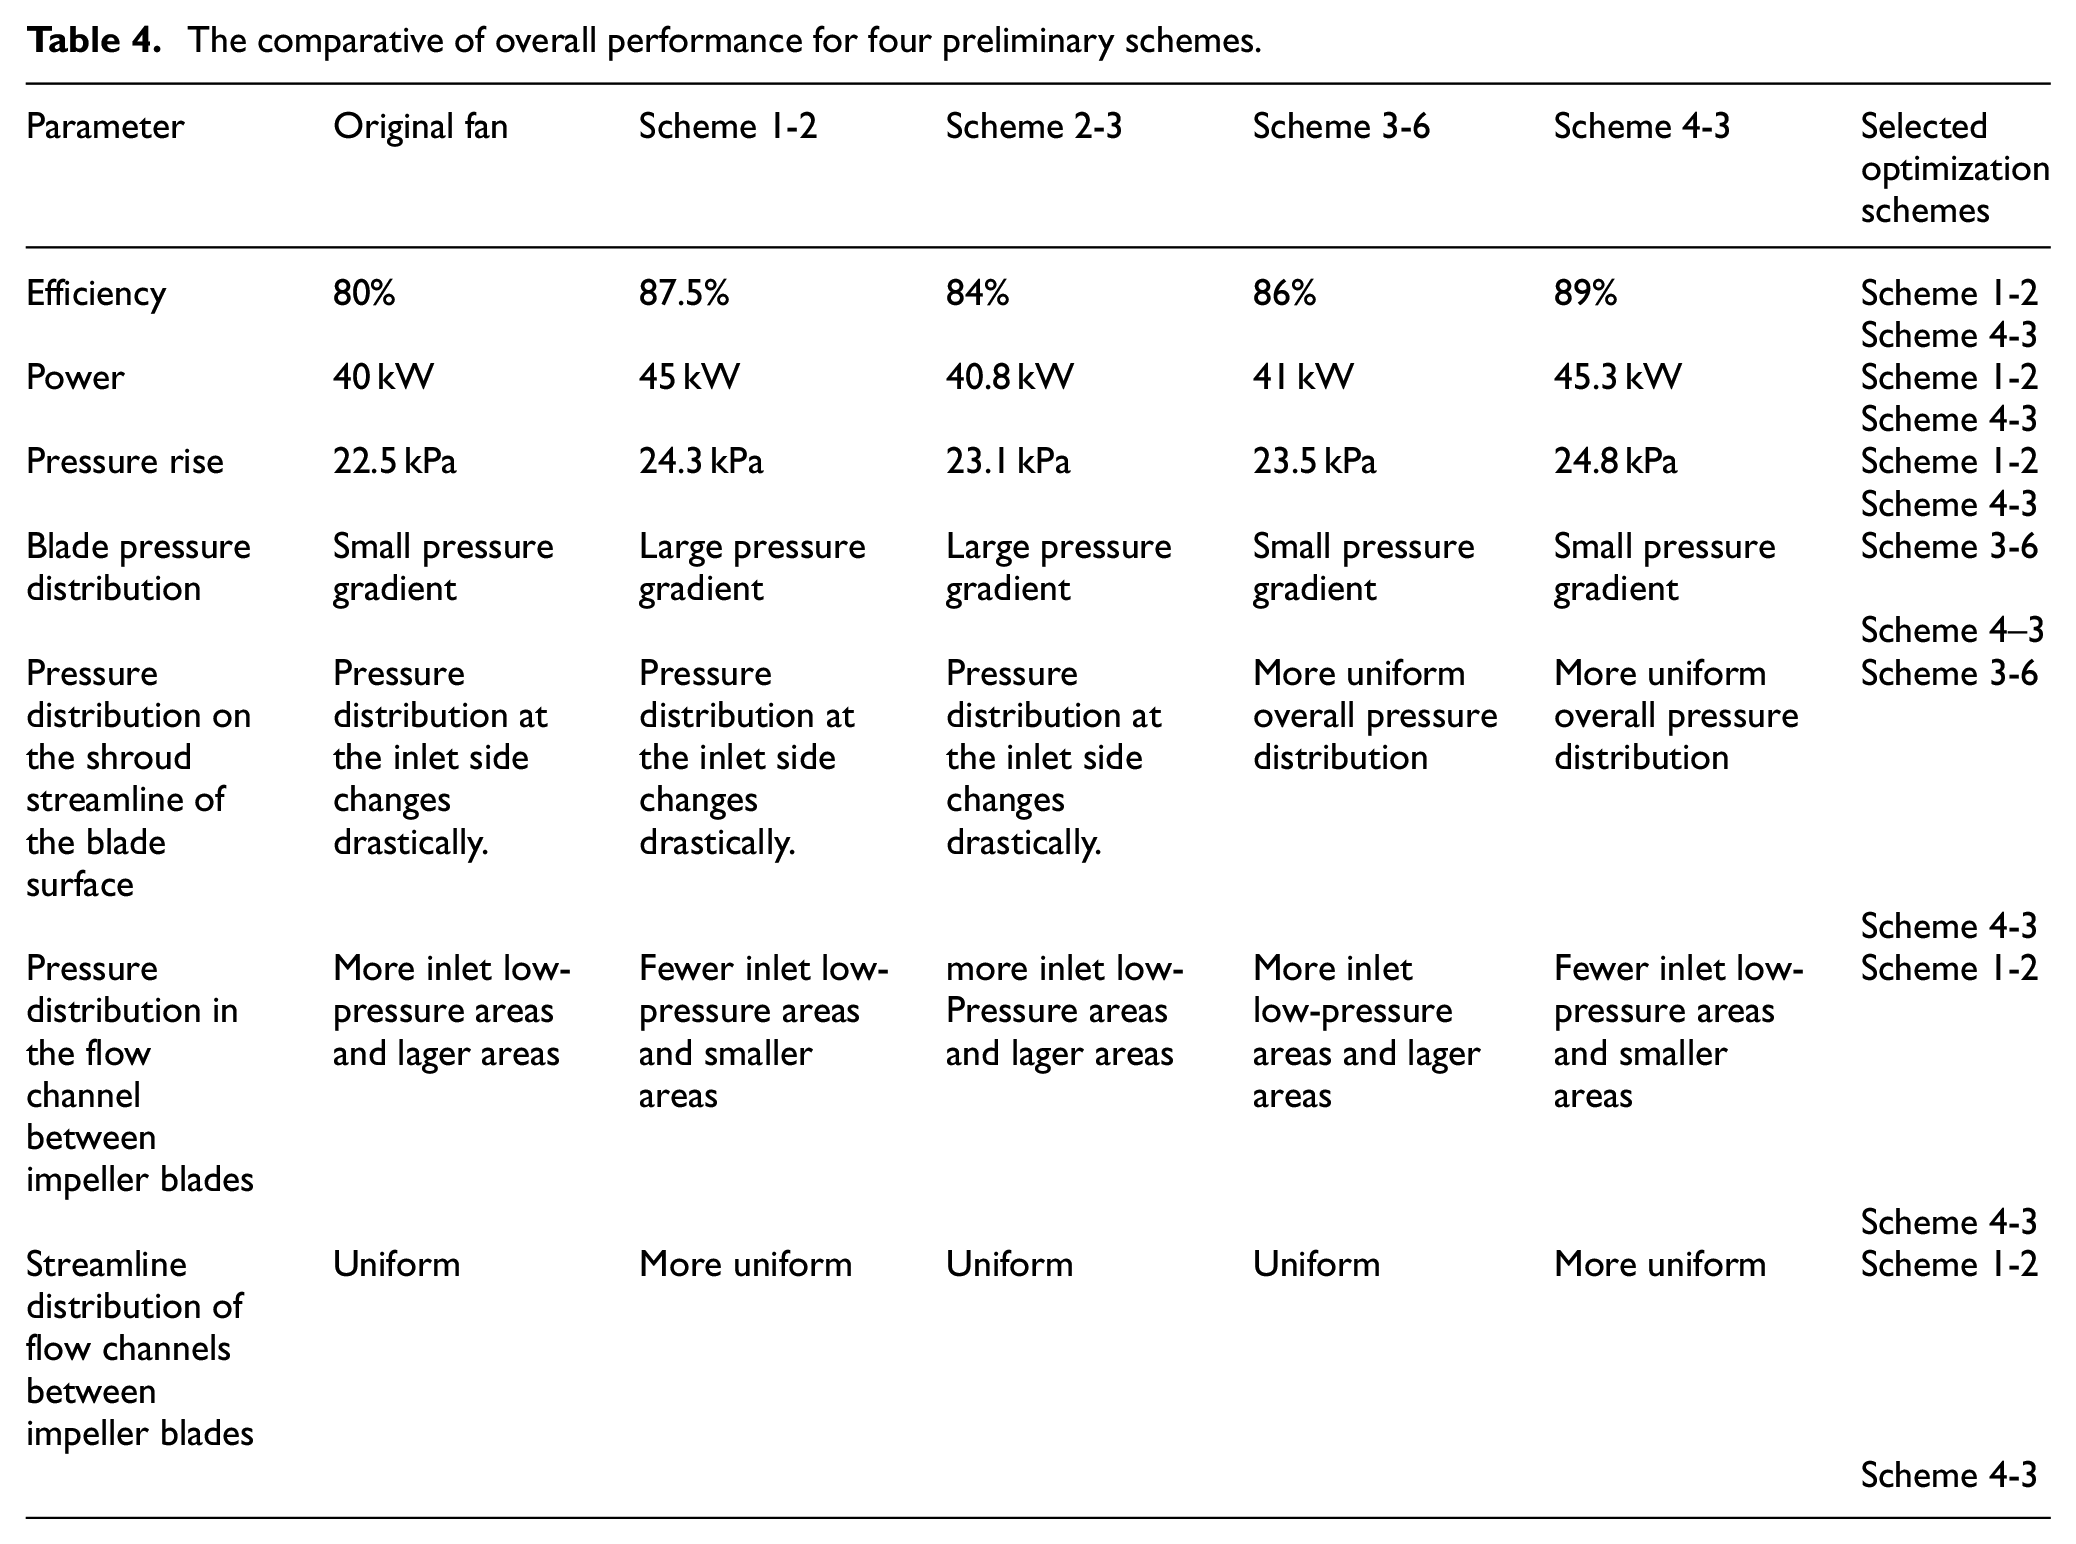
In summary, based on a comparative analysis of the external characteristics, blade pressure distribution on the blade surface and shroud streamline, pressure distribution and streamline distribution in the flow channel between impeller blades, shown in Table 4. Schemes 1–2 and 4–3 have smaller blade surface pressure gradients, fewer and smaller inlet low-pressure areas, smoother flow fields between blades, better performance to improve the efficiency of the original fan. Moreover, schemes 1–2 and 4–3 can meet the fan pressure rise requirements. Therefore, schemes 1–2 and 4–3 are finally selected.
The comparative of overall performance for four preliminary schemes.
Experimental verification of selected schemes
In order to verify the performance of the selected schemes, two impellers of schemes 1–2 and 4–3 are produced. Then, their external characteristics, such as efficiency, power, and pressure rise, are tested on the experiment bench under various flow rate conditions. Their experimental results are compared with the external characteristic test results of the original fan impeller. Figure 17 shows the actual impellers of the selected scheme 1–2, scheme 4–3, and the original fan.

The actual impellers of selected schemes and original fan: (a) Original fan, (b) Scheme 1–2, and (c) Scheme 4–3.
Figure 18 compares the external characteristic test values of the selected schemes and the original fan. Figure 18(a) shows that compared with the original fan, the efficiencies of schemes 1–2 and 4–3 are increased by 5%–10% under various flow rate conditions. Under small flow conditions (Q < 80 m3/min), the efficiency of scheme 4–3 is higher than scheme 1–2; under large flow conditions (Q > 80 m3/min), the efficiency of scheme 1–2 is slightly higher than scheme 4–3. The optimal efficiency of scheme 1–2 is higher than that of scheme 4–3. Therefore, scheme 4–3 has a wider high-efficiency area and better overall efficiency. It can be seen from Figure 18(b) that the power of scheme 4–3 is almost the same as the power of the original fan but lower than that of scheme 1–2. Therefore, the fan power of scheme 4-3 is optimal. It can be seen from Figure 18(c) that the pressure rise of scheme 4–3 is lower than scheme 1–2 and the original fan, but it can meet the requirements for pressure rise of the fan. In summary, scheme 4–3 is the optimal fan optimization scheme because it can meet the design requirements and owns the optimal fan performance compared with scheme 1–2.

Comparison of the external characteristics test values of the selected schemes and the original fan: (a) efficiency curve, (b) power curve and (c) pressure rise curve.
Conclusions
The four different optimization strategies of blade angle distribution law along the streamline on the shroud and hub are designed in order to improve the performance of the original centrifugal fan impeller. Different blade angle distribution patterns of four optimization strategies lead to different blade shapes of every scheme, so they own different performances. According to the comparative analysis of the external characteristics of each scheme in the four optimization strategies, the scheme with the best performance compared to the original fan in each optimization strategy selected as preliminary schemes are as follows: scheme 1–2 of optimization strategy 1, scheme 2–3 of optimization strategy 2, scheme 3–6 of optimization strategy 3, and scheme 4–3 of optimization strategy 4.
For four preliminary schemes, the efficiency improvement of schemes 1-2 and 4-3 is more than 5% compared to the original fan. Their powers are also slightly higher than other schemes and the original fan. Schemes 3–6 and 4–3 have a more uniform blade surface pressure distribution, a small pressure gradient, a gentle pressure change at the inlet side, fewer secondary flow vortices, and a better pressure field. Schemes 1–2 and 4–3 reduce the number and area of blade inlet low-pressure zones between blades to make the flow field more uniform, so the vortices between blades and secondary flows are reduced under various flow rate conditions. Therefore, schemes 1-2 and 4–3 are better performance schemes.
For the two better performance scheme 1–2 and 4–3, both of their efficiencies are 5%–10% higher than the original fan by experimental test. Scheme 4–3 has a wider high-efficiency area, better overall efficiency and lower power than scheme 1–2, meanwhile scheme 4–3 can meet the pressure rise requirements of the fan. Finally, scheme 4–3 can improve the performance of original fan significantly, so it is the optimization scheme of blade angle distribution for the centrifugal fan.
Footnotes
Acknowledgements
The authors are thankful to the department of School of Mechanical and Electrical Engineering, China University of Mining and Technology and Shandong Zhangqiu Blower Co., Ltd. We would also like to thank the supporting of the National Natural Science Foundation of China
Handling Editor: Sharmili Pandian
Funding
The author(s) disclosed receipt of the following financial support for the research, authorship, and/or publication of this article: This work was supported by the National Natural Science Foundation of China (Grant No. 51909094).
Declaration of conflicting interests
The author(s) declared no potential conflicts of interest with respect to the research, authorship, and/or publication of this article.
Data availability statement
The datasets generated and/or analyzed during the current study are available from the corresponding author on reasonable request.