
Abstract
Despite extensive research and process advancements, parasitic mechanisms such as chatter, excessive tool wear, and energy dissipation continue to undermine the efficiency and sustainability of machining processes. These mechanisms, coupled with increased cutting forces and diminished surface quality, present persistent challenges. This study focuses on the cutting tool nose radius – a critical geometric parameter – as a lever to mitigate these issues. Through a systematic series of experiments on the machining of Al 6061-T6, the influence of tool nose radius on key machining parameters, including cutting forces, specific energy, chatter stability, tool wear, and surface finish, was investigated. Qualitative and quantitative analyses revealed that larger nose radii improve surface finish and reduce tool wear by distributing cutting forces more effectively, while smaller radii enhance chatter stability and reduce specific energy and chip load. However, the trade-offs between these parameters underscore the complex interplay of geometric and process variables. The findings provide a nuanced understanding of the role of nose radius in machining, identifying trends that align with theoretical principles of cutting mechanics and stability. An optimal nose radius was identified that balances improved cutting performance with compromises in wear and surface quality, paving the way for frugal, low-cost solutions to enhance machining efficiency and sustainability. This work not only advances the theoretical framework of cutting mechanics but also offers practical insights for developing sustainable manufacturing processes through informed tool design and selection.
Introduction
Metal cutting processes have been extensively studied ever since their inception from plasticity theories by Merchant1,2 and Shaw. 3 Various aspects of metal cutting mechanics, including cutting tool geometry, the chip formation process, and the characterization of cutting forces, have undergone significant standardization.4–6 The non-cutting energy dissipated in the tertiary deformation zone in metal cutting (Figure 1) is a characteristic feature of the cutting process that does not contribute to material removal. Processes and mechanisms that consume power in excess of that required for actual cutting or shearing of material are called parasitic mechanisms. This non-cutting energy is also influenced by the tool flank wear due to rubbing between the flank face of the tool and the workpiece surface. Chatter is another parasitic mechanism that is self-sustaining and self-propagating in nature and occurs because of the interaction between the dynamics of the machine-tool-workpiece configuration and the mechanics of metal cutting. 7 A number of factors, including cutting parameters, tool and workpiece geometry, the use of machining lubricants, etc., can influence chatter occurrence and subsequent propagation. 8 Chatter is inherently unbounded, and once it begins to propagate, it causes undesirable increased cutting forces and power consumption, resulting in a rapid increase in tool wear and deterioration of the machined surface quality. Each of these parasitic mechanisms – the energy dissipated in the tertiary zone, chatter, and tool wear – may materialize individually and/or develop interactions between them. These parasitic mechanisms may have considerable overlap and this further necessitates their suppression.

Schematic of a 2D orthogonal cutting operation depicting the three deformation zones: primary, secondary, and tertiary.
Chatter studies in the past have made use of various analytical techniques using the classical control theory approach or the Chebyshev collocation method to construct stability lobe diagrams (SLD) and enable the determination of chatter-free cutting conditions.9–14 Other efforts applied active and passive damping devices to absorb vibrations.15,16 Additionally, statistical techniques using recurrence plot quantification of input current, tool vibration, and speckle pattern of the machined surface had also been employed for chatter detection. 17 These solutions are complex and often require the ancillary use of components such as vibration dampers in the machine-tool configuration. The lack of a simple and effective chatter suppression solution restricts machining processes to less aggressive conditions (removal rates) and reduces overall industrial productivity.
The effects of cutting tool nose radius, a primary geometric feature in machining, on chatter have been studied using analytical techniques. Budak and Ozlu presented models to predict chatter for turning and boring operations considering the effects of nose radius on stability limit.18–20 They concluded that with an increase in the tool nose radius, dynamical effects increase in the depth-of-cut direction and consequently amplify the effect of workpiece dynamics on the cutting process. Eynian and Altintas also modeled the cutting force dynamics in lathe turning processes by taking into account tool geometry and cutting conditions to predict stability limits. 21 A larger tool nose radius decreased the stability limit by directing the cutting forces in the radial direction which is less stable during longitudinal turning operation. However, this nose radius effect is dependent on the feedrate direction as well. Rao and Shin presented a dynamic cutting force model considering the cross-coupling effect to predict chatter during turning of AISI 4140 steel. 22 At cut depths closer to the size of the nose radius, chatter is initiated due to this cross-coupling effect wherein a small displacement in the radial direction intensifies the effect in the axial direction. Additional efforts for predicting chatter using dynamic cutting force models that account for the nose radius effect have reported similar results, that is, increasing nose radius increased dynamic forces in the radial direction and narrowed stability limits.23,24
The nose radius of a cutter can significantly affect both tool wear and surface finish. Singh and Rao 25 and Chou and Song 26 individually studied the effect of tool geometry parameters including nose radius for hard turning of AISI 52100 steel. Both of these studies reported a decrease in surface roughness with an increase in nose radius. Similar results were reported in the works of Looney et al. and Patel and Gandhi for turning of metal-matrix composite and AISI D2 steel respectively.27,28 Zerti et al. employed Taguchi method to optimize cutting parameters, such as approach angle, tool nose radius, cutting speed, feedrate, and cutting depth, for dry turning of AISI D3 steel, with the aim of minimizing surface roughness, cutting force, and cutting power. 29 The study revealed that increasing the tool nose radius and approach angle led to a decrease in surface roughness. Contrary to these results, Neseli et al. found that increasing the tool nose radius increased surface roughness when turning AISI 1040 steel. 30 Endres and Kountanya studied the nose radius effect on tool wear for turning of AISI 1040 steel and reported that tool wear is lower for higher nose radii. 31 Hakami et al. reported excessive chipping and crater wear with decreasing nose radius in a comprehensive review of machining metal matrix composite. 32 Another study examined the impact of nose radius on surface finish and tool wear during the machining of AA7075/ SiC composite using experimental and statistical analysis. 33 Larger nose radii improved the surface finish, while smaller radii exhibited higher tool wear. The methodology involved CNC turning with titanium nitride-coated tungsten carbide inserts by varying process parameters such as cutting speed and feed. Design of experiments (DOE) and ANOVA were employed to identify significant parameter effects. Shah and Bhavsar investigated the influence of cutting parameters, including nose radius, on cutting performance during turning extra low interstitial (ELI) Ti-6Al-4V. 34 The ELI grade of Ti-6Al-4V possesses higher ductility and improved fracture stiffness compared to the more commonly known grade 5 Ti-6Al-4V. Using experimental data and optimization via response surface methodology (RSM) and particle swarm optimization (PSO), the authors highlight parameter combinations that minimize cutting force, surface roughness, and temperature, concluding that nose radius had the maximum impact on reducing surface roughness followed by the depth of cut and feed rate. A similar study performed on dry turning of Inconel 718 also indicated that tool nose radius and feed rate had the maximum impact on machined surface quality. 35 The findings provided insights into optimizing machining parameters to enhance the surface integrity and fatigue life of machined components.
The current study includes experimental results for a smaller nose radius as low as 0.2 mm. This was to ascertain the impact of extreme nose radii values on a range of parasitic mechanisms. The outcome of such a work will open up the scope for simple and frugal solutions for sustainable manufacturing. 36 Frugality and advanced frugal innovations/products, albeit a newer concept, have gained significant traction in recent times and emerged as an appealing approach for creating affordable products while accounting for climate change and limited resources.37–39 This work serves as a building block toward the goal of introducing and incorporating the principles of frugal manufacturing in traditional machining-based processes and industries. Frugal manufacturing (FM) has been defined as fabrication using a minimum number of low-cost processes producing zero waste for creating a net finished shape (NFS) possessing the necessary geometric tolerances, surface integrity, and material properties. 36
Materials and methods
The cutting experiments were performed on a CNC lathe (Haas TL-2) configured with a four-jaw chuck for workpiece clamping. The workpiece was round bars of Al 6061-T6 aluminum alloy (150 mm length × 76 mm diameter). The cutting tools were carbide inserts (SECO Tools). Inserts with nose radii r = 0.2, 0.4, and 1.2 mm were used for the cutting tests covering a range of tool nose geometry. The cutting experiments included industry-standard cutting conditions as well as some extreme conditions. Other tool geometry parameters like rake angle (α), clearance angle (γ), and cutting edge angle (К) were held constant in order to independently study the influence of nose radii on cutting forces, chatter, tool wear, and surface finish. These tool geometry parameters and the cutting conditions imposed during the experiments are listed in Table 1. The cutting conditions comprising speed, Vc (m/min), feedrate, f (mm/rev), and depth-of-cut, ap (mm) were selected over a broad range of conditions including some beyond recommended limits by ISO standards. 40 The cutting forces were measured using a Kistler 9257B dynamometer connected to a Kistler 5010B charge amplifier. Force data was collected with LabVIEW data acquisition software at a sampling frequency of 100 Hz. The schematic of the experimental setup and images of the actual experimental setup are shown in Figure 2(a) and (b) respectively.
Cutting parameters.


(a) Schematic and (b) image of the experimental setup comprising tool-workpiece-dynamometer and surface profilometer.
Chatter characterization
The cutting forces measured by the dynamometer were used to detect chatter. 41 The onset of chatter can be evaluated from the peak-to-peak value of cutting forces whose variation is indicative of the onset and evolution of chatter. One advantage of using peak-to-peak force to identify the onset of chatter is that the force can be measured and monitored in real-time, thus enabling feedback control of cutting parameters or subsequent changes to the machine-tool configuration to suppress chatter.
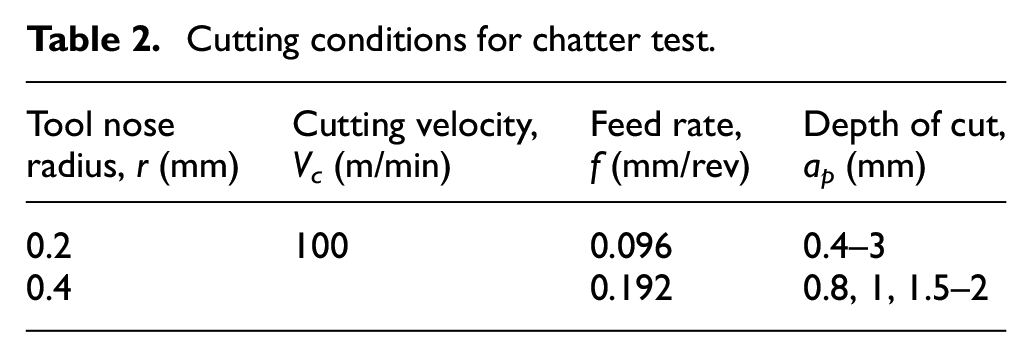
Experiments were performed in addition to the conditions listed in Table 1 to identify the onset of chatter for the various nose radii. The cutting conditions for these experiments are shown in Table 2. The feedrate was set 40% below the recommended ISO standards limit for these tool nose radii. 40 The depth-of-cut was varied to capture the onset of chatter. It is often difficult to obtain chatter variation at very small amplitudes and for small changes in frequency from the time-domain force signal directly. For analysis, the time-domain signals obtained from these experiments were transformed to the frequency domain via fast Fourier transform (FFT). To identify the chatter frequency through FFT, the power spectral density (PSD) was also computed to obtain the power distribution of signals across different frequencies. An attempt to quantify chatter during the cutting process was also made by recording the intensity of the sound (dB) using a sound meter. The microphone was placed in close proximity to the cutting zone to minimize ambient background noise and focus on sound originating from the cutting process.
Cutting conditions for chatter test.
Machined surface quality assessment
Surface roughness is typically quantified over some discrete sampling length using the average line roughness (Ra) parameter, which is the absolute deviation of roughness from the mean or reference.42–44Average surface roughness, Sa is an extension of Ra to an area of a surface and is computed as the arithmetic mean of the absolute surface profile values in the defined area. 45 Surface profiles from the machined Al 6061-T6 workpieces were measured by optical profilometry using a 10× objective lens and 1× zoom over a 0.83 × 0.83 mm field of view (FOV) and 0.815 µm lateral resolution with a scanning length of 200 µm on a Zygo Newview 8300 profilometer shown in Figure 2(b). These surface profiles were then processed using an open-source software to compute the respective Sa values (ProfilmOnline). The final Sa value was reported as the average of measurements taken over ten different locations on the workpiece surface.
Tool wear measurement
Tool wear is another parasitic mechanism that is primarily categorized into two types, crater wear of the tool rake face and flank wear due to rubbing between the tool flank and workpiece.46–48 The parasitic non-cutting energy expended in the tertiary zone, as discussed and shown in Figure 1, results from rubbing action between the tool flank and the freshly cut workpiece surface. This energy propagates and increases with increasing material removal. In practice, these tool wear mechanisms have been addressed by the use of cutting lubricants (fluids) and performance coatings on the cutting tools such as titanium carbide (TiC), titanium nitride (TiN), and alumina (Al2O3).49–52 Tool-life criteria have been standardized based on cutting tool material and cutting conditions according to Taylor’s tool-life equation. 40
In the present study, the effect of varying nose radius on tool wear is investigated by flank wear measurements. The cutting time was 15 min for all the tool nose radii tested to allow for considerable wear to occur but well before tool failure. The worn tool tip was imaged with the optical profilometer using a 10× objective lens and 2× zoom over a 0.42 × 0.42 mm FOV and a 0.41 µm lateral resolution. The scan origin was at the top with a 400 µm scanning length for imaging the tool flank wear. Tool flank wear was reported as the average of 12 measurements from image processing using an open-source software (ImageJ).
Results and discussion
The effect of varying the tool nose radius on parasitic mechanisms such as chatter was studied by observing the resulting changes in cutting forces, tool wear, and surface finish. The results are accordingly reported in the sections below.
Analysis of forces and specific cutting energy
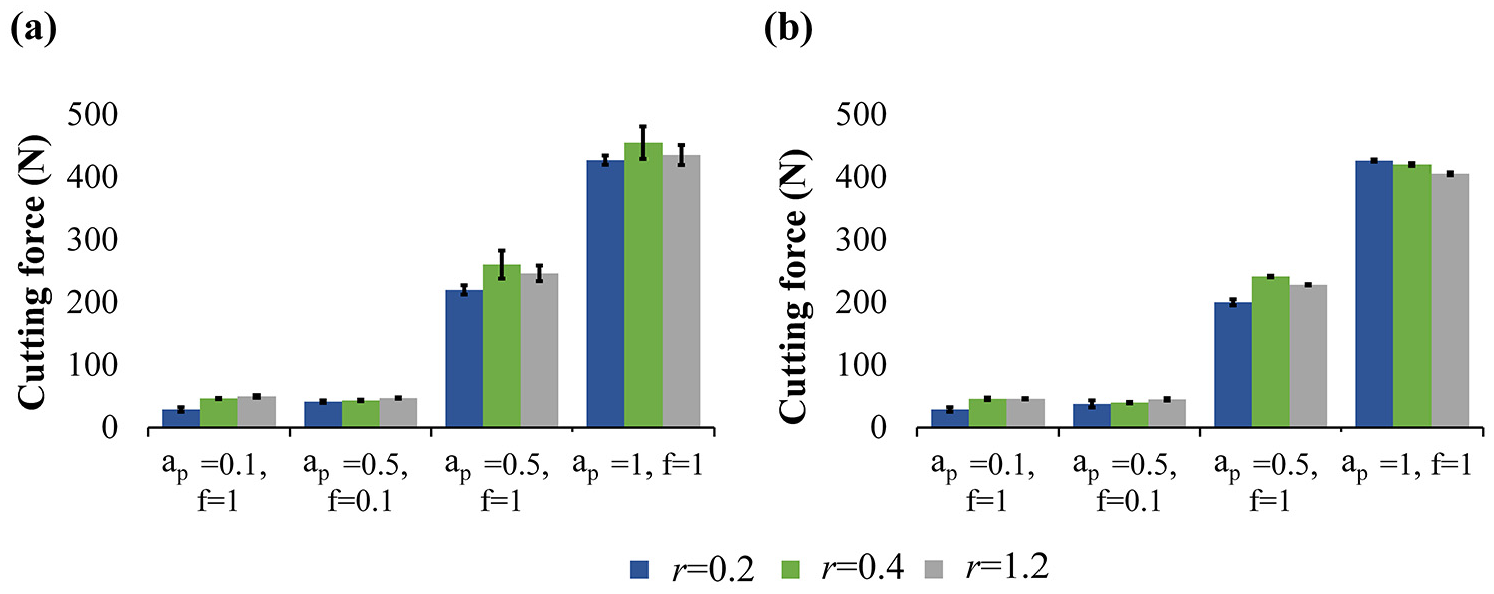
Cutting force is measured in the tangential direction (Fc in the schematic in Figure 2) and is generally the highest measured value which directly impacts cutting power. 50 Figure 3(a) and (b) illustrate the variation of cutting force (Fc) with nose radius (r) of the cutter for two different cutting speeds (Vc) of 10 and 100 m/min, respectively, at feedrate, f = 1 mm/rev and depth-of-cut, ap = 0.1 mm. Cutting force is seen to increase with an increase in nose radius. This is because a larger nose radius increases the contact area between the tool and the workpiece, which leads to higher material deformation and friction during machining. There is a 38- and 42% drop in Fc for r = 0.2 mm compared to cutting with a nose radius of r = 0.4 and 1.2 mm, respectively. Figures 4 and 5 depict the overall variation of cutting and radial force respectively for the different tool nose radii and cutting conditions. Radial or thrust force is measured in the depth of cut direction, Fr in Figure 2 schematic, and directly impacts machine-tool-workpiece system deflections and, thus, process stability or tendency to chatter.53,54 As seen from Figure 4, the cutting forces for the nose radius of 0.2 mm are minimal even under aggressive cutting conditions, except only at the higher speed Vc = 100 m/min, f = 1 mm/rev, and ap = 1 mm. This exception could be the result of increased peak-to-peak cutting force and will be discussed in the next section. These increased peak-to-peak forces can contribute to increased vibration between the tool and workpiece during cutting, consequently leading to higher cutting forces. The smaller nose radius of 0.2 mm also produces the least radial forces for almost all the cutting conditions, as seen in Figure 5. In addition, the radial forces are consistently lower than the cutting forces in the tangential direction for all the nose radii and cutting conditions. The reverse is generally observed for finish turning or precision machining operations where the depth of cut is much smaller than the nose radius.26,55 The radial force affects tool deflection, giving rise to vibration or vice versa, and hence, is significant for machine-tool-workpiece stability. Smaller radial forces associated with the smaller nose radius, thus, also imply increased cutting stability and reduced tendency to chatter which will be discussed in detail in the next section.

Cutting force variation with nose radius, r at (a) Vc = 10 and (b) Vc = 100 m/min, f = 1 mm/rev, and ap = 0.1 mm.
A bar graph of tangential cutting force variation with nose radius, r at (a) Vc = 10 m/min and (b) Vc = 100 m/min.

A bar graph of radial force variation with nose radius, r at (a) Vc = 10 m/min and (b) Vc = 100 m/min.
However, the tool nose radius of 0.4 mm showed the maximum cutting force for the conditions corresponding to f = 1 mm/rev and ap = 0.5 mm, surpassing the cutting forces for the larger r = 1.2 mm tool for both low and high cutting speeds and even at f = 1 mm/rev and ap = 1 mm at the lower speed. This is an anomaly to the increasing cutting force with increasing nose radius trend that needs further investigation for a clear explanation as multiple factors, including tool geometry, workpiece material, and cutting parameters, may be affecting this difference in cutting force. The r = 0.4 mm tool, in fact, generated the highest radial forces for f = 1 mm/rev and ap = 0.5, 1 mm for both the cutting speeds tested. General recommendations as per ISO standards suggest a cutting speed range of 180–300 m/min, feedrate of 0.05–0.4 mm/rev, and depth-of-cut of 0.5–2 mm for a carbide insert with a nose radius of 0.4 mm for cutting Al 6061. 40 These cutting conditions should be optimized based on the desired machining objectives as well as other tool geometry parameters. However, the machining conditions with higher cutting and radial forces for r = 0.4 mm as opposed to r = 1.2 mm are well beyond the recommended range of cutting speed and feedrate, which could explain the observed anomaly. It is worthwhile to note that the smallest nose radius of 0.2 mm generates the lowest cutting and radial forces even under these aggressive conditions.
From the plot in Figures 4 and 5, the variation in real-time cutting as well as radial forces may seem less due to the graph being normalized with respect to the highest force value. In machining operations, even the smallest change in forces generated could lead to significant improvement in the sustainability of the operation and manufacturing processes in general. Accordingly, this study was undertaken to examine the nature of the cutting force variation with nose radius under practical cutting conditions.
Figure 6(a) and (b) show the specific cutting energy (U = Fc/f × ap × 103), measured in J/mm3, as a function of nose radius for varying cutting conditions. The specific energy represents the amount of energy required to remove a unit volume of material and therefore, is a direct measure of the energy-efficiency of the process. Specific energy is also a measure of the effectiveness of cutting parameters achieving the desired material removal rates. Lower specific energies were obtained for the smaller nose radius of 0.2 mm across all of the experimental cutting conditions. This implies a more energy-efficient sustainable cutting process for the same amount of material removed as compared to higher nose radii tools. Additionally, specific energy is significantly lower for higher feed rates with minimal influence from cutting speed or depth of cut. Studies have also shown a positive rake angle to have an alleviating effect on specific cutting energy in addition to higher feedrates and smaller nose radii as pointed out in this work. 56 Consequently, power consumed during the cutting process (P = Fc × Vc/60) in watts also increases with an increase in nose radius in line with the increase in cutting force.

Variation of specific cutting energy (J/mm3) with nose radius, r for (a) Vc = 10 and (b) Vc = 100 m/min.
The results presented in this section can be summarized as follows – the smallest tested nose radius of 0.2 mm produces the least cutting forces, radial forces, and specific cutting energy and, hence, consumes the least cutting power. These results have been observed over a range of cutting conditions tested for longitudinal turning of Al 6061 and can thus be extended to other machining processes, such as milling and micro-machining operations under a favorable combination of features such as tool angles, cutting parameters, and tool-work material combinations.
Chatter
The tendency to chatter or machining instability has been quantified in terms of peak-to-peak cutting force, and its variation with nose radius (r) is depicted in Figure 7(a) and (b) for the lower and higher speeds, respectively. These peak-to-peak forces correspond to the maximum and minimum cutting forces experienced during an instance of cutting. The trend for peak-to-peak force varies with cutting conditions such as speed, feed, and depth-of-cut, as well as cutting tool geometry and workpiece material. As seen from Figure 7(a) and (b), there is no visible trend for the variation of the peak-to-peak forces across the different nose radii. Among the cutting parameters, depth-of-cut is known to have the most impact on chatter (and peak-to-peak forces). Accordingly, Figure 8(a) and (b) show the variation of the peak-to-peak cutting force with depth-of-cut ranging between ap = 0.1 and 1 mm for the three different nose radii. With an increase in depth-of-cut, the peak-to-peak force increases due to the evolution of vibration instabilities for all the nose radii at both lower and higher cutting speeds. However, for r = 1.2 mm, a deviation is observed where the peak-to-peak force increases with an increase in depth from 0.1 to 0.5 mm but decreases sharply with a further increase in depth to 1 mm. This could be a case of the unstable-stable chatter phenomenon wherein an increase in depth-of-cut actually decreases chatter for cutting at depths of cut close to the nose radius. This phenomenon has been attributed to a cross-coupling effect that exists between radial and axial vibrations during turning. 22
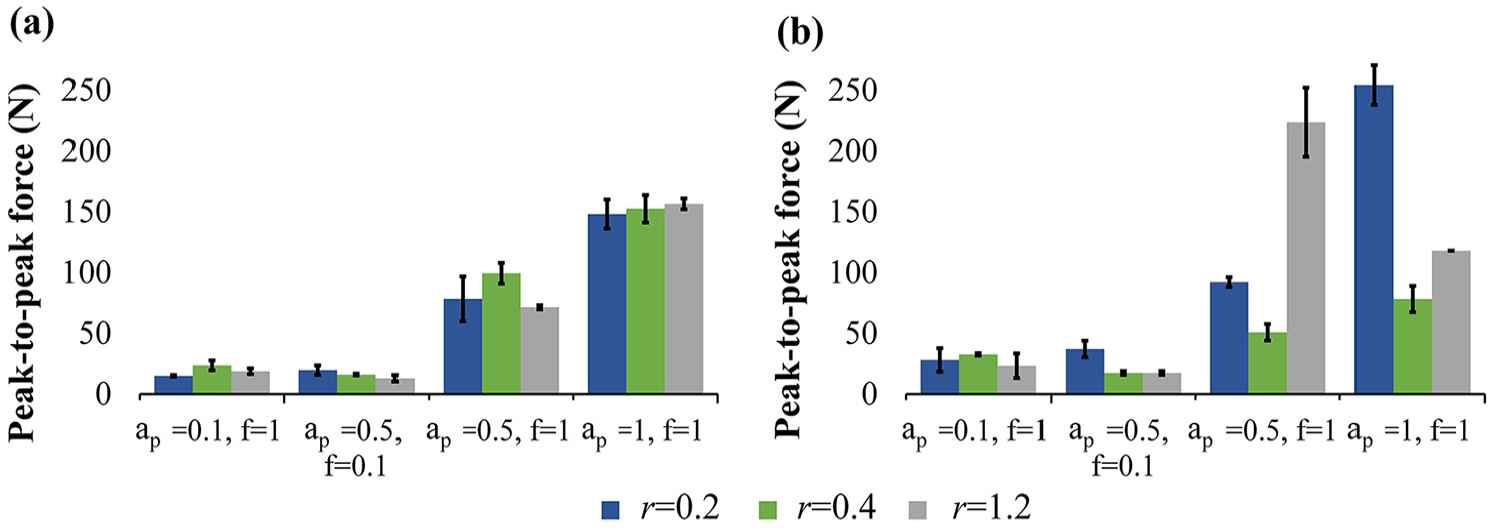
Variation of chatter in terms of peak-to-peak cutting force with nose radius, r for (a) Vc = 10 m/min and (b) Vc = 100 m/min.
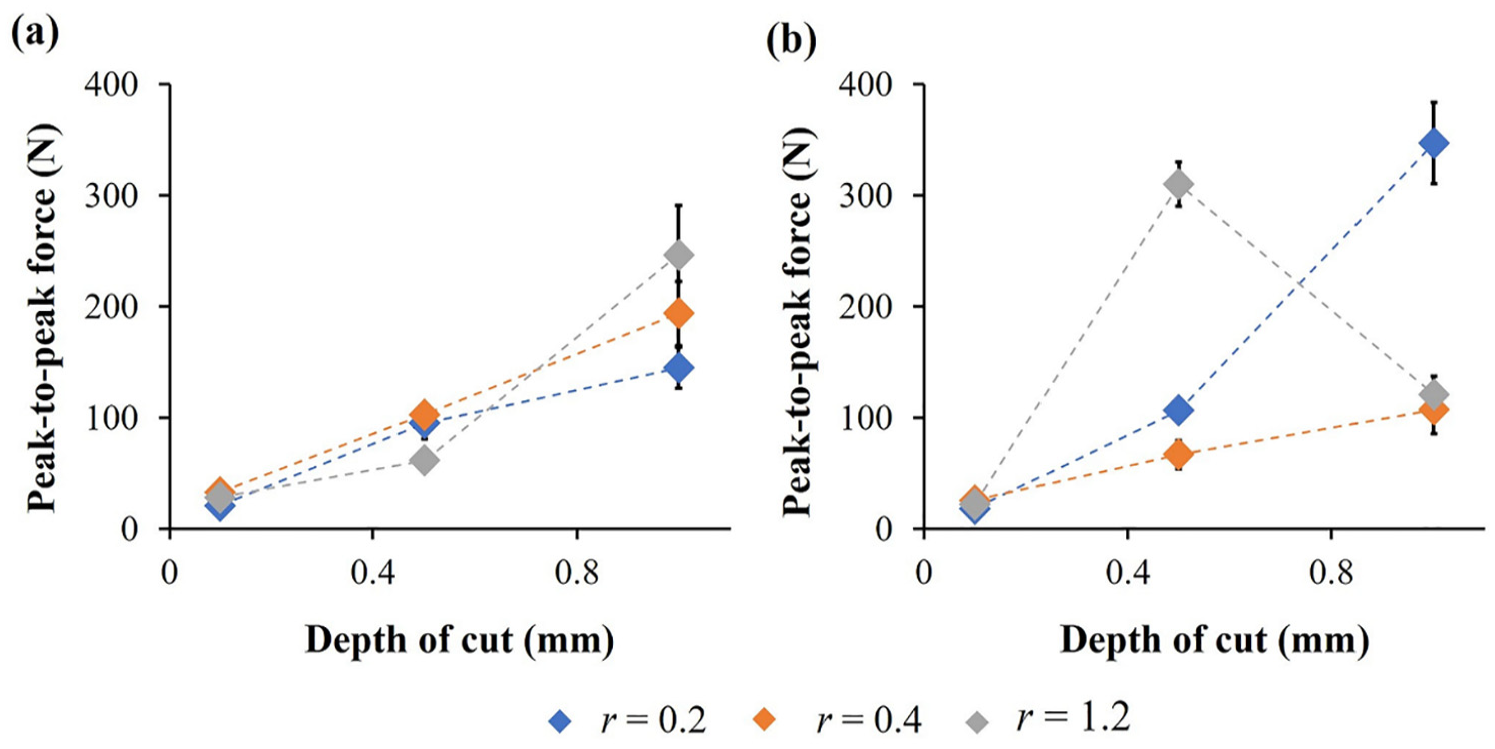
Variation of peak-to-peak cutting force with depth of cut for three nose radii at (a) Vc = 10 m/min and (b) Vc = 100 m/min and f = 1 mm/rev.
Additional cutting tests were tailored to observe the chatter or unstable cutting limit for the tool nose radii of 0.2- and 0.4-mm. Cutting was performed under the following fixed conditions: speed of 100 m/min and feedrate corresponding to 40% below the maximum recommended limit for the nose radius tool. The depth-of-cut was gradually varied from the recommended minimum, which is twice the nose radius, to a maximum where the cutting was unstable and beyond which it could not be continued. Such unstable cutting was encountered at a depth of 3 mm for the 0.2 mm nose radius tool and at 2 mm for the 0.4 mm nose radius tool. This can be seen from the periodic frequency peaks in the FFT and PSD plots in Figure 9(a) and (b) for the 0.4 and 0.2 mm nose radius tools respectively. The frequency for chatter-onset was taken to correspond to the dominant mode of the frequency peaks and was found to be 20.3 Hz for r = 0.4 mm and 44 Hz for r = 0.2 mm. This is consistent with the FFT and PSD responses where this frequency is dominant. The onset of chatter is also confirmed by the significant degradation of machined surface quality shown in the optical images in Figures 10(a) and (b). The average surface roughness (Sa) for the 0.4 mm nose radius tool varied from 1.95 to 5.15 µm in transitioning from stable machining (chatter-free) to chatter-like unstable conditions. A similar jump from 1.84 µm for the stable machining to 5.77 µm for the unstable cut was also observed for the r = 0.2 mm nose radius tool. In addition, the onset of chatter or unstable cutting can also be verified by the correspondingly sharp increase in sound from 67 to 90.7 dB and 66.2 to 102.6 dB for r = 0.4 and 0.2 mm respectively, as seen in Figure 11(a) and (b).
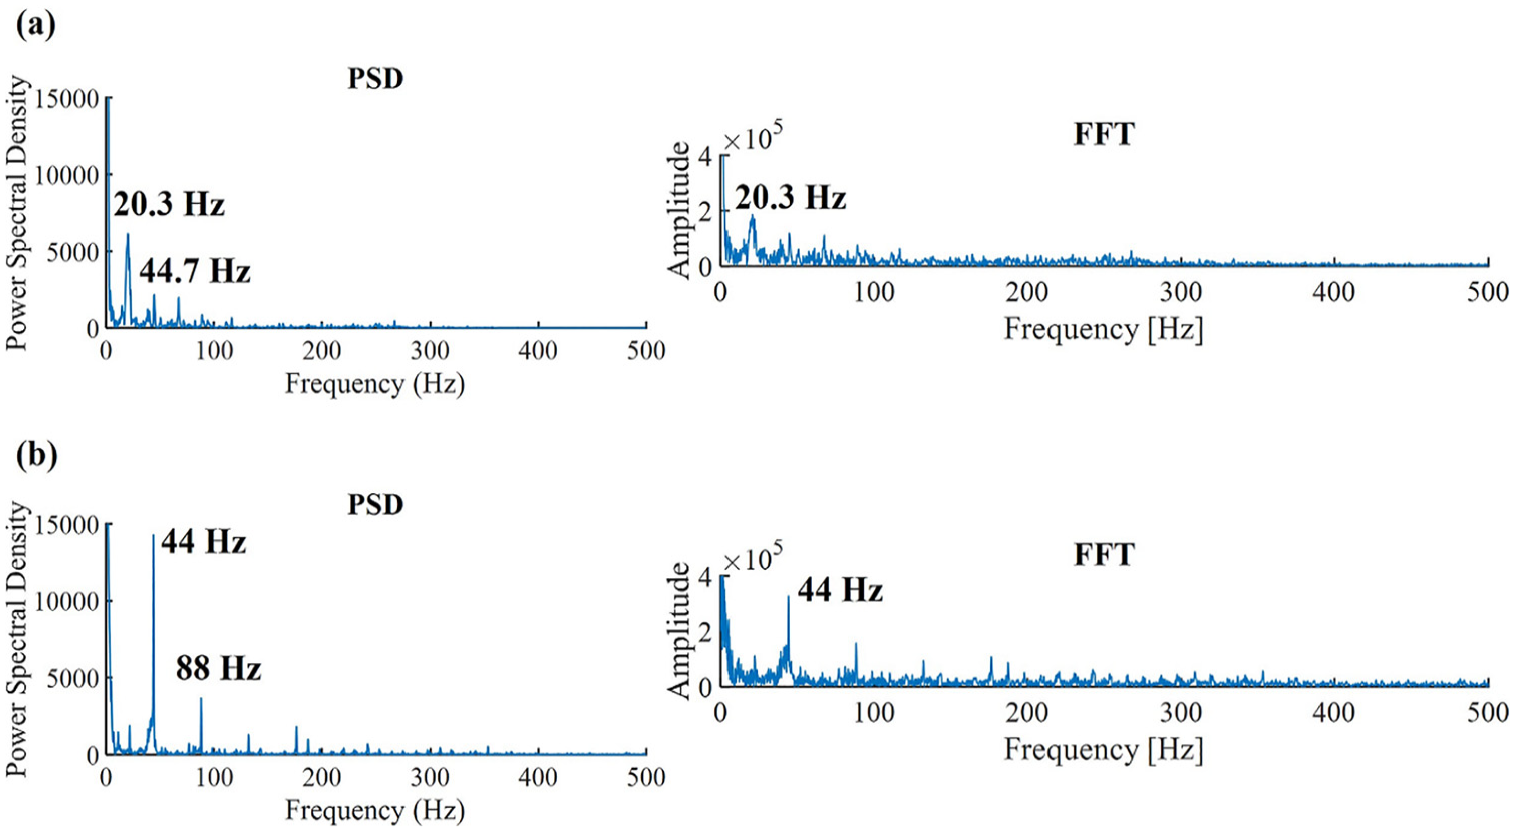
PSD and FFT plots for the chatter case of (a) r = 0.4 mm, ap = 2 mm and (b) r = 0.2 mm, ap = 3 mm.

Optical image of chatter surface and machined surface just before chatter for (a) r = 0.4 mm, ap = 2 mm and (b) r = 0.2 mm, ap = 3 mm bringing out the difference in machined surface quality

Sound signal for (a) r = 0.4, ap = 2 mm and (b) r = 0.2 mm, ap = 3 mm depicting a sharp dB increase due to chatter.
The limit on the recommended depth-of-cut for nose radii tools is ten times the feedrate which is 0.96 mm for r = 0.2 and 1.92 mm for r = 0.4 mm. Thus, the limit on depth-of-cut or the stability limit for the 0.2 mm nose radius tool is higher than that for the 0.4 mm tool. It is also significantly higher than its recommended limit of 0.96 mm for the cutting parameters used in the study. Therefore, for a given setup including the tool and workpiece with proper cutting parameters, a smaller nose radius provides a higher stability limit and hence, lesser tendency to chatter over the range of conditions studied in this effort.
Figure 12 illustrates the variation of sound measured in decibels with varying nose radius, r for cutting as well as non-cutting spindle rotation. This non-cutting spindle rotation sound was recorded as 54.5 dB for Vc = 10 m/min and 62.6 dB for Vc = 100 m/min. Although the difference may appear less significant, sound intensity in dB (L) is measured on a logarithmic scale with respect to power consumption by the sound wave per unit area in Watt/m2 (I), as given by equation (1). 57 Hence, a 10 dB increase in sound corresponds to a 100-fold increase in sound intensity in Watt/m2 or a factor of 10. This also means that a 1 dB increase in sound results in a 26% increase in sound energy (Watt/m2).

where, L– sound intensity in dB; I– sound intensity in watt per square meter; I0– reference sound intensity of 10–12 W/m2.
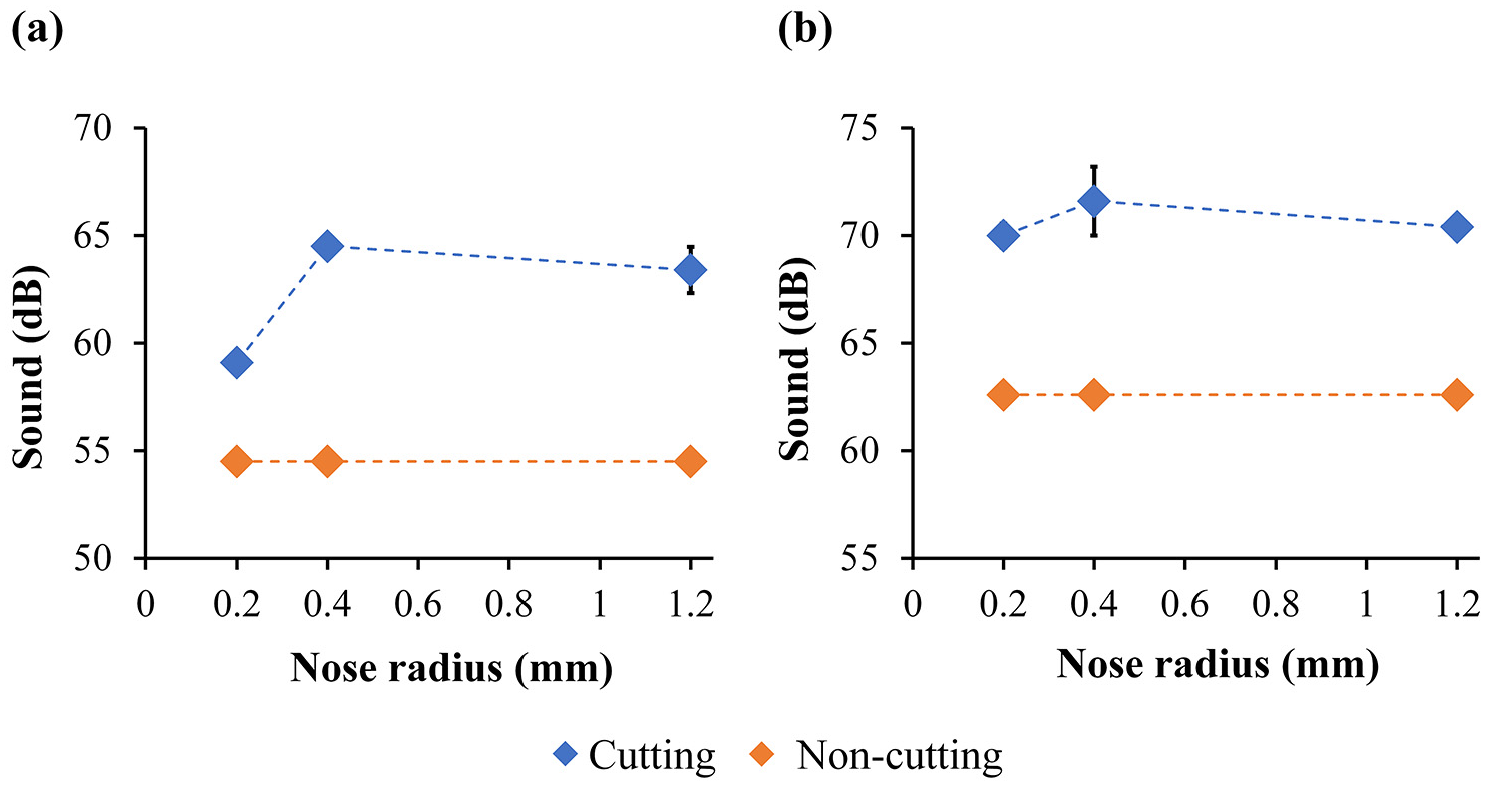
Variation of chatter in terms of sound in dB with varying nose radius, r for (a) Vc = 10 m/min and (b) Vc = 100 m/min recorded using a sound meter.
The increase in sound intensity was computed using equation (1), in terms of sound energy dissipated for the three nose radii tools. At low speeds, the tool with the smallest nose radius of 0.2 mm resulted in the least increase in sound energy (65%) compared to the nose radii of 0.4 and 1.2 mm, which resulted in 90% and 87% increase, respectively, from non-cutting spindle rotation. The r = 0.2 mm tool also had marginally less of an increase in sound energy (82%) at high speeds compared to the r = 0.4 mm (87%) and r = 1.2 mm (83%) cutting tools. Therefore, chatter-onset was delayed for the r = 0.2 mm tool in terms of both sound intensity in dB and energy vis-a-vis the remaining nose radii.
The results discussed in this section can be summarized as follows: the smallest nose radius of 0.2 mm gives an increased stability limit of 3 mm as compared to 2 mm for the higher nose radius of 0.4 mm, thus leading to the deduction that with a decrease in tool nose radius cutting process stability increases.
Surface finish and tool wear
Figure 13(a) shows the variation of average surface roughness, Sa with nose radius, r for the lower and higher cutting speeds respectively at f = 0.1 mm/rev and ap = 0.5 mm. A larger nose radius produces a finer machined surface quality whereas a smaller nose radius generates a rougher surface due to densely grouped grooves being left on the machined surface, as observed in prior studies. 44 This behavior can be attributed to the kinematics of cutting and the geometry of the cutting tool, where a larger nose radius smoothens the transitions between successive tool paths, resulting in reduced surface irregularities. This is evident from the plot where the r = 1.2 mm tool gives the least Sa value or a relatively superior machined surface. In general, Sa followed a decreasing trend with increasing nose radius. This trend aligns with existing literature, which highlights that larger nose radii reduce the cusp height between consecutive tool passes, leading to improved surface finish.45,46 The variation of Sa with ‘r’ was also tested for a higher feedrate at Vc = 100 m/min, f = 0.2 mm/rev, and ap = 0.1 mm. This condition was selected based on the recommended maximum feedrate for stable cutting as per ISO standards (one or more of the combinations of standard cutting conditions listed or 0.8 times the nose radius which is equivalent to 0.16 mm/rev for the 0.2 mm nose radius tool). 40 Even under this condition, Sa followed a consistent decreasing trend with an increasing nose radius from 0.2 to 1.2 mm, as seen in Figure 13(b).
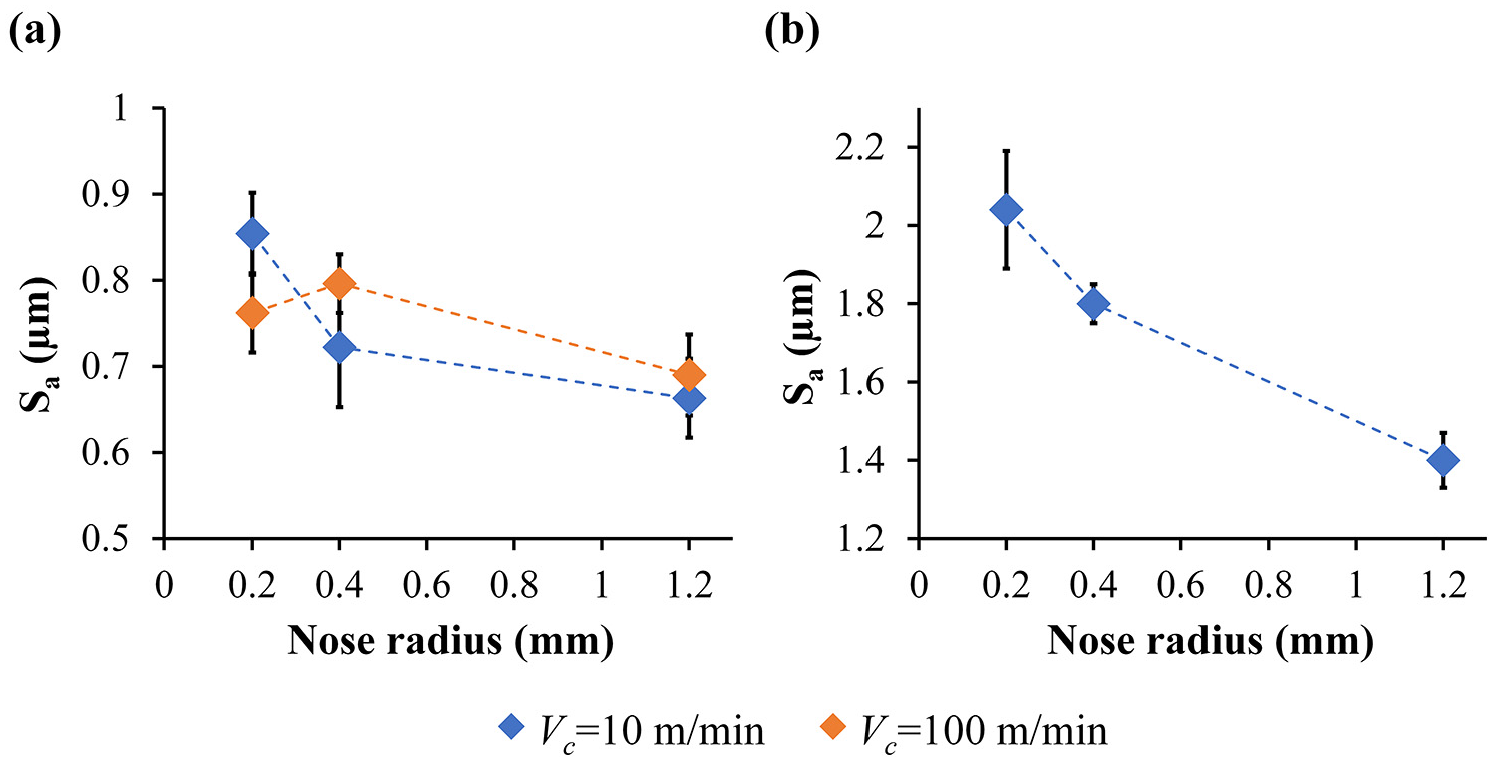
Variation of average surface roughness, Sa with nose radius, r for (a) Vc = 10 and 100 m/min at f = 0.1 mm/rev and ap = 0.5 mm and (b) Vc = 100 m/min, f = 0.2 mm/rev, and ap = 0.1 mm.
The improved surface finish with larger nose radii can also be explained by the increased contact area between the cutting tool and the workpiece, which reduces the intensity of stress and minimizes abrupt tool-workpiece interactions. This reduces the likelihood of irregularities such as feed marks and tearing of the surface, as corroborated by studies on tool geometry and surface roughness in turning processes.47,48 Additionally, the larger nose radius promotes greater stability during cutting, reducing vibration-induced defects on the machined surface. 49 These findings are consistent with empirical and analytical studies on the influence of tool geometry on machined surface quality. Thus, the relationship between Sa and nose radius underscores the critical role of tool geometry in achieving a desirable surface finish in machining. The observations in this study not only validate prior findings but also demonstrate the robustness of the decreasing Sa with increasing nose radius trend across varying cutting speeds and feed rates.
Tool wear exhibits a decreasing trend with an increase in nose radius, as shown in Figure 14. This behavior can be attributed to the improved distribution of cutting forces across a larger area with a larger nose radius, which reduces localized stress at the cutting edge. This can also be seen from the increasing chip load for higher nose radius to be discussed in the next section on mechanistic chip load modeling. The enhanced load distribution mitigates wear mechanisms such as micro-chipping and crater wear, despite the higher cutting forces associated with larger nose radii seen in Figure 3. Additionally, a larger nose radius improves the stability and strength of the cutting edge, making it more resilient to mechanical and thermal degradation during machining.

Variation of flank wear with nose radius, r for Vc = 100 m/min, f = 0.1 mm/rev, ap = 0.5 mm and a cutting time of 15 min.
Optical micrographs of tool flank wear after 15 min of machining time, presented in Figure 15, further highlight this relationship. The images demonstrate a reduction in the extent of wear as the nose radius increases, supporting the observation that the improved cutting edge geometry contributes to lower wear rates. This trend underscores the complex interplay between cutting forces, tool wear, and nose radius in machining processes.

Optical micrographs of tool flank wear for the three nose radii used in the study: (a) r = 0.2 mm, (b) r = 0.4 mm, and (c) r = 1.2 mm.
Surface roughness and tool wear increase with a decrease in nose radius as opposed to cutting forces, specific energy, and stability limit. Thus, the selection of nose radius will also be impacted by the machined finish requirements. In order to minimize force and power consumption using a small nose radius, other features that compensate for the loss in surface quality and tool strength have to be explored. These features and techniques have been discussed in detail in another work by the authors. 58
Mechanistic chip load modeling
For longitudinal turning with a nose radius tool, the chip load is computed from the instantaneous uncut chip area, 59 as shown by the shaded region in Figure 16(a). At any instant of time, the chip load is discretized into very small elements, and at each of these discrete elements, the instantaneous undeformed chip thickness can be calculated as a function of their distance ‘θ’ from the vertical axis considering a polar coordinate system.60,61 Since the rake and inclination angles used in the current study were both zero degrees, the undeformed chip thickness tθ can be calculated using geometrical relations from Figure 16(b) assuming two regions of interest between the tool-workpiece contact zone.

(a) Uncut chip area for nose radius tools, (b) geometric model of chip load, and (c) elemental differential chip load.
These instantaneous chip thicknesses for Region I


Differential chip load for each of these discrete elements, as illustrated in the schematic in Figure 16(c), can be calculated as a function of the instantaneous undeformed chip thickness as:

Figure 17 shows the distribution of chip load as a function of ‘θ’ for the three nose radii of r = 0.2, 0.4, and 1.2 mm. The minimum θ value was selected based on θ ≤
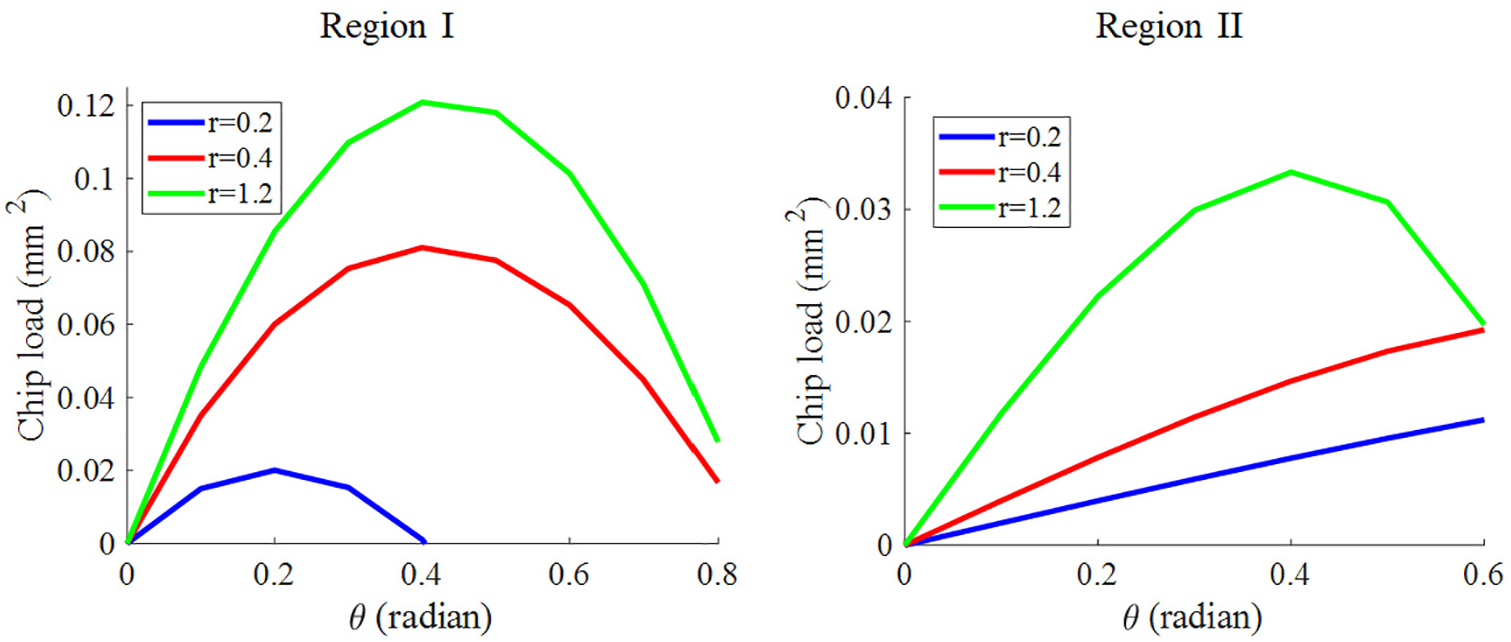
Chip load distribution for nose radii tools (0.2, 0.4, and 1.2 mm) with varying ‘θ’ for Regions I and II.
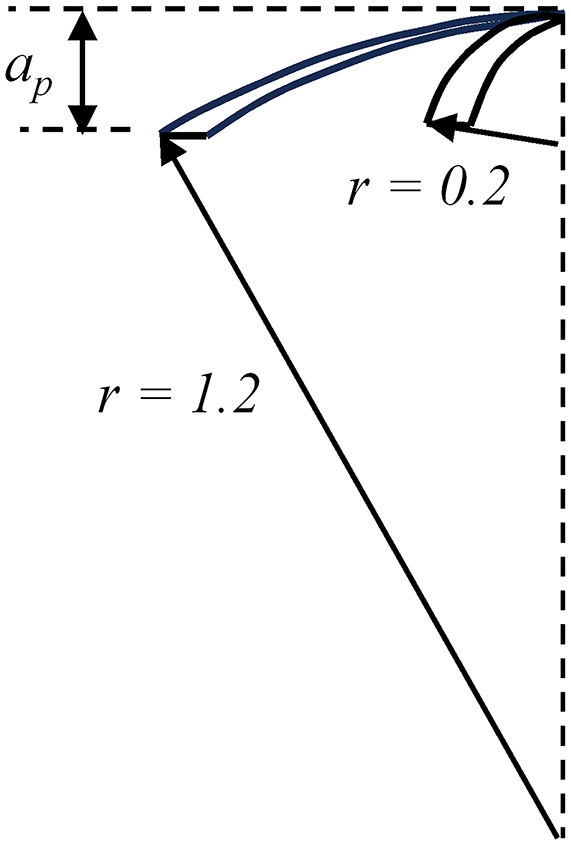
Chip load or uncut chip area shape for r = 0.2 and 1.2 mm.
In simple terms, chip load is the amount of material removed per tool in single-point cutters or per tooth in multipoint cutters. This has been characterized and quantified in this section by the uncut chip area between the tool and chip for two subsequent cutting passes. Analytical results show that chip load or uncut chip area increases with an increase in nose radius. This trend is consistent with the experimental findings. For instance, the higher chip load associated with larger nose radii explains the observed increase in cutting forces due to an increased contact area between the tool and workpiece surfaces. The increased chip load for higher nose radii also enables smoother material engagement, reducing the formation of grooves and feed marks on the machined surface, hence leading to surface finish improvement observed experimentally. Conversely, the reduced chip load for smaller radii contributes to lower cutting forces and specific energy, as well as increased chatter stability. These findings underscore the trade-offs in selecting an optimal nose radius, as larger radii enhance surface finish but come with increased forces and energy demands, while smaller radii reduce these parasitic mechanisms but may compromise surface quality.
Conclusion
This study comprehensively investigated the influence of cutting tool nose radius on parasitic mechanisms, specific energy, and process efficiency in metal cutting, specifically focusing on Al 6061-T6. The findings highlight the critical role of the tool nose radius – a primary tool geometry parameter in turning – in shaping key machining outcomes such as cutting forces, specific cutting energy, chatter stability, surface finish, and tool wear. These parameters are intrinsically linked to machining efficiency and sustainability.
The experimental results revealed that cutting forces (tangential and radial) consistently decreased with a reduction in tool nose radius, even under aggressive cutting conditions. Notably, the smallest nose radius of 0.2 mm achieved the highest reductions in cutting forces, up to 38% and 42%, compared to the larger radii of 0.4 and 1.2 mm, respectively. This force reduction directly translated into lower specific energy and power consumption, enhancing the sustainability of the machining process. Another key finding reported in this paper is the significant improvement in machining stability for smaller nose radii. Cutting tests tailored toward chatter examination demonstrated a 50% increase in the stable depth limit for the 0.2 mm nose radius tool compared to the 0.4 mm nose radius. This increased stability was corroborated by FFT and PSD analysis of force responses and acoustic signals, confirming a delayed onset of chatter. The reduced radial forces and corresponding tool-workpiece deflections with smaller nose radii further contributed to this enhanced stability. While smaller nose radii improved stability and reduced cutting forces, larger nose radii positively influenced surface quality and tool wear. Both surface roughness and tool wear exhibited a decreasing trend with increasing nose radius, a result of improved load distribution and reduced localized stress at the cutting edge. The mechanistic modeling approach confirmed that uncut chip area increased with larger nose radii, explaining the observed trends in surface finish and tool wear.
Table 3 provides a comprehensive summary of the observed trends, reinforcing the importance of selecting an optimal nose radius to balance cutting performance, chatter stability, surface quality, and tool wear for improved process sustainability. While the scope of this study is primarily experimental, the development of detailed, predictive models for processing parameters and parasitic mechanisms would greatly enhance the value of this research. Future work will focus on combining experimental data with analytical and numerical approaches to derive comprehensive equations that govern machining behavior. Such models could better capture the dynamic interplay of cutting forces, chip load, tool wear, and chatter stability across a wider range of machining conditions.
Summary of tool nose radius effects (direction of the arrow indicates increasing ↑ or decreasing ↓) in cutting of Al 6061-T6.
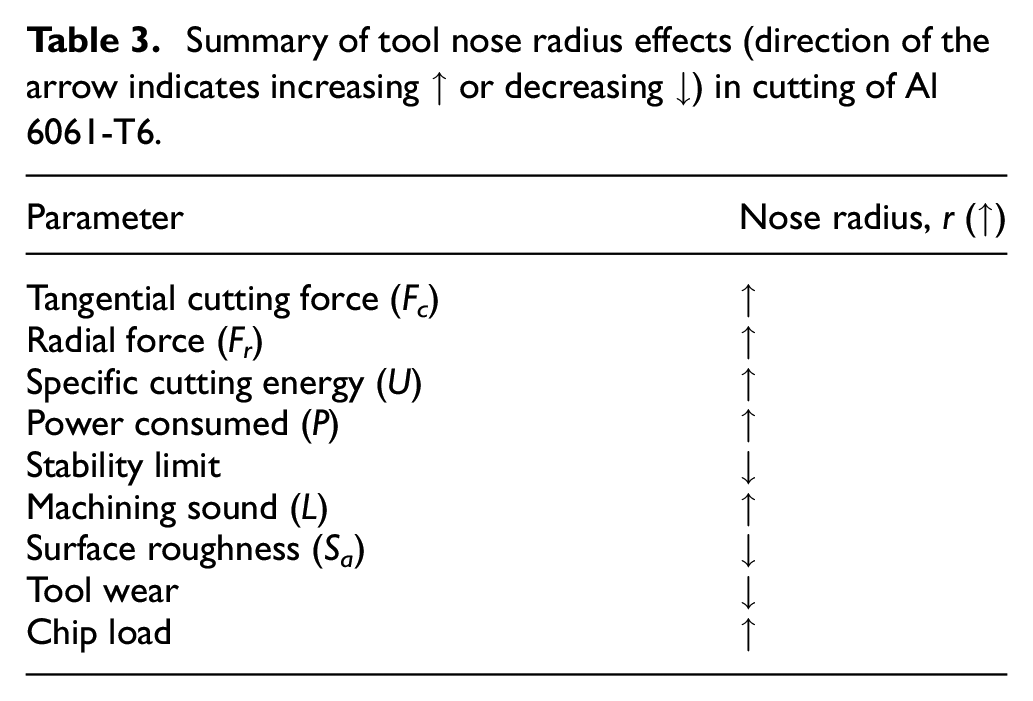
In conclusion, the smaller tool nose radius significantly improved metal cutting efficiency and alleviated parasitic mechanisms by reducing cutting forces and specific energy, increasing the chatter stability limit, and decreasing chip load. However, this was accompanied by increased tool wear and surface roughness. Solutions to minimize or eliminate these drawbacks – such as improved tool materials, coatings, or sharper inserts – could enhance the viability of smaller nose radius tools for achieving frugality and sustainability in machining operations. Although the results in this study are specific to longitudinal turning, the principles are broadly applicable to other machining processes, such as milling and micro-machining, provided that appropriate cutting conditions, geometric parameters, and tool-workpiece material combinations are employed. Adopting tools with optimized nose radii without reliance on ancillary mechanisms offers a frugal solution for conserving resources, reducing costs, and suppressing parasitic mechanisms that hinder current machining operations. This approach aligns with the broader goals of frugal manufacturing, which is sustainable, by improving efficiency and minimizing material and energy waste.
Supplemental Material
sj-docx-1-ade-10.1177_16878132251328057 – Supplemental material for On the effects of tool nose radius in alleviating parasitic mechanisms for cutting of aluminum alloy
Supplemental material, sj-docx-1-ade-10.1177_16878132251328057 for On the effects of tool nose radius in alleviating parasitic mechanisms for cutting of aluminum alloy by Sweta Baruah, James B. Mann, Srinivasan Chandrasekar and Balkrishna C. Rao in Advances in Mechanical Engineering
Footnotes
Appendix
Acknowledgements
The authors would like to acknowledge support from SECO Tools in providing the tool holders and inserts for the experimental investigations. The authors also acknowledge support from the Visiting Advanced Joint Research (VAJRA) faculty program of the Science and Engineering Research Board (SERB), Department of Science and Technology (DST), Government of India for sponsoring the open access charge for this paper.
Handling Editor: Sharmili Pandian
Statements and declarations
Supplemental material
Supplemental material for this article is available online.
References
Supplementary Material
Please find the following supplemental material available below.
For Open Access articles published under a Creative Commons License, all supplemental material carries the same license as the article it is associated with.
For non-Open Access articles published, all supplemental material carries a non-exclusive license, and permission requests for re-use of supplemental material or any part of supplemental material shall be sent directly to the copyright owner as specified in the copyright notice associated with the article.