
Abstract
The Desulfurization Slurry Circulation (DSC) Pump is crucial for controlling gas emissions in limestone-gypsum wet flue gas desulfurization (WFGD) power plants. However, predicting the condition of DSC pumps is hindered by a lack of samples, obstructing field development. This paper proposes a solution using probabilistic gap positive-learning (PGPU) and biased SVM algorithms. Key contributions include: (1) a comprehensive feature model based on expert experience and vibration signal extraction for condition classification, (2) a PGPU and bias-SVM method that updates the model by leveraging probability gaps between true and known samples, and (3) cross-comparisons with other classifiers like SVM and neural networks. Results show the proposed method meets ISO 10816-3 standards and improves accuracy over other methods that don’t account for biased datasets, effectively addressing the state prediction issue for primary WFGD equipment.
Keywords
Introduction
Since thermal power plants use fossil fuels to generate electricity, harmful gases such as SO2 are produced during the power generation process, which poses significant environmental risks. 1 As the Chinese statistic Bureau calculated, in 2020, there were 374 kt of SO2 emitted by China’s power plants, accounting for 11.8 of the total SO2 emissions in China. 2 Hence, the growing interest in the conservation of air quality, strict regulations have been established and implemented all across the globe. 3 Among other methods, because the WFGD technique is the most effective desulfurization technology. 4 Therefore, it was widespread adoption in Chinese thermal power plants 2 is attributed to its simplicity. The DSC is the key component of thermal power plant desulfurization and is a common rotating machinery in modern industrial, civil, and military applications. The performance of DSC pumps deteriorates more rapidly due to the harsh working environment and complex operating conditions, leading to various fault modes such as leakage, friction, and misalignment. These deficiencies result in increased noise and vibration, elevated energy consumption, and even potentially catastrophic consequences. Therefore, maintaining the stable operation of DSC pumps during operation is significant for enhancing their reliability and safety, and effective methods are needed to predict and control the DSC pumps.
To acquire the dynamic response from different sensors is the most common approach for mechanical equipment condition monitoring. 5 For rotating machinery, vibration signals typically carry dynamic information about the mechanical status. 6 Condition prediction methods can identify slight changes indicating equipment condition by computationally analyzing indicators such as amplitude and trends in centrifugal pump vibration signals.7,8 The methods can be divided into model-driven methods and data-driven methods. 1 Model-driven condition prediction methods focused on centrifugal pumps are mainly based on feature synthesis and analysis using indicators obtained by signal processing7,9,10 to achieve condition prediction and life analysis of centrifugal pumps. However, it is difficult to model the assumptions and complex physical phenomena, hindering the application of model-driven methods. 11 Therefore, the data-driven condition prediction method has become one of the main methods. 12 So data-driven condition prediction methods are also in the research direction. These methods do not require an in-depth understanding of device mechanisms. Instead, they establish mappings between the devices and machine learning algorithms 13 like artificial neural networks (ANN), fuzzy systems, support vector machines (SVM), supervised learning, and unsupervised learning methods like k-NN.14–18
To improve the reliability of pumps through condition prediction methods, researchers have devoted efforts to advancing prediction. Zhao et al. 19 compared Gaussian process regression with other three machine learning approaches to estimate the head and efficiency of the centrifugal pump. Singh and Singh 20 proposed a prediction model based on the ANN method, and impellers made from different materials were tested to predict the mud erosion state of heavy-duty pump impeller steel and casing materials. The results showed that the error percentage ranged from 0% to 6%. Irfan et al. 21 compare machine learning and Convolutional Neural Networks for classifying healthy and defective bearings. The accuracy of machine learning for defect classification reached 89.26%. Wu et al. 22 established an offline GA-BPNN model based on genetic algorithms and backpropagation neural networks to estimate the flow rate of centrifugal pumps. The average relative error between the predicted flow rate and the measured flow rate is less than 2%.
While the formal mentioned methods have made strides in normal sample sets, dynamic response analysis and condition prediction of DSC pumps often ignore the issue of probability differences in the samples collected during operational processes where there is a difference in the sample distribution between values that have been extensively labeled and others ignored, which can result in the oversight of unlabeled fault signals during the process. 23 In addressing this issue, research on Positive-Unlabeled Learning (PUL) has provided some novel insights. Positive-unlabeled learning (PUL) is a semi-supervised learning method, it is a variation of the typical binary classification learning method, which modifies the traditional binary classification of positive and negative samples into two categories: positive and unlabeled samples, and all samples inside unlabeled samples may belong to positive or negative samples.24,25 The application domains of PUL learning mainly include Time series analysis, mining, remote sensing, etc.26–28 In the field of industrial machinery status prediction, Qian et al. 29 proposed a method of PUHN network based on PU learning to solve the problem of SCADA sample deviation and incomplete labels of wind turbines through deep learning-based methods. Zheng and Zhao 30 proposed a three-step method based on deep learning for monitoring the industrial hydrocracking process. Building on prior research, Qian et al. 31 developed a Probability Ratio Least Squares Importance Fitting (PRL-SIF) method based on the assumption of complete randomness and variable homogeneity. This method was applied to a dataset from wind turbines.
Although the above research considered the bias in data samples and enhanced the accuracy of condition prediction methods, there remain two main issues. On one hand, research focusing on industrial condition prediction and fault diagnosis, particularly in the context of centrifugal pumps, remains limited in PUL based methods. On the other hand, the research primarily combines deep learning methods to implement PUL. Although methods based on deep learning have advantages in accuracy, there is a challenge related to the extensive data requirements and prolonged training duration, 32 establishing relatively accurate models with unbalanced and unrecognizable samples poses challenges.
In response to this problem, this paper proposed a probabilistic gap biased samples based condition prediction approach for desulfurization slurry circulating pumps. To address the issue of condition recognition, the expert experience was combined, and a classification model based on time-domain and frequency-domain features has been established as a preliminary model by correlating actual operational data sets with features. To stress the issue of the biased dataset, the probability gap between the real dataset and the recognized dataset was introduced to establish a probability boundary as bias in the bias-SVM method, and the threshold for bias was computed. This bias is then applied to the model for condition prediction. As a semi-supervised machine learning approach, this method employs PUL to classify the original sample set by identifying positive samples without explicit labels. Compared to unsupervised learning, this classification is more accurate, and it demands lower labeling requirements than supervised learning. Furthermore, for the problem of lacking reliability and prediction accuracy under unbalanced and unrecognizable samples, a corresponding machine learning model evaluation method is proposed. The results exhibit higher precision, thereby enhancing the reliability of the model.
The rest of the paper is organized as follows: Section “Analysis of the DSC pump working process” analyzed the working state and the necessity of applying the approach proposed in this paper, and Section “Probabilistic gap based condition prediction approach for DSC pump” was introduced to discuss the overall process and theoretical methods of DSC pump condition prediction strategies. Section “Validation and application analysis” demonstrated the main application processes and details of the approach. Chapter “Conclusion” provides a summary of this paper and offers prospects.
Analysis of the DSC pump working process
Process surroundings of the DSC pump
The main object of this article is the industrial DSC pump in the absorption tower. This is a typical horizontal centrifugal slurry pump with a large flow, head, and power. Due to the relatively harsh operating environment of DSC pumps and the difference compared to equipment like water pumps and air pumps, issues such as crankshaft and blade fractures, leading to imbalance, are more likely to occur. These problems result in persistent abnormal vibrations in DSC pumps, gradually intensifying over time, and lead to a decline in equipment efficiency ultimately, which renders the pump incapable of handling the task of transporting solutions. The specific parameters and locations are shown in Table 1 and Figure 1.
Basic parameters of DSC pump.


WFGD facilities and the location of the DSC pump.
Signal for DSC pump condition transition
Vibration signals are often used to monitor sudden or impactful faults in pumps. Within the fault, problems will cause certain fluctuations in the vibration signal. These issues not only result in a decrease in head, subsequently reducing the pump efficiency, but they also eventually lead to damage in critical components such as bearings due to unbalanced impellers. The imbalance problem will gradually become more severe as the rotating equipment operates until problems like impeller breakage or shaft occur. Therefore, vibration signals are crucial signals for identifying such types of faults.
Generally, the RMS value is a crucial indicator for determining whether a DCS pump exhibits abnormal vibrations. This is because, in both assembly and actual operation, most faults detectable through vibration signals are reflected in the amplitude of the RMS value. Moreover, such types of faults lack clear boundaries, making it impossible to detect them through common fault prediction methods during monitoring processes, but equipment conditions are still required, yet there remains demand for DSC pump condition prediction methods specified for unbalanced and incompletely recognized datasets. It is shown in Figure 2 below.
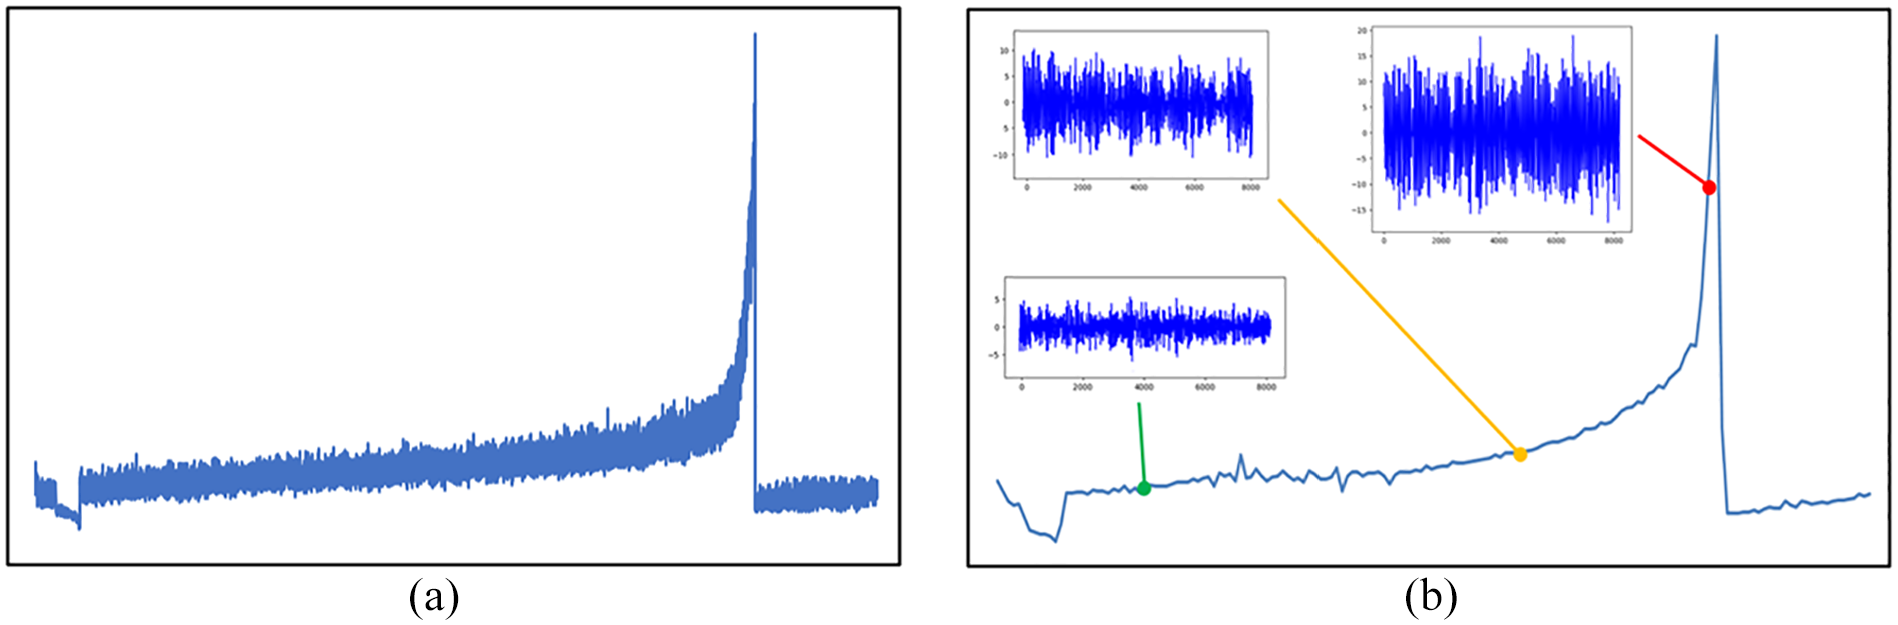
The degradation process of the DSC pump equipment is depicted: (a) represent the RMS amplitude is shown and (b) the RMS amplitude curve is fitted using least squares and plotted alongside the vibration signal amplitudes at different stages.
Feature extraction
As the pump works, vibration signals exhibit certain fluctuations, which can, to some extent, reflect the state information of the pump. Therefore, the signal of the DSC pump will be processed by time scale analysis methods like time domain and frequency domain. In the time domain, a total of 12 feature factors have been collected, including 6 normal parameters and 6 dimensionless parameters based on vibration speed. The signal’s spectrum reflects the frequency components, amplitudes or energies of each component, and their distribution. When rotating machinery experiences a fault, the amplitudes or energies of different frequency components in the vibration signal will change. Additionally, based on the analysis of FFT-transformed spectral data, this paper has gathered six relatively common frequency domain feature factors, forming a high-dimensional feature set with a total of 18 features. Shown as in Table 2:
Type of feature data in solid-liquid flow pump vibration signal.

This paper introduces the Spearman correlation coefficient to analyze the correlation between feature data. The correlation analysis is conducted on value features, with the magnitude of correlation positively correlated with the degree of correlation. From the graph, it can be observed that some time-domain features exhibit relatively high correlation, as do several frequency-domain features. This suggests that the relationships between time and frequency domain variables, as well as different parts of time and frequency domain features, are not significant. Each feature value has its focus on correlation and relatively high coupling, making it harsh to use single feature or multiple features from a single domain for status prediction. The results of the normality test for data features and the heatmap analysis are shown in Figure 3 below.

The heatmap analysis of the data features.
Probabilistic gap based condition prediction approach for DSC pump
In this paper, a machine learning algorithm based on the probabilistic gap dataset for fault prediction in DSC pumps was proposed. Firstly, health indicators capable of distinguishing between the health and failure status of the pump are chosen to categorize the dataset into faulty and normal segments. Secondly, a one-sided noise probability model is introduced to estimate the overall distribution and probability boundary of the sample set. Lastly, the bias is calculated using the probability boundary, and the biased Support Vector Machine (SVM) algorithm is introduced to reclassify and calculate the dataset. This process leads to the development of a model training output strategy customized for each dataset, ensuring continual updates in model training under each specific strategy.
The PGPU learning model
The diversity of equipment failure types presents a challenge, as each type of fault comes with unique features, making standardized representation difficult. Therefore, in addressing the issue of being unable to evaluate negative samples uniformly within Positive-Unlabeled Learning (PUL) for DSC, the variety of equipment failure types poses a challenge. However, under the condition of maintaining a constant rotational speed, the characterization of the normal operational state of rotating equipment is generally established. 13 From the above process, the true positive sample (TP) can be accurately determined. The true negative sample (TN) and false positive sample (FP) can be determined with a certain probability, while the false negative sample (FN) cannot be determined. Therefore, transforming the problem into a one-sided label noise model based on negative samples aligns with the assumptions of the PUL method.


The probabilistic gap


By Bayes theorem, the


Therefore, the relation of probabilistic gap

According to the PUL data, the observed probabilistic gap

As

Therefore, the sample set satisfying the requirements can be selected for training. The schematic diagram is depicted in Figure 4 below:
The classification method based on the observed dataset and the probabilistic gap.
The bias-SVM algorithm
SVM is a classical algorithm that calculates the required maximum-margin hyperplane by setting a kernel function. It is employed for binary and multi-class classification by separating data using the hyperplane. 33 Generally, the optimization criterion for SVM is to maximize the distance from the support vectors to the hyperplane as shown in the formula:
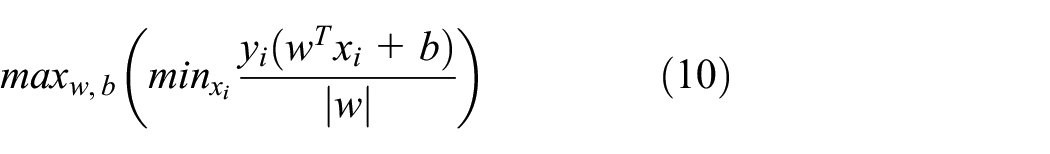
In this paper, a one-sided noise model based on positive samples is implemented by dividing the overall sample of the equipment fault diagnosis system. Therefore, the standard empirical risk needs to be modified by an importance re-weighting technique and an SVM classifier with bias needs to be trained based on this to meet the sample classification. For the biased SVM algorithm, there is a weight factor

In the formula,

The biased SVM based on the probabilistic gap boundary.
Overall process
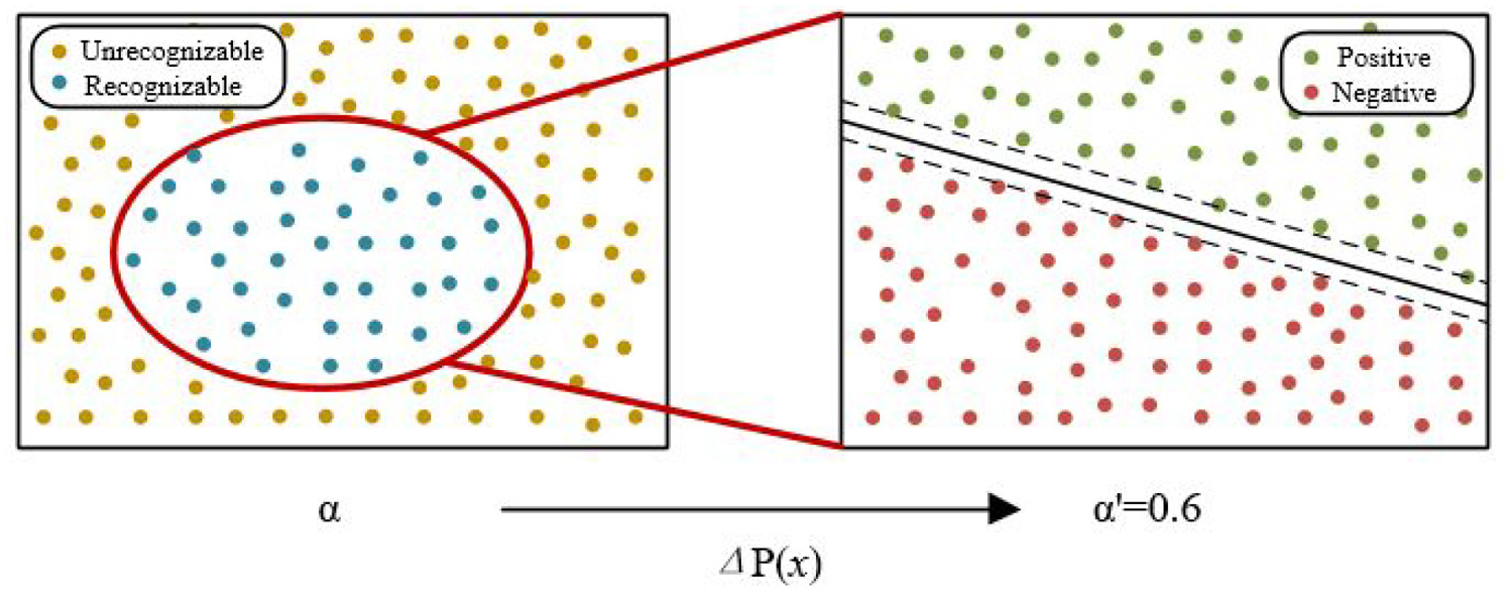
The dataset analysis begins by estimating the overall proportion of negative samples to the total samples as the prior probability for prediction, denoted as α. Next, the Bayesian optimal re-calibration method 26 is utilized to label and recalibrate the samples, calculating the actual prior probability, denoted as α′. Finally, the probability difference ΔP(x) between α and α′ is computed, and based on this indicator, the biased classifier using the SVM method is trained and tested. The whole process is depicted in Figure 6.

The overall process of condition prediction approach for the DSC pump.
Validation and application analysis
In this section, the proposed method has been effectively implemented and practically applied in the DSC pump condition monitoring system. The hardware used in this section includes a PC with an Intel(R) Xeon(R) Silver 4310 CPU @ 2.10GHz 3.30 GHz processor, XS1000 SCSI solid-state drive, NVIDIA RTX A2000 display adapter, and Windows 10 Professional as the operating system. The computational environment is supported by Python 3.8 and PyTorch 2.0. The detail of the sensor location was shown in Figure 7 below.
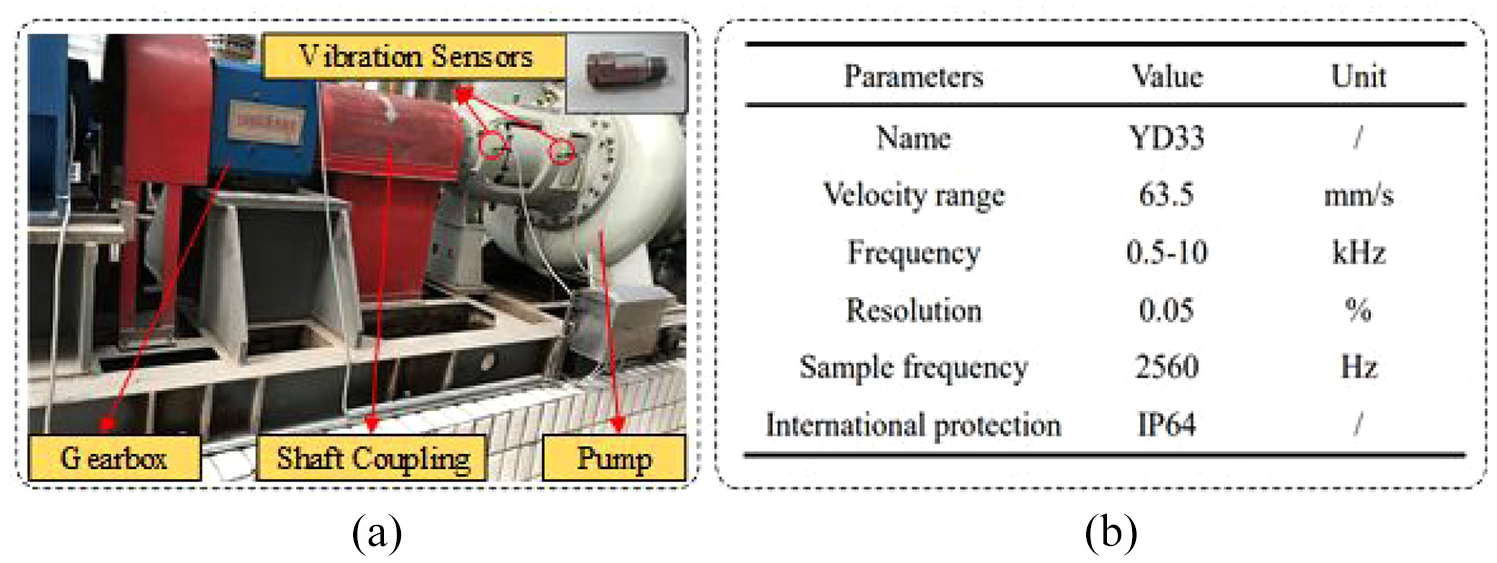
Location and basic information of the vibrations sensor: (a) is the location of vibrations sensor and (b) is the basic information about the sensor.
The data set used in this method is from the actual operation data of the DSC pump from Central China Power Company in Xiangyang, Hubei, China. To facilitate the prediction of pump operational information, vibration sensors are positioned near the pump unit. The raw data during the pump operation is acquired through real-time communication between the industrial control computer and the PLC (Programmable Logic Controller). Considering the storage space of the database, operational data is collected every 5 min and visualized, with the data being stored in the database every 30 min. The training set (B pump) consists of 10,996 samples, with 7617 positive samples, accounting for approximately 69.3%, and 3379 negative samples, accounting for approximately 30.7%. The test set (E pump) comprises 10,110 samples, with 6404 positive samples, representing approximately 63.3%, and 3705 negative samples, making up about 36.7%.
Method application
Although combining expert experience applied to fault diagnosis can capture abnormal vibration waveforms, these methods only consider single indicators or have certain limitations. Equipment condition monitoring and fault diagnosis result from the coupling of multiple features. Therefore, it is necessary to evaluate the health status of equipment comprehensively using multiple indicators. Based on all the extracted features and actual values, a Kolmogorov-Smirnov (K-S) test and Shapiro-Wilk (S-W) test are conducted to assess the normality of the data distribution between the features and positive samples. The result is shown in Table 3 below.
The normality test of features.

It is observed that the data distribution between the features and positive samples does not follow a normal distribution. Therefore, methods like principal component analysis cannot be used for dimensionality reduction. Instead, it is necessary to combine expert experience to form a preliminary model.
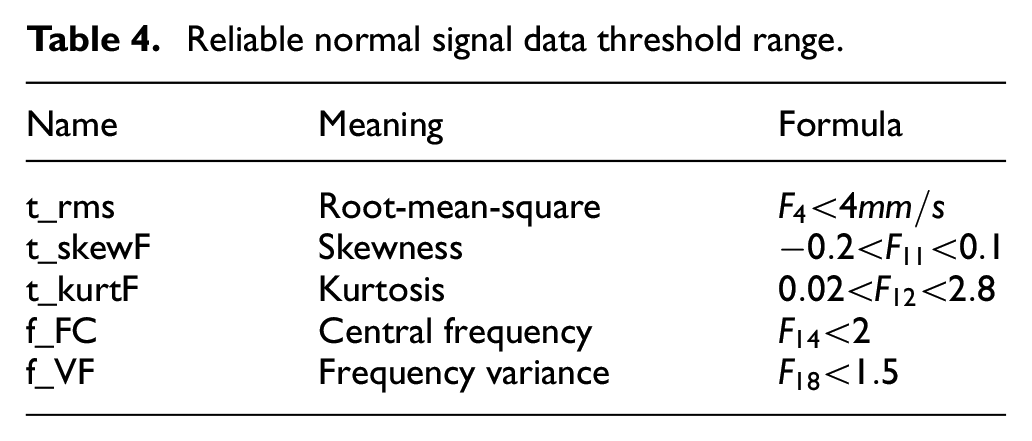
Therefore, while integrating expert experience applied to the fault diagnosis system can capture abnormal vibration waveforms, these methods have limitations as they consider only single indicators. Equipment condition prediction and fault diagnosis result from the coupling of multiple features. Thus, a comprehensive evaluation of equipment health requires considering multiple indicators from multiple domains. Combining the above analysis of features and overall trends, by analyzing the features related to the fault status of DSC pumps and considering commonly used indicators, all three overall trend correlation indicators mentioned above must be covered. Combining strong and weak sensitive features known for the equipment’s state and coupling the features, designing thresholds based on actual conditions, a preliminary classification model can be obtained, as shown in Table 4 below:
Reliable normal signal data threshold range.
Analysis and validation
In this chapter, a comparison will be made between the biased SVM method and relevant standards, as well as other machine learning methods, to validate the effectiveness and applicability of the proposed approach to such problems.
The kernel function is the key component in the SVM algorithm, which reflects on its performance. For the selection of SVM kernel functions, the method of cross-validation is employed. Commonly used kernel functions are chosen for mutual analysis to determine the separability of the dataset’s hyperplane. The average convergence time and average score are used as evaluation criteria, the results are as follows. It can be observed that the average score of the linear kernel function reaches 0.88, which is the best performance among all kernel functions. Its convergence time is 1.12 s, only slightly slower than the polynomial kernel function. Overall, the linear kernel function performs excellently within the dataset, indicating that the dataset itself is linearly separable. Shown in Figure 8 below:
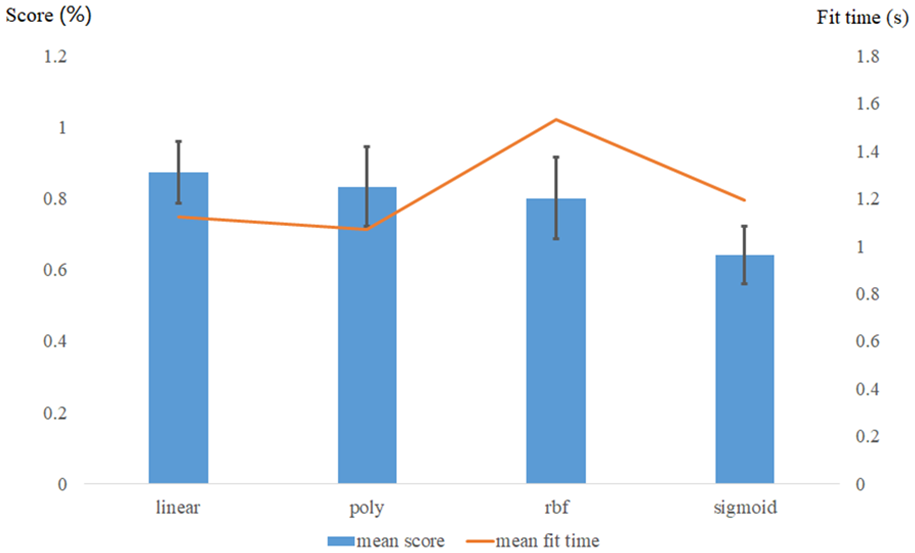
The cross-validation of kernel function for SVM and the dataset.
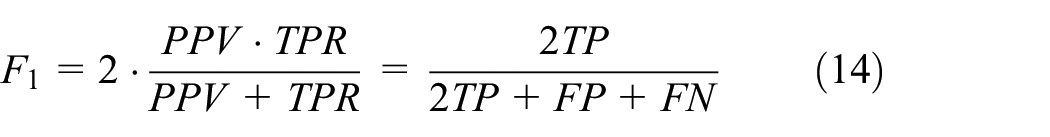
In this paper, the true positive rate (TPR), positive predictive value (PPV), and F1 as the indexes of the evaluation algorithm. The PPV index represents the proportion of correctly classified positive samples out of the total predicted positive samples. While PPV may take misclassified negative samples into account, it is essential to introduce the TPR index, representing the rate of positive samples correctly classified in the total positive samples. The F1 index was taken into consideration where the weight ratio of PPV and TPR in F1 is 1:1. It aims to find as many positive samples as possible while minimizing the misclassification of negative samples as positive.


In terms of the actual operational reliability of DSC pumps, they are generally categorized as horizontal centrifugal pumps and are subject to relevant standards and constraints. According to the measurement and evaluation methods standard for pump vibration in ISO 10816, the root mean square (RMS) value serves as the primary component for calculating pump vibration intensity. When the RMS value exceeds a certain threshold, the pump vibration is considered abnormal. The vibration intensity value can be calculated by dividing the root mean square value into several levels. Generally, the RMS value is a crucial indicator for determining whether a DSC pump exhibits abnormal vibrations. This is because, in both assembly and actual operation, most faults detectable through vibration signals are reflected in the amplitude of the RMS value. However, relying solely on the RMS value for judgment lacks consideration for comprehensive factors. More accurate equipment condition prediction methods typically involve manual identification and take into account various indicators such as time-domain and frequency-domain, resulting in more precise outcomes but at the cost of efficiency. The following table presents the vibration severity levels used to assess the operational status of centrifugal pumps. The method proposed in this paper fully complies with the vibration severity health criteria, with no classification positive samples exceeding the vibration severity level. As shown in Table 5 below:
Relationship between vibration level and pump status.

Tests on the mentioned methods using a test set that was manually monitored and labeled. This was done to assess the reliability of the PUL method, using F1 as the evaluation metric, and recording the respective training and testing times. The results are presented in Table 6 below, The boldfaced value shows the evaluation indicators of the proposed method:
Comparison of traditional identification methods and PGPU methods.

From Table 5, it is evident that in terms of the PPV metric, ANN achieves higher values than our proposed method, accounting for approximately 99.7% in the training set and 92.8% in the testing set. Concerning the TPR metric, in the training set, the bias-SVM algorithm proposed in this paper achieves the highest value at 96.4%, while in the testing set, the OC-SVM method reaches the highest value at 91.8%. However, overall, when considering the same sample conditions, the bias-SVM algorithm based on the PGPU hypothesis shows a more pronounced advantage in the comprehensive F1 metric compared to other methods. It achieves 94.3% in the training set and 89.9% in the testing set. Additionally, this method demonstrates relatively short processing times, with a runtime of 25.306 s for the training set and 21.255 s for the testing set. Despite the superior PPV metric of the ANN method, the bias-SVM method performs exceptionally well in terms of both runtime and overall evaluation metrics.
The following figure depicts partial data predicted by the method proposed in this paper. We have selected three types of plots representing the time domain, frequency domain, and amplitude probability density as the basis for actual fault diagnosis. From the perspective of amplitude probability density distribution, the waveforms and probability distributions of normal data are fairly uniform, while data indicating poor conditions exhibit uneven distributions. Compared to other analytical methods, the method proposed in this paper can further detect positive samples with similar characteristics. The result is shown in Figure 9 below.

The data is separated by the biased SVM algorithm. In (a), it comprises three components of the legend: signal amplitude probability density function, time-domain signal, and frequency-domain signal. (b) represents the normal data classified using the method proposed in this paper, while (c) depicts the data classified as indicating poor conditions.
Conclusion
To improve the accuracy of condition prediction methods in identifying status, this paper proposes a method based on PGPU assumptions and machine learning. In the process of algorithm implementation, this method utilized a PUL strategy based on the PGPU hypothesis, conducted prior probability analysis based on different sample sets, and added optimal estimation biases to the SVM method according to different prior probabilities. Additionally, by employing cross-validation to confirm the optimal kernel function, it achieved higher prediction accuracy.
To demonstrate the practicality of the proposed method, we combined the results with those of the ISO 10816-3 standard. We found that the method proposed in this paper fully complies with the standard regarding the relationship between equipment vibration status and faults. To further demonstrate the necessity of incorporating the PGPU hypothesis, experiments were conducted by comparing the proposed method with others using the same dataset. The results indicate that the biased SVM model based on the prior probability hypothesis outperforms other machine learning schemes, such as generalized linear models, SVM, ANN, and OC-SVM in overall performance. During the operational process of DSC pumps, the algorithm based on the PGPU hypothesis achieves an accuracy of 89.8% on the test set. This represents a significant improvement in the recognition and condition prediction of imbalanced class failure limit faults.
As similar methods are not widely used in practical applications and there is significant coupling among various relevant features in the field of vibration signal analysis, in future research, we will focus on exploring feature analysis methods. We will optimize the proposed algorithm from the perspective of feature extraction and identification to ensure that the final condition prediction results better meet practical needs and improve the accuracy of the model.
Footnotes
Handling Editor: Sharmili Pandian
Declaration of conflicting interests
The author(s) declared no potential conflicts of interest with respect to the research, authorship, and/or publication of this article.
Funding
The author(s) received no financial support for the research, authorship, and/or publication of this article.