
Abstract
Recent development in the predictive maintenance field has focused on incorporating artificial intelligence techniques in the monitoring and prognostics of machine health. The current predictive maintenance applications in manufacturing are now more dependent on data-driven Machine Learning algorithms requiring an intelligent and effective analysis of a large amount of historical and real-time data coming from multiple streams (sensors and computer systems) across multiple machines. Therefore, this article addresses issues of data pre-processing that have a significant impact on generalization performance of a Machine Learning algorithm. We present an intelligent approach using unsupervised Machine Learning techniques for data pre-processing and analysis in predictive maintenance to achieve qualified and structured data. We also demonstrate the applicability of the formulated approach by using an industrial case study in manufacturing. Data sets from the manufacturing industry are analyzed to identify data quality problems and detect interesting subsets for hidden information. With the approach formulated, it is possible to get the useful and diagnostic information in a systematic way about component/machine behavior as the basis for decision support and prognostic model development in predictive maintenance.
Keywords
Introduction
The prognostics and health management (PHM) of assets have been an important research area for several decades. Different types of maintenance strategies have been proposed and implemented for various types of assets for the PHM purpose. 1 As an effect of industrial digitalization, the maintenance field has been currently in such a renewal phase that manufacturing companies are shifting their focus on preventive maintenance strategy to higher emphasis on predictive maintenance (PdM) strategy as the core part of the Smart Maintenance concept. 2 PdM is the monitoring of an asset or system’s condition over its life cycle to provide a prognosis to when maintenance is required.3,4
Along with the advent of more advanced sensors, collecting data has become a simple exercise, and an asset’s life cycle data are composed of a lot of measurements that translate to tremendous amount of data. This has led to current PdM applications increasingly rely on data-driven Machine Learning (ML) algorithms. At this point, the question should be answered whether these devices or data provide the right information for the right purpose at the right time. For this reason, data should be processed in a systematic way for providing context, meaning, and insights that can be understood by users to make better decisions. 5
When implementing artificial intelligence (AI)/ML techniques in PdM, the dream scenario is to have data from multiple streams (sensors and other data systems) as inputs to the algorithms and digitalized historical maintenance records in order to train models utilizing known data for the healthy condition of the machine. In such a scenario, the models can be trained in a supervised manner and later used for prediction of future machine failures and even prescribe counter actions far in advance. However, healthy condition data is usually missing in industry, and the dimension is high due to multiple streams stemming from multiple machines. Hence, there is an inherent complexity in the analysis process itself. To overcome this shortcoming, a more manageable, scalable, and intelligent approach in PdM is needed in order to build novel predictive and prescriptive algorithms.
Within the focus of PdM, the main motivation of this article is to present an intelligent approach utilizing unsupervised ML techniques for data pre-processing and analysis which has critical impact in an ML workflow. Therefore, in this approach, principal components analysis (PCA), which provides computational efficient for feature dimensionality reduction and K-means clustering techniques, are used in order to get diagnostic information which can be used for labeling the data and supporting practitioners in PdM decision making. Moreover, the main contribution of the article is to demonstrate the feasibility of the formulated approach with an industrial case study and thus present a sequence of advanced analytical techniques which combines the knowledge from maintenance and the data science domains.
The rest of this article is organized as follows. The “Predictive maintenance” section starts with a review of ML-based PdM and summarizes the challenges of data pre-processing and analysis in PdM applications considering the features and quality of industrial big data. The “Methodology” section highlights the methodology and then describes the formulated approach for intelligent data pre-processing and analysis for PdM. In the “Case study: real-world industrial data” section, an industrial case study is demonstrated using the formulated approach in the “Methodology” section. The “Conclusion and future work” section presents the conclusions of the article and future research directions.
Predictive maintenance
Recently, PdM has gained increasing attention in the context of equipment maintenance systems and has been started to be adopted by many manufacturing companies in industry. In principle, PdM predicts faults or failures in a deteriorating system in order to optimize maintenance efforts by means of evaluating the state of the system mostly by means of historical data of the system in hand. 6 With the failure-free production in focus, PdM deals with both prognostics and diagnosis of an equipment’s condition. Information is provided about the questions such as “how is the equipment operating now?”“when will the equipment breakdown?”“what will be the primary faults that cause downtime?” and “why does the fault occur?” 7
Insights into future equipment performance and estimation of the time to failure will reduce the impacts of the many invisible issues and uncertainties (e.g. machine degradation, occurrence of failure events based on component level without any recognizable symptoms, unplanned breakdown of the systems), 8 and provide recommendations for the maintenance planning in manufacturing. 5 ML and data mining techniques can be used to get knowledge and insights from the data and accurately predict outcomes to support decision making and help companies improve their operations productivity. 9 There are various kinds of ML techniques to be applied in various phases of PdM implementation, that is, data processing, diagnostics, and prognostics, as given in the review studies done by Lee et al. 1 and Kim et al. 10 The next subsections explain some examples of recently proposed ML-based PdM applications and challenges and limitations of them in industrial big data environment.
ML in PdM domain
According to a comprehensive literature study recently proposed by Hoppenstedt et al., 11 academia has been showing a great interest in ML-based PdM applications with rapidly increasing journal and conference studies. It also could be seen from the following figure that there is an increasing trend with respect to the published documents in Scopus related to ML-based PdM applications (Figure 1). Literature shows that ML tools have been used for different methodological modules of PdM such as data acquisition and pre-processing, health indicators construction, (early) anomaly detection and localization, forecasting and prognostics of system/machine health state or potentially arising problems/downtrends (including remaining useful life prediction or fault prognostics), and corrective actions when undesired systems states are detected or predicted. 12
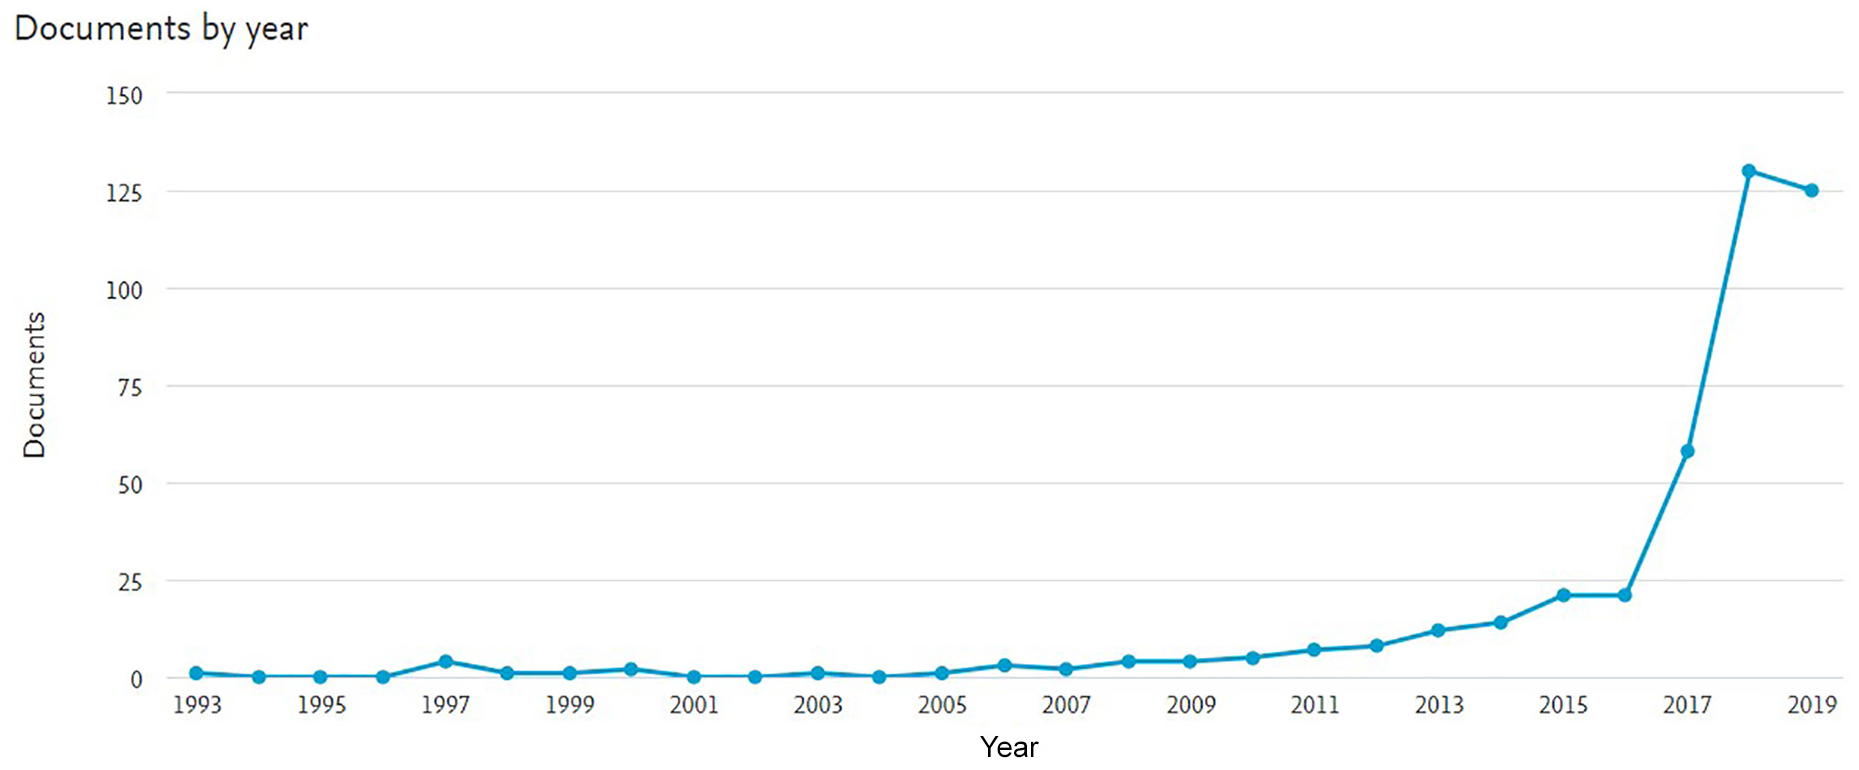
Published documents for ML-based PdM applications for the time period from 1993 to September 2019.
The ML approaches provide increasingly effective solutions in these different modules of PdM, facilitated by the growing capabilities of hardware, cloud-based solutions, and newly introduced state-of-the-art algorithms based on different learning methods, namely, supervised, unsupervised, semi-supervised, and reinforcement learning. 13 Although these algorithms are improving PdM capabilities, their success depends on the data form or structure used to train and test the algorithms.4,14 In this context, data pre-processing is the most critical step in order to make the data meaningful, usable, and desirable, driving the path from potential to real information for a robust ML-based PdM solution. 15 However, processing and analyzing industrial big data and turning it into valuable insights that can explain the uncertainties within manufacturing is a big challenge due to its high dimensionality along with variation in data sparsity and lack of correct labels. 4
Challenges of PdM data pre-processing and analysis
In this section, first, we address main challenges, characteristics, and quality issues of industrial big data, and second, we briefly explain the proposed data pre-processing and analysis strategies to overcome these challenges in PdM applications in the literature.
Features and quality issues of industrial big data
One of the big challenges of PdM is the need to deal with tremendous amount of heterogeneous data generated by advanced sensors and information technologies in manufacturing companies, the so-called industrial big data.9,16 The characteristics of industrial big data come down to the “5V”: volume, velocity, variety, veracity, value.17,18 Industrial big data are acquired from multisource such as equipment (machine and process data), product (product quality data), customer (customer features, feedback data, suggestions), and environment (weather information, indoor temperature, humidity, noises) with heterogeneous forms: (1) structured data, including sensors signals, controller data; (2) semi-structured data, such as information from a website or customer feedback information in XML format; (3) unstructured data, consisting of sound, image and video record, and so on, as shown in Figure 2.

Industrial big data acquisition based on structuring (adapted from Yan et al. 16 ).
Low-quality data cause wrong decision or inaccurate predictions, take more analysis time, and generate unclear information. 19 For improving the data analysis efficiency and quality, before big data applications processing, the incomplete, unsuitable, and abnormal data should be indeed identified, patched, and removed as given in Figure 3. However, it is not an easy task since industrial big data quality bring up the following challenges:10,17
Abundant data types and complex data structures due to the diversity of data sources,
Increasing the difficulty of data integration and aggregation,
Difficulties to asses data quality within a reasonable amount of time due to high dimensionality and very short timeliness period of data,
No unified and approved data quality standards,
Higher requirements for data processing technology.
With respect to PdM, even if a significant amount of machine and process data are available, one of the common problems of these data is the lack of correct labels describing the machine status or maintenance history. 20 For this reason, companies have limited options to analyze manufacturing data, despite the capability of advanced ML techniques in supporting the identification of failure symptoms in order to optimize scheduling of maintenance operations. 21 Moreover, each machine generates highly heterogeneous data, making it difficult to integrate all the information to provide data-driven decision support for PdM. Consequently, this is often not alone due to high dimensionality but due to an incredibly high domain complexity, which makes it necessary to combine intelligent methods to understand the data in the pre-processing and analysis phase of PdM.

Relationship between data structure and its quality (adapted from Taleb et al. 22 ).
Related work for industrial big data pre-processing
In any data-driven application in general, thus PdM in particular, pre-processing has primary significance in order to make data ready before training a model. Hence, data pre-processing are such a treatment process that includes some steps consisting of data cleaning (outlier detection and removal), data normalization (mean centering, standardization, and scaling), data transformation (statistical transformations and signal processing), missing values treatment, data engineering (feature selection, feature extraction, and discretization), and imbalance data treatment (oversampling, under sampling, and mixed sampling). 15
Data involved in each problem related to PdM have specific properties, and thus, different pre-processing strategies have been applied using supervised ML techniques (e.g. artificial neural networks, support vector machines, and deep learning) based on already defined data sets 9 (e.g. turbofan engine degradation CMAPPS data sets obtained from the NASA Prognostics Center of Excellence) 23 or real-world case studies. In most PdM cases, the pre-processing strategies of the industrial big data consist of data formatting, dimensionality reduction based on PCA and feature selection.24,25
Cluster analysis is one of the most commonly used unsupervised ML techniques within exploratory data analysis for hidden patterns identification. By identifying cluster structure in data and augmenting such structure with domain knowledge and Meta data, new information can be gained which can then further be used in a supervised setting or anomaly detection for the purpose of early detection/prediction of breakdown. Table 1 summarizes the recently proposed PdM studies using cluster analysis.
Some PdM studies using cluster analysis.

PCA: principal component analysis; DBSCAN: density-based spatial clustering of applications with noise.
According to the studies given in Table 1, clustering analysis provides high flexibility and effectiveness in PdM applications in terms of knowledge discovery by handling high-dimensional data without tags describing machine status and/or maintenance history. Therefore, in this article, we are aiming to use K-means clustering, which is one of the most common clustering algorithms in fault detection and fault class prediction in order to explore machine component knowledge using real-world data from a machining process.
Methodology
From data mining context, CRISP-DM is one of the well-known methodologies and a very useful process in many real-world applications, which provides detailed guidelines for data mining implementation consisting of six phases: Business understanding, data understanding, data preparation, modeling, evaluation, and deployment. 29
This process starts with the understanding of business needs and clearly tries to answer the question, “Which decisions can be made on the existing information and data streams.” In order to understand the decisions/purposes/industrial needs, we should look on the existing information and data streams. Hence, in the data understanding phase, the activities should be identifying data quality problems, discovering the first insights into the data, or detecting interesting subsets to form hypotheses for hidden information. The data preparation phase covers all activities to construct the final data set from the initial raw data. Data preparation tasks are likely to be performed multiple times, and not in any prescribed order. Tasks include table, record, and attribute selection as well as transformation and cleaning of data for modeling tools.
In the modeling phase, various modeling techniques are selected and applied, and their parameters are calibrated to optimal values. Some techniques have specific data requirements. Therefore, stepping back to the data preparation phase is often needed.
In the evaluation phase, you have built a model (or models) that appears to have high quality, from a data analysis perspective. Before proceeding to final deployment of the model, it is important to more thoroughly evaluate the model and review the steps executed to construct the model, to be certain it properly achieves the defined business objectives.
Finally, in deployment phase, after increasing the knowledge of the data, the knowledge gained will need to be organized and presented in a user-friendly way. 30
Formulated approach
In this study, CRISP-DM is performed as the methodology to guide the process of real-world industrial big data mining in PdM. An unsupervised ML-based pattern development approach for intelligent data pre-processing and analysis is used as shown in Figure 4.

The flow diagram of the formulated approach based on CRISP-DM methodology (adapted from Chapman et al. 30 ).
The formulated approach given in Figure 4 is carried out in an iterative manner. This is due to natural consequence of the formulated approach which is based on exploratory data analysis. After describing of the business objectives and used case, appropriate data sources are selected and pre-processed, that is, making design choices of how to handle missing data, data cleaning, feature selecting and scaling, and dimensionality reduction using PCA. Appropriate features and design choices regarding specific clustering algorithm (K-means) are also determined in the modeling phase. In the final phase, by using K-means clustering algorithm based on the pre-processed data of the selected features, data clusters are obtained which can give diagnostic information about the condition of the component/machine. In addition, it is also important to highlight that the knowledge from the maintenance domain-expert is incorporated for enabling the domain-expert to transfer knowledge and expertise to the data preparation, modeling, and evaluation phases in the formulated approach.
Case study: real-world industrial data
In this section, we use our formulated approach to pre-process and analyze of the real-world industrial big data for gaining useful information which helps us to implement a PdM strategy at the manufacturing company where the case study was performed.
Domain understanding: used case description
The case mainly considers the prediction of failures and their root causes of two bottleneck machines on an engine component line in one of the leading manufacturing companies located in Sweden. High-dimensional data are used and are coming from the following multi-sources:
Newly installed sensor system,
Control system (machine programmable logic controllers (PLCs)),
Production monitoring system,
Maintenance system.
In order to get clear needs, domain experts jointly decided that the prioritized sub-goal should be “Analysis of spindles behaviors for two bottleneck machines using machine-motor data from the machine PLCs.”
Data understanding
Data acquisition and storage
The industrial big data coming from sensors and control system are collected and converted to understandable structures by agents and stored in a database. In this database, we have four SQL tables, including “Process_Data” and “Vibration_Data” from sensors and the machine-motor data regarding with “Machine_1” and “Machine_2” from the control systems. Table 2 gives the general information about the tables in database.
General information of about the data in database.

In addition to these tables in the database, we have some data coming from production monitoring system which is a type of manufacturing execution system (MES). It provides information in order to help manufacturing decision makers to understand how current conditions on the plant floor can be optimized for improving production output. It is also used to create work order files for maintenance history from a computerized maintenance management system (CMMS). It should be noted that there is no connection between these different data sources, and hence, the time synchronization within them is one of the big challenges in the data preparation.
Data description
In the SQL table of Process_Data, we have data measured by different sensors located at various locations of the two machines. The sensors are measuring parameters such as temperature, pressure, flow, flow rate, angle X, and angle Y. Data are collected continuously at each 10-s interval for more than 1 year.
In the SQL table of Vibration_Data, we have vibration measurements such as A_effective, V_effective, Shock, and EffectiveValue_v measured by different sensors located on the spindle, spindle motor, gearbox, and fixture of the machines. Data are collected continuously at each 1-s interval for more than 1 year.
In the SQL tables of Machine_1 and Machine_2, there are machine-motor data taken from the control systems concerning features such as power consumption, torque drive, motor temperature, and drive_acctdiff. Furthermore, these tables include event time, vibration_start_stop, and block type values that are used for synchronization and pre-processing purposes only.
Data exploration
Data exploration is performed with the purpose of gaining first insights and exploring relationships among different measurements defined in the data description section. Figure 5 shows some samples data from the SQL table of Machine_1. Data are plotted by using visualization library “matplotlib” in Python.

A sample data from the SQL table of Machine_1.
Through the visualization of the machine-motor data sets of Machine_1 and Machine_2 shown in Figure 5 and Figure 6, respectively, we can observe that the Torque measurements of both machines have a smooth trend but they access some peak points in which they can indicate anomalies before a disturbance takes place. Motor temperature measurements also show similar trend in both machines. In summer months, they show a particular increasing trend due to the seasonal weather change. We can also see from the figures that the measurements of drive_acctdiff are not timely varying and have constant outputs. Therefore, they do not provide valuable information for proceeding to the next steps and they are needed to be removed in the data preparation section. Consequently, the visualization of the data using different plots, analysis of them by means of descriptive statistics, and identification of first patterns in the data are performed to get information about data quality based on some quality dimensions defined as the following section.

A sample data from the SQL table of Machine_2.
Data quality
Data quality is not easy to describe, its meanings are data domain dependent and context-aware. Mainly, data quality is continuously related to the quality of data sources. 22 Research suggests that data quality comprised several dimensions. 31 However, not all dimensions and metrics are applicable to all data sets and analytics problems. 32
In order to perform further quality assessment of the data coming from multi-sources, we select relevant subset of the data quality dimensions. This is based on the industrial perspective that considers the capability of the data to satisfy stated and implied industrial needs when used under aiming of PdM concept.
Table 3 explains the data quality problems and their descriptions based on the relevant data quality dimension in multiple data sources in the current case. Based on the evaluation given in Table 3, we can summarize some points related to the quality of data as follows:
Evaluation of data quality in multiple data sources.

1 = Process_Data, 2 = Vibriation_Data, 3 = Machine_1, and 4 = Machine_2, √= Observed, X = Not observed.
All data in all sources are available and updated,
Very high accessibility for each data source,
High relevancy for the tasks related to business objectives,
Time synchronization problem within these multiple data sources,
Missing dates, null values, and wrong timestamps in particular in the data from Machine_1 and Machine_2,
Too much noisy in the data from Machine_1 and Machine_2,
Different units within same data source.
Data preparation
For analysis of vibration measurements of the spindles (see “Domain understanding: used case description” section), first, the machine-motor data taken from the control systems are needed to be cleaned and scaled according to the first insights obtained from data understanding phase. Scaling of the data is an important consideration when preparing the data for clustering process. It also eliminates the bias in the algorithm toward the larger observations in the features.
After cleaning out invalid data values, the remaining data are normalized using z-score which is well known as a feature scaling method. It measures the distance of a data point from the mean in terms of the standard deviation. The standardized data set has mean 0 and standard deviation 1, and retains the shape properties of the original data set (same skewness and kurtosis). 33 Twenty raw features as described in the data description part are extracted, and then those features are normalized for the next step given in the following section.
Dimensionality reduction using PCA
One of the most well-known algorithms used for dimensionality reduction is PCA which decreases the dimensionality of data and keeps most of the variation (information) in the data set. 34 In a similar manner, it is a mathematical algorithm to find patterns in the data and to identify similarities and differences. 13
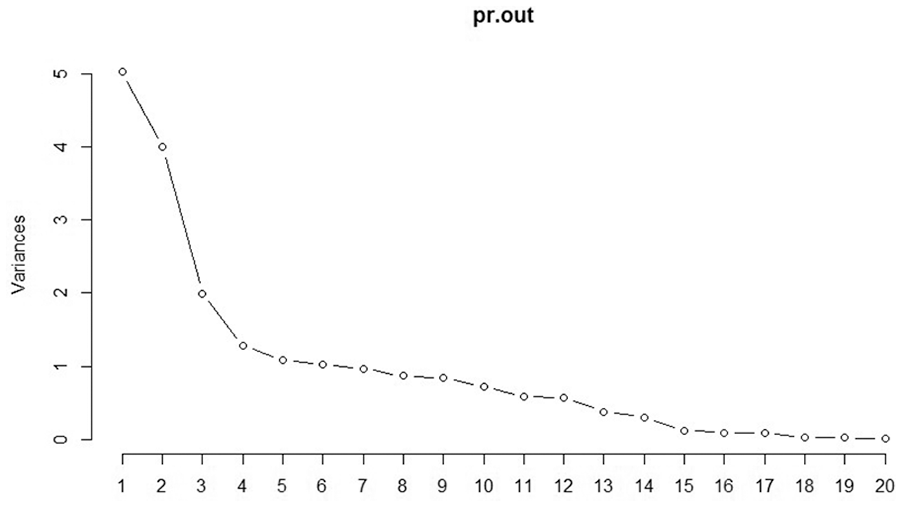
In this part, PCA algorithm is applied to the normalized machine-motor data using R software (Version 3.5.0) and its libraries such as factorextra, FactoMineR, and ggplot2. In this algorithm, the data are linearly mapped into lower dimension space to maximize the variance of the data. Here, the covariance matrix for the data is constructed, and the eigenvectors and eigenvalues of the covariance matrix are calculated. Afterward, feasible components are selected by using existing several standard methods. It should be noted that none of them are based on a statistical test but instead they are “rules of thumb” for selecting the number of principal components to retain in an analysis of this type. 35 One of the rules is based on the cumulative percentage, that is, retain the components which capture, say, 70% or 90% of the variation. Similarly, the scree plot and log scree plot are based on looking for a change in behavior in the log or plot of the variance. 35 Therefore, in this study, the principle components (PC) were selected by using a combination of the cumulative percentage method and a scree plot for eigenvalues. Figure 7 and Figure 8 show scree plots of PCA for Machine_1 and Machine_2, respectively.

Scree plot of PCA and for Machine_1.
Scree plot of PCA and for Machine_2.
As with the scree plot, we determined where the cut off should be by considering the cumulative percentage greater than 85% as generally suggested in the literature. At this time, we looked for the point at which the decay becomes linear. We selected the first 13 PC for Machine_1 which explain more than 87% of the variation in the data to retain in clustering analysis.
In addition, we can conclude that first nine PC explain more than 85% variation in the data, and they were selected to retain in clustering analysis for Machine_2. Consequently, we have simplified the complex data set of machine-motor data into a lower dimensional space. Twenty raw feature data set are scaled down to thirteen and nine feature datasets for Machine_1 and Machine_2, respectively. After having reduced the number of parameters, we continue working with how to find patterns in the remaining data sets using clustering analysis given in the next section.
Unsupervised learning: application of K-means clustering
In order to explore spindle behavior patterns for Machine_1 and Machine_2, the authors suggested that it can be best modeled as unsupervised ML problem, particularly, clustering problem. In its basic form, it is defined as a process that groups the similar objects that have not been classified or labeled before in order to gain insights into data and identify the degree of similarity among them. There are different clustering algorithms that can be categorized into two main groups such as hierarchical (starts with each data point in own cluster and merge the most similar pair of clusters successively to form a cluster hierarchy) and partitional (starts with all the data points in one cluster and recursively divides each clusters into smaller ones). 36 The most widely used partitional clustering algorithm is K-means due to some advantages such as ease of implementation, simplicity, efficiency, flexibility, and empirical success. Thereafter, we performed K-means clustering in which data are partitioned into natural groups called clusters to be able to gain the first insights about the spindle behavior patterns in different conditions such as normal, alarm, and between these two conditions (warning), which might show the relation to physically interpretable information about the spindles of the machines.
The prepared data sets after applying PCA for Machine_1 and Machine_2 are fed into the K-means clustering algorithm using R software (Version 3.5.0) and its libraries such as cluster, RColorBrewer, and scales. This algorithm divides a set of N d-dimensional instances into k clusters by minimizing the squared distances (Euclidian distance metric) between the mean of the cluster (centroid) and within cluster points. 36 It starts with a selection of k initial centroids and then assigns the closest instances to each cluster by updating of the cluster centroids in every iteration. If there is no change (i.e. convergence) in the centroid values, it is terminated. 28 The pseudo code summarizing main steps of K-means algorithm is listed as follows:

The selection of an optimal number of clusters is dependent heavily on the objective of clustering and maintenance management practices in this study. Thus, the number of clusters should be defined based on the practitioners’ requirements and expertise by evaluating the usefulness of producing k clusters to better classify the different measurements such as torque, power consumption, and temperature related to the spindle performance. So, when we were deciding the number of cluster, we used again the simplest method which looks at the within groups sum of squares and picks the “elbow” in the plot, similar to as with the scree plot we did for the PCA previously. Then, we perform K-means clustering function with k = 3, and data points are scattered in terms of cluster label assignment. The results are reported in Table 4 and are demonstrated in the following figures.
Number of instances in each cluster for each machine.
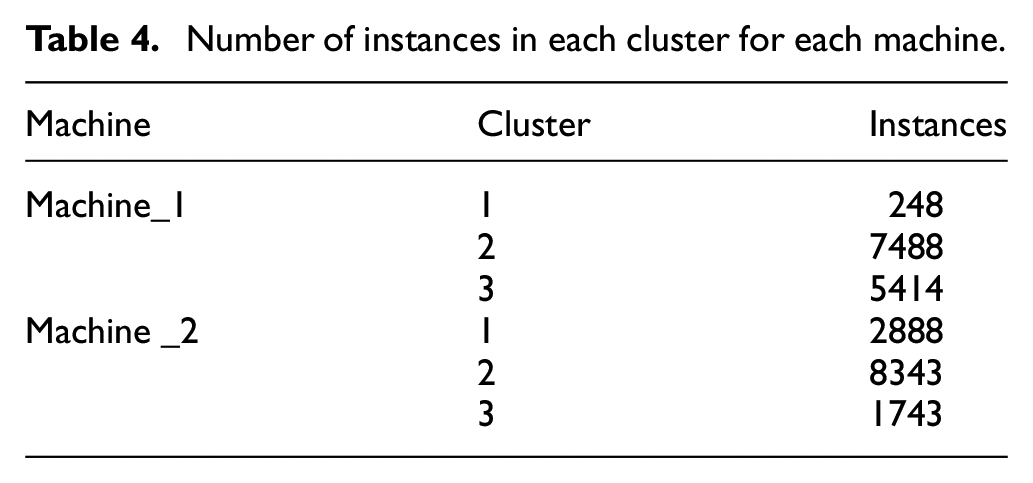
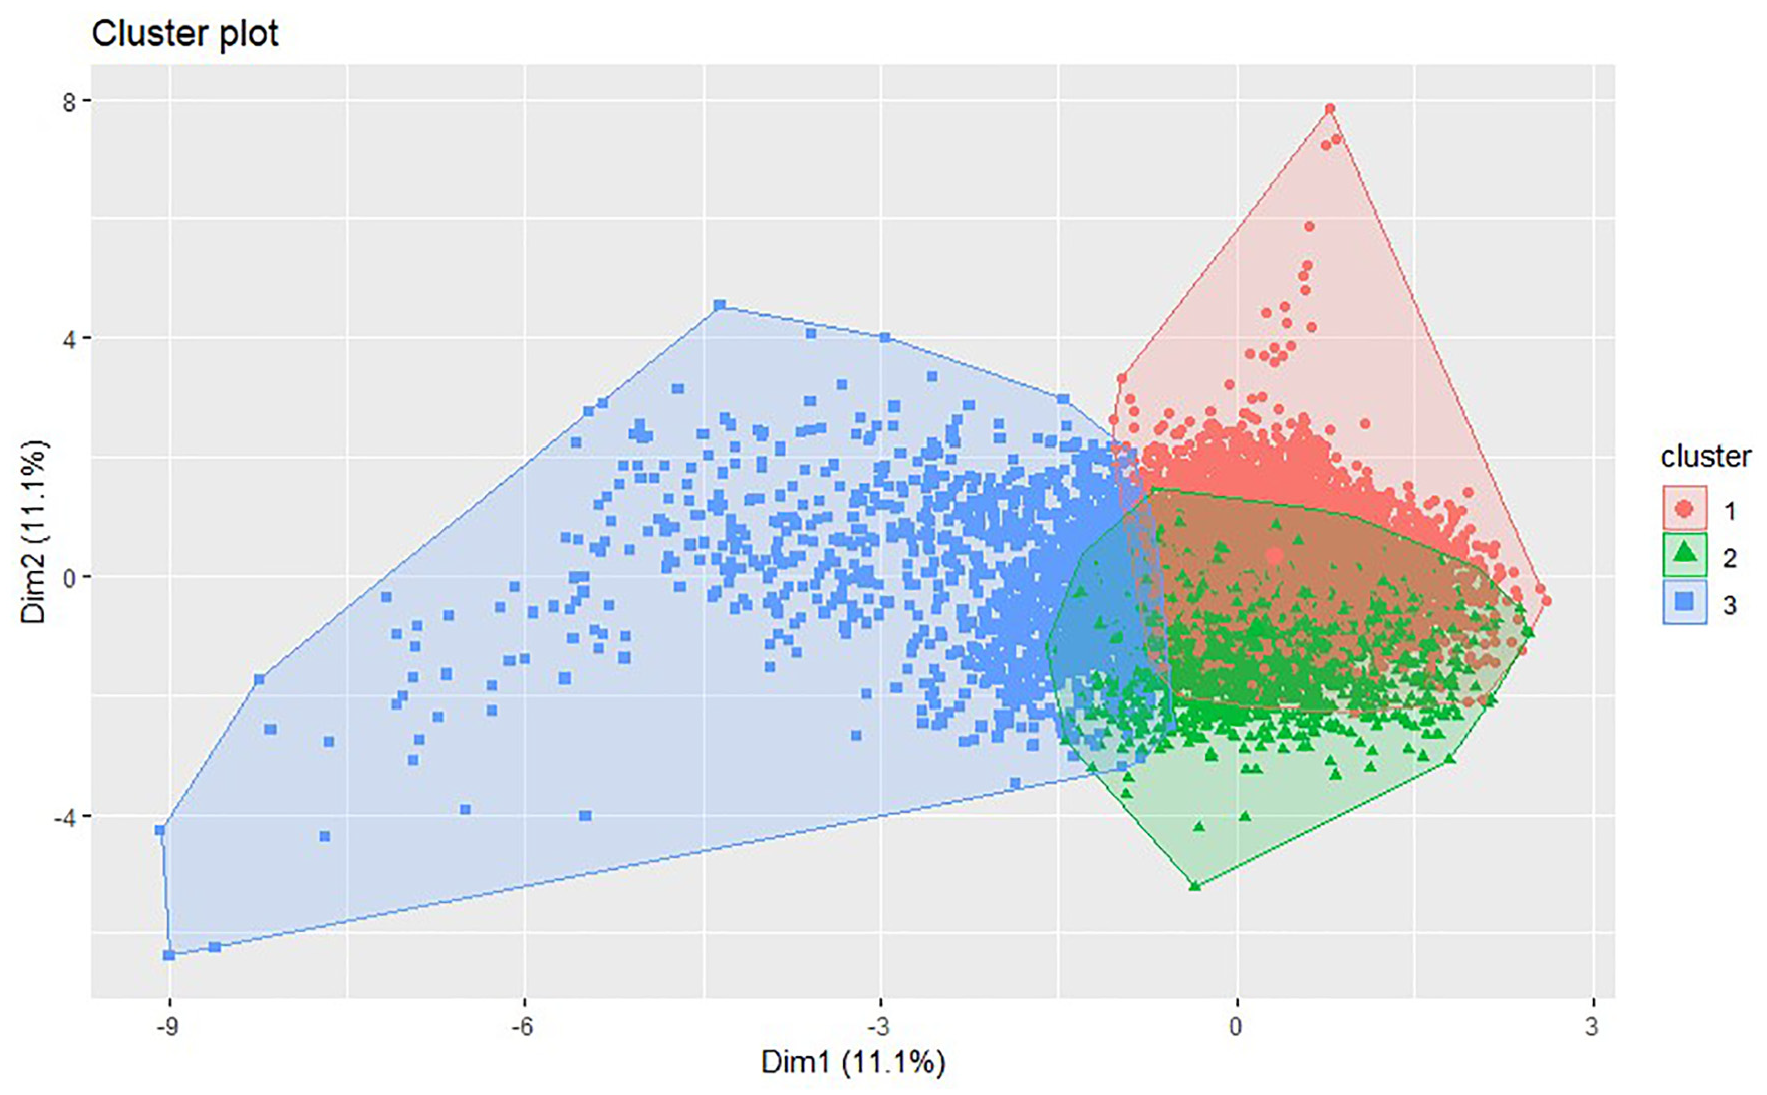
Figure 9 shows that 2-dimensional K-means clustering results. The results indicate that there are inliers within the data set which are seen in low frequency and they may indicate a problem for the health of Machine_1 as given in Table 4 (e.g. 248 instances in cluster 1 for Machine_1). In some of those instances, we can observe that the torque measurement deviates from normal range and achieves the peak value. Therefore, the spindle of Machine_1 may not work within the normal range.

K-means clustering results based on PC for Machine_1.
It can be also observed from Figure 10 that there are many inliers needs to be analyzed for Machine_2. These are instances whose count of occurrence is small in the given population of values as given in Table 4 (e.g. 1743 instances in cluster 3 for Machine_2) and may indicate a problem for the health of Machine_2. Those instances in cluster 3 can give diagnostic information about the spindle performance. Therefore, they should be augmented with domain expertise and other contextual information coming from different data sources (e.g. MES, CMMS) to be able to find the root causes. However, it should be noted that the results are sensitive to the clustering method used and hence here we need to incorporate domain-expert knowledge for more understanding of the spindle behavior for both machines.
K-means clustering results based on PC for Machine_2.
Conclusion and future work
In this article, an intelligent approach for data pre-processing and analysis in PdM is demonstrated using an industrial case study. We present our findings from the preliminary analysis of a real-world industrial data collection obtained from an ongoing research project. Based on the formulated intelligent approach, we described the data and insights gained from exploring the data; the analysis resulted in dimension reduction of feature space and also clustering of data points for understanding of the outliers in anomaly clusters by incorporating maintenance domain knowledge. These knowledge discovery methods using unsupervised ML should be the first step within PdM implementations. The advantage of the formulated approach is that it provides a structured way to collect, analyze, describe, visualize, prepare, and understand high-dimensional real-world industrial big data. The demonstration shown in this study also contributes to the transformation of the domain-expert knowledge to the ML workflow in particular data preparation phase. In this context, this study is more relevant to the developing solutions for real-world industrial problems and thus can increase the usage of ML in the manufacturing industries. As for future work, the current work will be extended by analyzing different measurements coming from the other data sources in particular sensors. This would help in determining the correlation between these different measurements and production monitoring and/or maintenance systems. Moreover, the formulated approach will be implemented and validated on not only this industrial case study but also other smart maintenance case studies within work package of the project in order to demonstrate its capacity and potential to support maintenance engineers and machine operators.
Footnotes
Acknowledgements
The authors would like to thank Anders Ramström and Robert Bergkvist who supported with the real-time data from a real-world production system. Thanks also to Mukund Subramaniyan for his valuable input and support. This research has been conducted within the Sustainable Production Initiative and Production Area of Advance at Chalmers University of Technology.
Handling Editor: James Baldwin
Declaration of conflicting interests
The author(s) declared no potential conflicts of interest with respect to the research, authorship, and/or publication of this article.
Funding
The author(s) disclosed receipt of the following financial support for the research, authorship, and/or publication of this article: The authors would like to thank Production 2030 Strategic Innovation Program funded by VINNOVA for their funding of the research project SUMMIT—SUstainability, sMart Maintenance factory design Testbed (Grant No. 2017-04773), under which this research has been conducted.