
Abstract
This paper addresses critical challenges in Unmanned Aerial Vehicle (UAV) target detection and 3D positioning, specifically inaccuracies in localization and lack of robustness in complex environments. The objective of this research is to improve UAV detection and positioning accuracy by proposing an enhanced Deformable DETR (Detection Transformer) model integrated with multi-view geometry theory. To achieve this, the study first preprocesses UAV-collected data, then optimizes the convolutional layers of the original DETR model to better handle object occlusion and scale variations. Furthermore, the research incorporates multi-view geometric modeling and multimodal fusion strategies to enhance detection accuracy during the target recognition process. Experimental results demonstrate that the proposed approach achieves over 70% detection accuracy, significantly outperforming traditional methods. The findings underscore the effectiveness of combining the improved Deformable DETR model with multi-view geometry for high-precision detection and 3D localization in complex environments. This research has significant implications for UAV-based applications, such as autonomous navigation, surveillance, and search-and-rescue missions, where precise target detection and 3D positioning are critical for successful operation.
Keywords
Introduction
UAV (Unmanned Aerial Vehicle) object detection and 3D positioning are critical fields within computer vision.1,2 With the rapid advancement of both object detection and UAV technologies, UAV object detection algorithms have gained widespread application across various domains.3,4 However, detecting objects in aerial views captured by UAVs presents significant challenges. These include the high density and distribution of small objects, substantial variations in object scales, and the complex, dynamic environments depicted in multiple UAV aerial images. Consequently, adapting object detection algorithms designed for ground-level or frontal perspectives to UAV aerial views proves challenging.5,6
In object detection, numerous models have emerged with the goal of enhancing precision while maintaining computational efficiency. Some notable examples include EfficientDet, which is based on the EfficientNet design philosophy and realizes efficient object detection.7,8 Another model, DETR (Detection Transformer), transforms object detection problems into sequence-to-sequence tasks, leveraging a Transformer structure for end-to-end detection and positioning.9,10 FCOS (Fully Convolutional One-Stage) is a simple and efficient single-stage object detection method that is based on fully convolutional networks.11,12 RepPoints (Representative Points) achieves object detection and positioning through point regression and exhibits strong robustness.13,14 CenterNet, on the other hand, achieves object detection through center point prediction.15,16 For specific applications, such as vehicle object recognition under weak lighting and harsh weather conditions, Wang et al. proposed RODNet (Radar Object Detection Network), which achieves an average accuracy of 86%. 17 In the realm of very-high-resolution (VHR) remote sensing images, Gong et al. proposed the CA-CNN (Context-Aware Convolutional Neural Network) model to mine underlying contextual information between objects. 18 Despite the progress made by these models, they are still limited by their single perspective, which makes it difficult to fully utilize the multiple view geometry information of the scenario. Additionally, they may suffer from performance degradation in complex scenarios.19,20 Therefore, while some advancements have been made, existing models still have limitations and require further improvement to fully address the challenges of object detection.
Object detection based on multiple view geometry has demonstrated significant potential to enhance the accuracy of object detection and positioning by amalgamating information from diverse perspectives. In a study conducted on a small sample dataset, Xiao et al. 21 applied a straightforward category-agnostic viewpoint estimation method, integrating information from different viewpoints. This approach surpassed the performance of established models such as PASCAL (Pattern Analysis, Statistical Modelling and Computational Learning) and COCO (Common Objects in Context). Considering multiple view geometry, Zheng et al. 22 proposed the CIoU (Complete-Intersection over Union) loss and Cluster-NMS (Nonmaximum Suppression), which notably improved the average accuracy and recall of detection. The DETR model, recognized for its efficiency, amalgamates multiple advanced technologies, including decoder,23,24 encoder,25,26 and feedforward neural networks.27,28 It maintains high accuracy while offering rapid inference speed, making it suitable for object detection tasks in complex scenarios. 29 Despite the progress made by existing methods, their performance deteriorates when confronted with large-scale scenarios and often exhibits poor results in the presence of complex occlusions. Consequently, researchers are endeavoring to refine existing models and augment their robustness in object detection. Jiang et al. 30 refined the Deformable DETR model by integrating the dynamic attention mechanism and multi-scale feature fusion technology, catering to the requirements of vehicle detection in UAV video streams. Multi-level feature extraction is performed on vehicle targets to bolster the detection capability of small and fast-moving targets. Cui et al. 31 optimized the feature extraction network of the Deformable DETR model and introduced adaptive light correction and color enhancement techniques to mitigate the challenges posed by light variation and color distortion in underwater images. The refined model exhibited commendable performance in complex underwater environments and low visibility conditions. Zhang et al. 32 designed a novel attention module and boundary box regression mechanism by enhancing the Deformable DETR model, enabling it to process text of arbitrary shape in natural scenes and achieve high-precision detection. Hamid et al. 33 conducted a survey on stereo matching algorithms based on deep learning and found that these algorithms have achieved remarkable progress. Based on the aforementioned research, the Deformable DETR model is deemed suitable for enhancing the robustness of object detection. Integrating this model with multiple view geometry information holds promise for precise object detection and positioning by UAVs.
To sum up, in order to improve the object detection and 3D positioning performance of UAV, this paper first used UAV to collect data, and then used denoising and other means for pre-processing. Then, the convolutional layer was refined in view of the shortcomings of the original Deformable DETR model. At the same time, 3D positioning was improved by combining multiple view geometry. The data obtained from the above operations continued to be fused to achieve more accurate 3D positioning with the help of data fusion features. The experimental results showed that the method used in this paper could improve the accuracy of 3D positioning and detection of UAVs in complex environment.
Data preprocessing
In the first step of data processing, the image data collected from different UAV perspectives is converted into a common reference frame, and the parallax between the two views is calculated using the stereo matching algorithm, thereby deriving the position of the points in the three-dimensional space. The calculation formula is:

In the case of variable lighting conditions, multiple Gaussian filters of different scales are used to estimate the illumination, and then the results are weighted to average:

In order to enhance image contrast and detail, histogram equalization is first used to adjust the image globally, and the gray level of the image is redistributed to expand the dynamic range of the image. The adjustment process is as follows:

Then, adaptive histogram equalization is used to adjust the local area, the number of pixels in the histogram exceeding a certain threshold is clipped, and the clipped part is evenly distributed to all gray levels. The formula is as follows:

To adapt to the challenges of object detection and positioning in complex environments, special labeling operations can continue to be applied to images captured by UAVs. Using a strategy of combining manual labeling with automated labeling, specific object types and positional details are marked in the captured images. These clearly labeled data are used as guidance for training the model, helping the model to deeply understand the characteristics and positions of the object entity, thereby achieving accurate object detection and 3D positioning effects.
Deformable DETR model optimization
The optimization of Deformable DETR model requires increasing the depth and width of convolutional layers on the original basis, and applying residual connections to accelerate information transmission speed. 34
Increasing the depth of convolutional layers mainly involves deepening the number of convolutional layers in the model architecture, thereby improving the model’s ability to extract image features. Increasing the width of the convolutional layer mainly includes increasing the number of channels in the model architecture, making the dimensions of information processing more diverse.
Applying residual connections not only benefits the efficient flow of information in deep networks, but also allows signals to directly cross several layers, reducing the problem of vanishing and exploding gradients, significantly improving training speed and generalization performance.
Through the above operations, while retaining the high-speed detection characteristics of Deformable DETR, its accuracy and adaptability can be improved, thereby meeting the requirements of higher-level computer vision tasks.
In addition, to ensure the accuracy of object positioning and confidence, a new loss function is further designed, with the following formula:

The definition of the loss function formula is shown in Table 1.
Definition of loss function formula.

The optimized Deformable DETR model is used to perform object detection on a randomly obtained image, requiring the recognition of the yellow building in the image. The specific effect is shown in Figure 1.

Optimized model detection effect.
According to the recognition task, the original image in Figure 1 has a total of two detection points. It is evident that the optimized Deformable DETR model accurately completes the recognition task.
Multiple view geometry modeling
The multiple view geometry modeling method can accurately capture the three-dimensional structure and morphological characteristics of target objects through multi angle and camera techniques. 35 By observing the target object from various perspectives and combining data information collected from multiple perspectives, it helps to gain a deeper understanding of the detailed characteristics and morphology of the target object, thereby achieving more accurate construction and reconstruction of the 3D model.
The selected 5 R series UAVs have built-in cameras, and the object position expression under each camera is:

Observing the same object from different perspectives, it is found that the projection coordinates of the object on the camera’s image plane are:
Among them,
Next, the triangulation method is used to convert the projection coordinates of objects from the five camera perspectives of the R series, and is uniformly replaced with normalized plane coordinates. Then, the three-dimensional coordinates of the object in the camera coordinate system are calculated based on the normalized plane coordinates and
To comply with multiple view geometry optimization, the objective function is used to optimize the calculated 3D coordinates:

Finally, the three-dimensional coordinates are converted into coordinates in a unified coordinate system to obtain the accurate position of the object in three-dimensional space.
Multimodal fusion
LiDAR is an active sensor that obtains high-precision 3D point cloud data to model the environment in 3D and extract object information from it. By optimizing the collection of object detection information and using the K-means clustering algorithm based on Euclidean distance, the LiDAR point cloud is segmented into different clusters, each representing an object. Through segmentation and clustering, the target objects in the point cloud are extracted, and their position and shape features are calculated.
The image object data obtained through the improved Deformable DETR model is fused with the data obtained from LiDAR, and the fusion steps are shown in Figure 2.

Data fusion steps.
In Figure 2, by extracting features from the obtained data, image features and point cloud features are obtained respectively. In order to make these two features related and correspond to each other, optical flow method is first used for alignment and matching, followed by direct fusion to generate multimodal features. Based on multimodal feature representation, the motion state of the object is estimated and predicted, achieving precise 3D positioning and tracking.
Experimental verification
In order to verify the effectiveness of multiple UAV object detection and 3D positioning based on the improved Deformable DETR model and multiple view geometry, comparative experiments are conducted with multiple UAV object detection and 3D positioning based on the improved YOLOv4 model, the DETR model, and the multiple view geometry. The experiment mainly revolves around three randomly selected scenarios (as shown in Figure 3) for detection and positioning operations.

Comparative experimental scenarios.
In Figure 3, the images are named Scenario 1, Scenario 2, and Scenario 3 in order from left to right.
In this paper, R1 represents the improved YOLOv4 model, R2 denotes the DETR model, R3 signifies the utilization of multiple view geometry, and R4 corresponds to the integrated approach encompassing multiple UAV object detection, 3D positioning, leveraging the techniques including the improved Deformable DETR model and multiple view geometry.
One of the performance indicators for evaluating object detection in R1, R2, R3, and R4 is confidence. In object detection tasks, each detection box is accompanied by a confidence score, which is used to indicate whether the detection box contains objects and the model’s level of confidence in this judgment. Among them, the optimal distribution interval for the confidence level of object detection is (0.6, 1). The closer the confidence level is to 1, the higher the confidence level of the detection result.
Firstly, R1, R2, R3, and R4 are utilized to detect Scenario 1. In general, the higher the number of detections, the better it is, and the smaller the number of misdetections, the better it is. Among them, the object detection of Scenario 1 by R1 is shown in Figure 4.
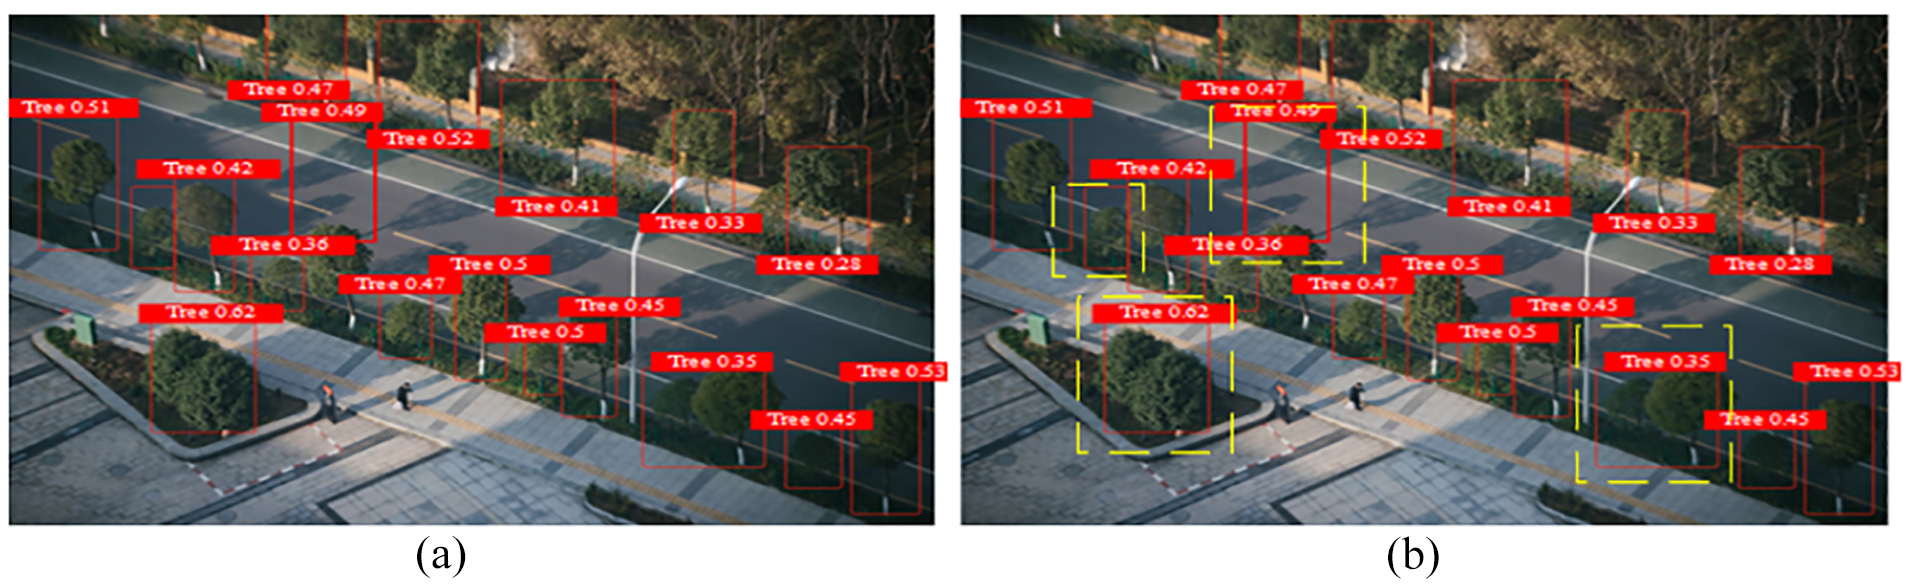
Object detection of R1 in Scenario 1: (a) initial object detection of R1 in Scenario 1 and (b) object misdetection of R1 in Scenario 1.
Figure 4 mainly presents the object detection situation of R1 in Scenario 1. From Figure 4(a), it can be seen that the total number of annual detections of R1 for the object is 17. The yellow dashed box in Figure 4(b) represents misdetections (i.e. errors that have already been detected), with a total of four misdetections.
The object detection of Scenario 1 by R2 is shown in Figure 5.

Object detection of R2 in Scenario 1: (a) initial object detection of R2 in Scenario 1 and (b) object misdetection of R2 in Scenario 1.
Figure 5 mainly presents the object detection situation of R2 in Scenario 1. From Figure 5(a), it can be seen that the total number of annual detections of R2 for the object is 19, and the number of misdetections in Figure 5(b) is 2.
The object detection of Scenario 1 by R3 is shown in Figure 6.

Object detection of R3 in Scenario 1: (a) initial object detection of R3 in Scenario 1 and (b) object misdetection of R3 in Scenario 1.
Figure 6 mainly presents the object detection situation of R3 in Scenario 1. From Figure 6(a), it can be seen that the total number of annual detections of R3 for objects is 20, and the number of misdetections in Figure 6(b) is 4.
The object detection of Scenario 1 by R4 is shown in Figure 7.

Object detection situation of R4 in Scenario 1: (a) initial object detection of R4 in Scenario 1 and (b) object misdetection of R4 in Scenario 1.
Figure 7 mainly presents the object detection situation of R4 in Scenario 1. From Figure 7(a), it can be seen that the total number of annual detections of R4 for objects is 34, and the number of misdetections in Figure 7(b) is 0.
According to the data summarized in Figures 4 to 7, the distribution of object detection confidence is shown in Table 2.
Distribution of object detection confidence.

According to the object detection confidence summarized in Table 2, it can be found that the object detection confidence of R1 is most distributed within (0.4, 0.5); the object detection confidence of R2 is most distributed within (0.6, 0.7), followed by (0.4, 0.5); the object detection confidence of R3 is most distributed within (0.5, 0.6); the object detection confidence of R4 is most distributed within (0.7, 0.9).
In addition, the number of object detection confidence intervals for R1, R2, R3, and R4 is 1, 8, 4, and 26, respectively.
The above data clearly demonstrates some advantages of R4 for object detection, not only with a large number of detections and fewer misdetections, but also with better confidence than the other three.
Then, based on the data in Figures 4 to 7, the accuracy of object detection is summarized, as shown in Table 3.
Object detection accuracy.

In Table 3, R4 has the highest accuracy in object detection, followed by R2. This further proves that R4 performs excellently in 3D positioning in Scenario 1 and has a stronger ability to extract object feature information.
In the same experimental operation as Scenario 1, R1, R2, R3, and R4 are used to detect Scenario 2. The difference is that Scenario 2 has fewer and simpler constituent elements, and the detection task objects are dogs, rabbits, and grass. Scenarios with very few elements generally have few misdetections, but there is a high possibility of missed detections. Therefore, for Scenario 2 object detection, 3D positioning is particularly challenging. Accurate 3D positioning can more smoothly identify indistinct elements.
Among them, the detection of Scenario 2 by R1, R2, R3, and R4 is shown in Figure 8.

Object detection in Scenario 2.
In Figure 8, it is obvious that R4 completes the detection task of Scenario 2 very awesome, and identifies the grass elements given in Scenario 2 very well. R1, R2, and R3 only identify two obvious elements: dog and rabbit, which shows that R4 has the best 3D positioning effect.
Although the confidence levels of R1, R2, R3, and R4 in object detection are all within the optimal range, R4 has a more prominent confidence level in object detection, with the highest confidence level, particularly close to 1.
After completing the object detection for Scenario 1 and Scenario 2, the object detection for Scenario 3 is continued. Compared to Scenario 1 and Scenario 2, Scenario 3 has more and more complex elements. Similarly, R1, R2, R3, and R4 are utilized to detect Scenario 3. The detection results are shown in Figures 9 to 12.
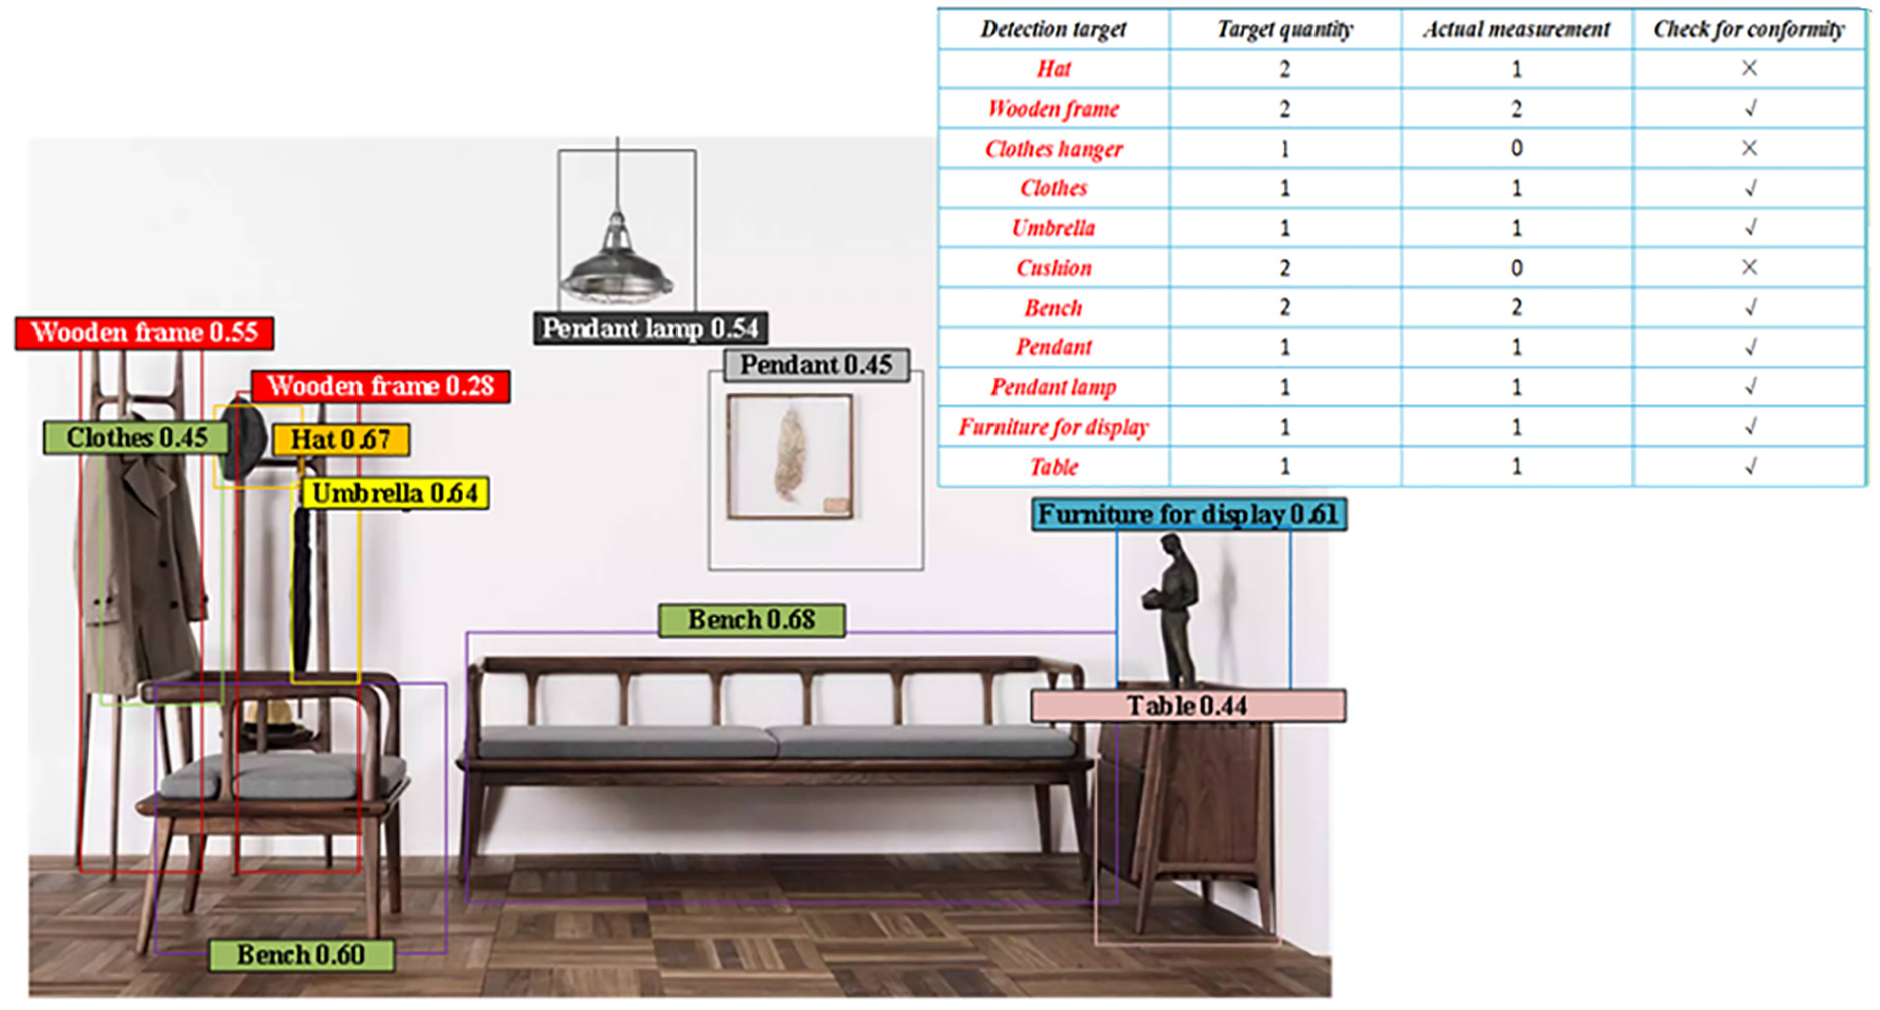
Object detection of R1 in Scenario 3.
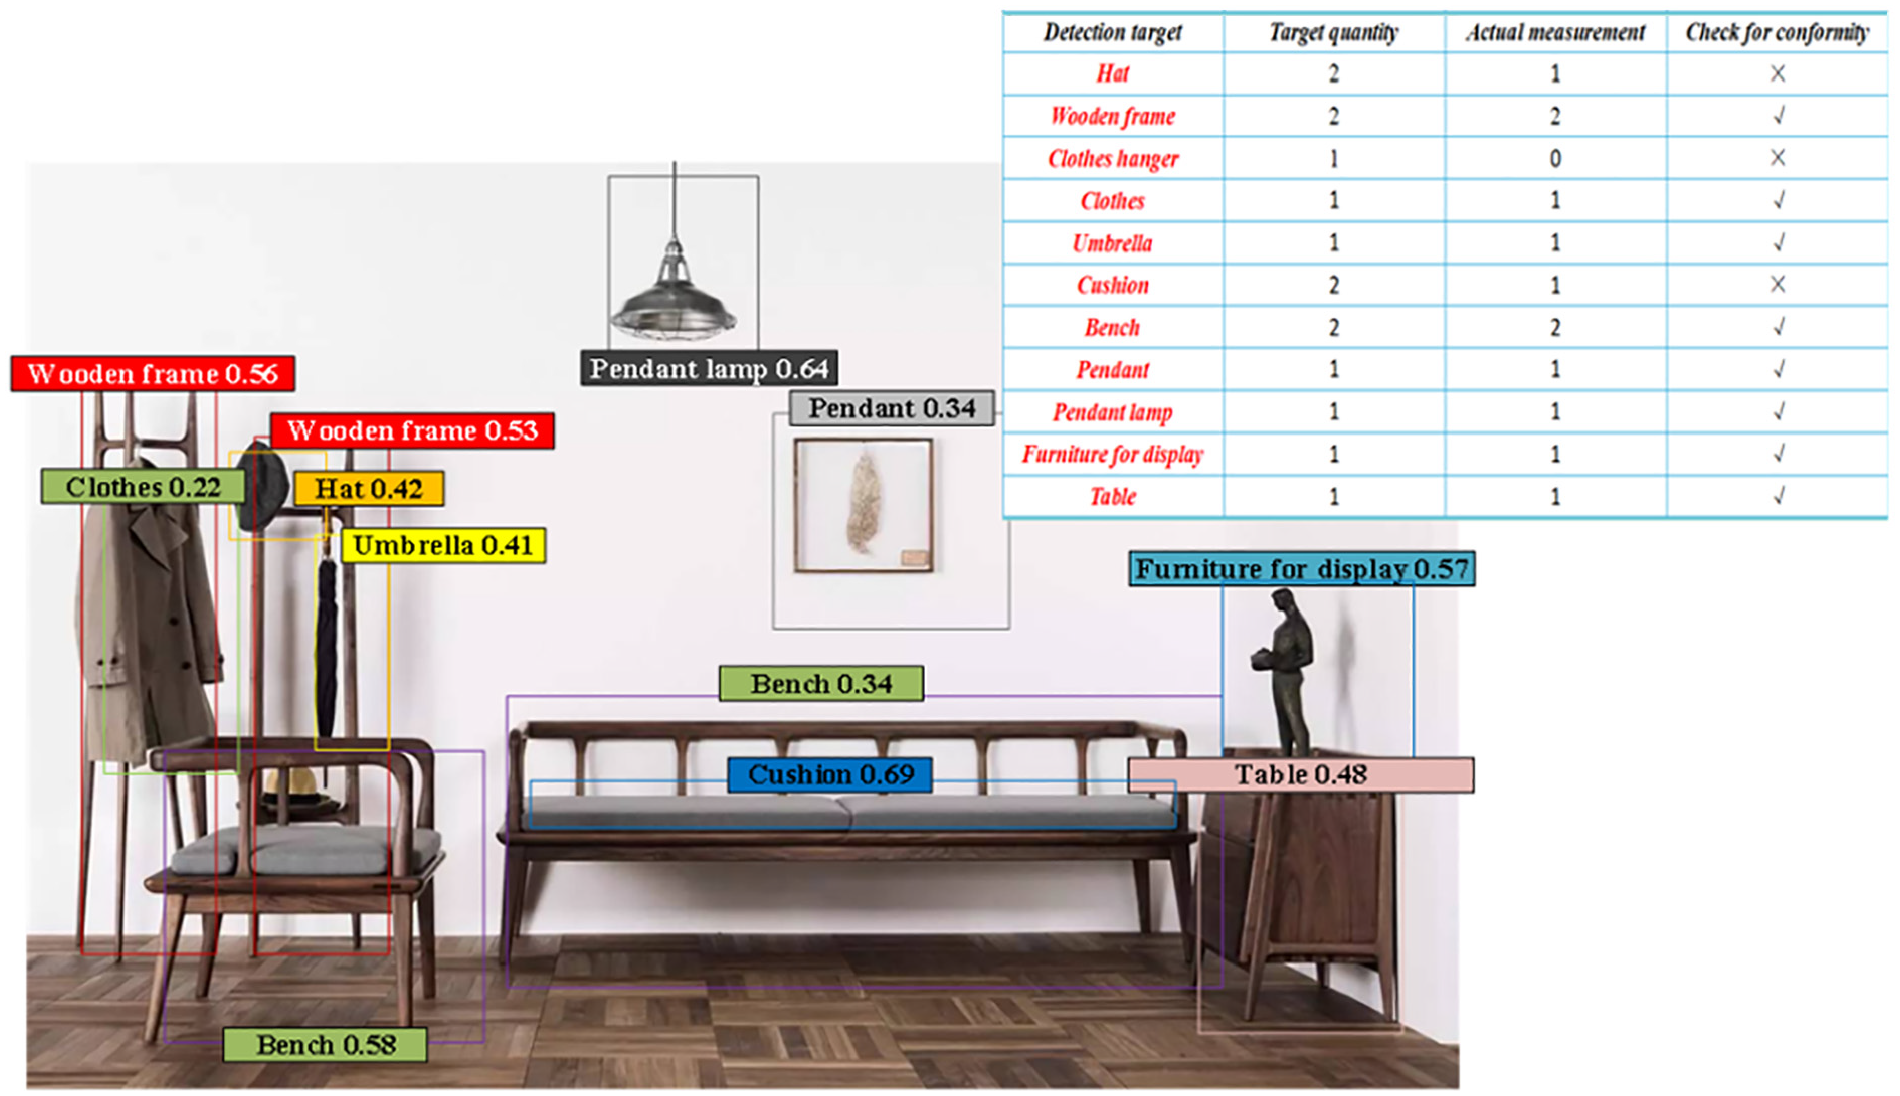
Object detection of R2 in Scenario 3.
Object detection of R3 in Scenario 3.

Object detection of R4 in Scenario 3.
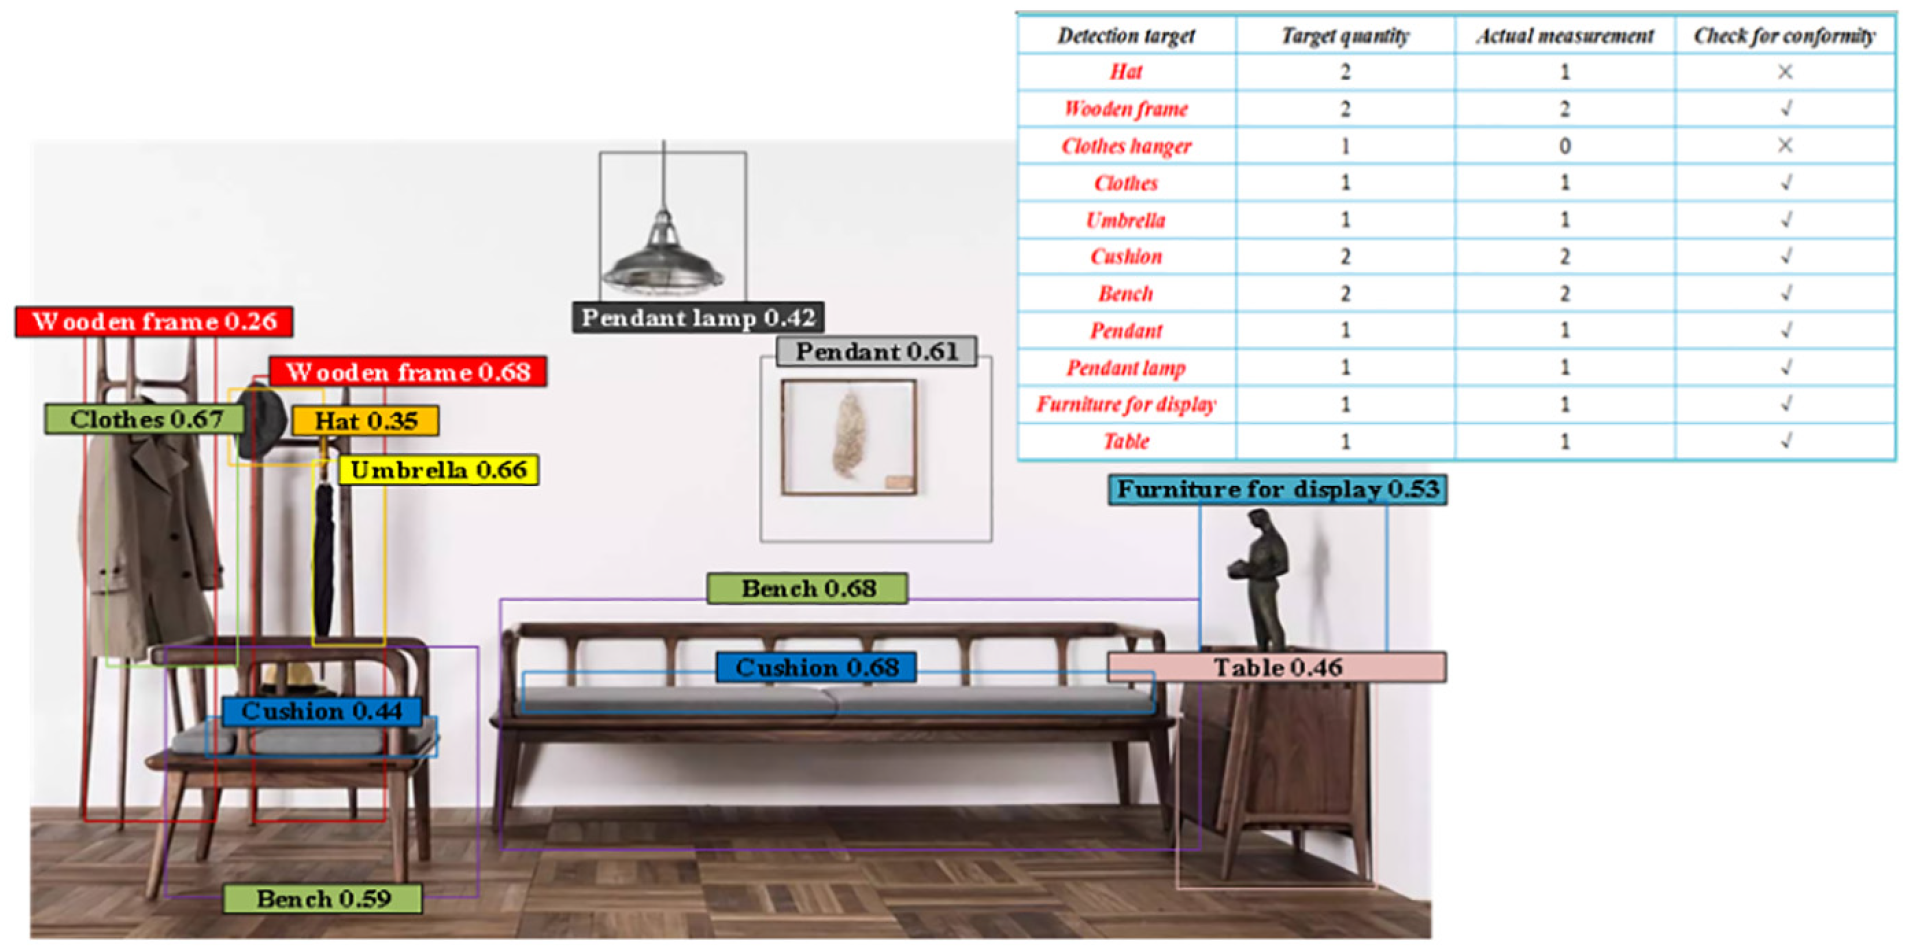
There are a total of 11 objects that need to be detected in Scenario 3, with a total quantity of 15. According to Figure 9, it can be found that R1’s actual object detection in Scenario 3 has three items that do not meet the standards, and the number of missed detections is 4. In addition, the number of objects detected in R1 within the optimal confidence distribution range is 4.
Figure 10 shows the object detection situation of R2 in Scenario 3. It can be observed that R2’s actual object detection in Scenario 3 also has three items that do not meet the standards, with a missed detection quantity of three. In addition, the number of object detection in the best confidence distribution interval for R2 is 2.
Figure 11 shows the object detection situation of R3 in Scenario 3. It can be found that there are two items that do not meet the actual object detection standards and two missed detections in R3 in Scenario 3. In addition, the number of object detection in the best confidence distribution interval for R3 is 6.
Figure 12 shows the object detection situation of R4 in Scenario 3, and it can be observed that R4’s actual object detection in Scenario 3 meets the standards without any missed detections. In addition, the object detection of R4 is within the optimal confidence distribution range, with a quantity of 15.
According to the confidence data of R1–R4 in Scenarios 1, 2, and 3, the mean confidence data is calculated, as shown in Table 4.
Mean confidence data.

According to the mean confidence calculated in Table 4, it can be found that R4 has the highest mean confidence regardless of which scenario it is used for object detection.
Based on the comparison between the positioning results of the Global Positioning System (GPS) position and attitude information of the UAV in Scenario 1 and the actual position, the relevant results of 3D positioning errors were calculated, as shown in Table 5.
3D positioning performance of multiple UAVs under different methods.

R4 in Table 5 shows the highest positioning accuracy and the lowest average positioning error in scenario 1. Especially in terms of positioning accuracy, R4 reached 95%, far exceeding other models.
Conclusions
This paper utilized an improved Deformable DETR model for multiple view geometry for multiple UAV object detection and 3D positioning. By preprocessing the data collected by UAVs, a clear data foundation was provided for subsequent processing. By improving the convolutional layer, applying residual structures, and designing new loss functions, the DETR model was optimized to improve the accuracy and robustness of object detection. Subsequently, multiple view geometry modeling and multimodal fusion were implemented to determine object information, further improving the accuracy of detection and positioning. Finally, experimental verification was conducted in different scenarios, and the results showed that the method used in this paper had the least number of misdetections and missed detections, which verified its effectiveness and reliability in UAV object detection and 3D positioning. Future research can further explore the optimization and performance improvement of algorithms to meet the growing demand and challenges of applications.
Footnotes
Handling Editor: Divyam Semwal
Declaration of conflicting interests
The author(s) declared no potential conflicts of interest with respect to the research, authorship, and/or publication of this article.
Funding
The author(s) disclosed receipt of the following financial support for the research, authorship, and/or publication of this article: This work was supported in part by Shaanxi Provincial Science and Technology Department under Grant 2023-YBGY-342, and in part by the National Natural Science Foundation of China under Grant 62073256.