
Abstract
In railway systems, the detection of wheel flats is essential for ensuring safety and reducing maintenance costs. This study compares the performance of Long Short-Term Memory and Transformer models in detecting wheel flats using data from a 1:10 scale railway test rig. The findings indicate that the Transformer model significantly outperforms the Long Short-Term Memory model, especially when feature-level sensor fusion is employed, achieving an average error as low as 0.0069 mm with percentage of error at 5.30%, minimizing the maximum error to 0.0985 mm. The study emphasizes the potential of Transformer models in railway diagnostics, particularly for applications requiring high accuracy and reliability. The insights gained from this research have practical implications for improving the precision of wheel flat detection in real-world railway operations, enhancing both safety and efficiency.
Background and motivation
Wheel flats are a critical issue in railway systems, directly impacting the safety, efficiency, and maintenance costs of train operations. A wheel flat, which is a localized flat spot on the wheel’s surface, occurs due to wheel sliding during braking or through wear and fatigue over time. This defect leads to increased dynamic loads on the track and rolling stock, resulting in accelerated wear and potential failures. Early detection of wheel flats is thus essential to prevent catastrophic failures, reduce maintenance costs, and ensure the safety of railway operations.
While most international standards primarily use length to evaluate wheel flats due to ease of measurement, we focus on depth in this study, adopting the Chinese standard TB/T 1335-1996, which includes both length (≥30 mm) and depth (≥1 mm), because our study is carried out for Hefei Metro in China. This emphasis on depth, requiring high-resolution equipment for measurements within 0.1–0.2 mm precision as per international standards like those from the UIC, allows for a more accurate assessment of the severity of wheel flats.1–3 This level of precision ensures that even minor wheel defects can be identified and rectified before they develop into more serious safety hazards. This level of accuracy is essential not only for maintaining the safety and reliability of the railway operations but also for reducing maintenance costs and extending the service life of both the wheels and the track. Therefore, any detection method implemented in a railway context must strive to meet or exceed these precision requirements to ensure that wheel defects are managed effectively and do not pose a risk to operational safety.
The integration of new technologies such as machine learning, sensor networks, embedded systems, and the Internet of Things (IoT) has revolutionized the field of railway maintenance and diagnostics. Traditional methods of wheel flat detection often rely on trackside sensors or manual inspections, which can be time-consuming and less accurate. However, recent advancements in machine learning, particularly deep learning models like Long Short-Term Memory (LSTM) networks and Transformers, offer significant improvements in the accuracy and efficiency of detecting wheel flats by analyzing time-series data from various sensors. Additionally, the use of embedded systems and IoT enables real-time data collection and analysis, facilitating more timely interventions and predictive maintenance strategies.
In the development of advanced diagnostic systems, rapid prototyping and testing in controlled laboratory environments are crucial. Scaled test rigs, like the 1:10 scale railway test rig used in this study, provide an efficient and cost-effective platform for simulating real-world conditions, validating new technologies, and refining algorithms before their deployment in the field. This approach allows researchers to generate valuable data for training machine learning models and to validate their performance in detecting wheel flats under various operational scenarios. The ability to iteratively develop and test in a laboratory setting accelerates innovation and ensures that solutions are robust and reliable when implemented in real-world railway systems.
This paper is structured as follows: Section “Literature review and methodological framework” presents a comprehensive literature review and discusses the limitations of current methodologies. It also introduces the methodological framework of this study, focusing on the application of LSTM and Transformer models, the use of a scaled test rig for data generation, and the advantages of sensor fusion techniques. Section “Setup of the 1:10 scale railway test rig and data collection” provides an overview of the experimental setup, focusing on the design and implementation of the 1:10 scale railway test rig and the data acquisition systems. The section details how the test rig is utilized to generate vibration signals and outlines the pre-processing steps applied to the collected sensor data for wheel flat detection. Section “Wheel flat detection with LSTM and transformer models” presents the results of the experiments conducted using the LSTM and Transformer models on the data collected from the scaled test rig. It compares the performance of the two models and evaluates the effectiveness of different sensor fusion strategies. The final section summarizes the key findings of the study, discusses their implications for railway maintenance practices, and outlines potential directions for future research, including the scaling of the developed methods to full-scale railway systems and the integration of multi-sensor data for comprehensive fault detection.
Literature review and methodological framework
Review of wheel flat detection techniques
In the domain of railway maintenance and diagnostics, two primary types of diagnostic method are employed for detecting wheel flats and related track defects: Traditional Signal Processing Techniques and Deep Learning-Based Approaches. These methods each offer unique advantages and challenges, making them suitable for different scenarios depending on the requirements for accuracy, computational resources, and the complexity of the diagnostic task.
Traditional diagnostic methods rely heavily on manual feature extraction through various signal processing techniques. 4 These methods are valued for their transparency and interpretability, as they allow engineers to directly observe the signal features that correspond to specific physical phenomena.
Wavelet-based methods are particularly effective for capturing transient features in vibration signals, which are crucial for detecting sudden changes caused by wheel flats. These techniques decompose the signal into different frequency components, enabling the identification of anomalies that might be missed by other methods. Jia and Dhanasekar 5 demonstrated the effectiveness of these approaches in detecting rail wheel flats using wavelet analysis.
Empirical Mode Decomposition (EMD) is another popular method used to extract non-linear and non-stationary signals. It is particularly suited for analyzing the complex vibrations associated with wheel flats, as it breaks down the signal into intrinsic mode functions that can be analyzed independently. Brizuela et al. 6 utilized EMD in their work on railway wheel-flat detection using ultrasound.
Principal Component Analysis (PCA) is commonly employed for dimensionality reduction, simplifying the dataset while retaining essential information. This is particularly useful in pre-processing steps, where it helps in reducing noise and focusing on the most significant features of the vibration data. Bosso et al. 7 applied PCA in their onboard diagnostic algorithm for wheel flat detection.
Root Mean Square (RMS) is a straightforward method for quantifying the overall energy of the vibration signal. It provides a single value that represents the magnitude of the signal, making it a useful feature for early detection of anomalies. This approach was highlighted in the work by Bahamon-Blanco et al., 8 where RMS was used to recognize track defects.
These traditional methods, while effective, often require significant manual effort during the development phase, particularly in data pre-processing and feature extraction. Although the application of these methods is computerized, with signal transformation procedures being automated, the initial development relies heavily on domain expertise to manually design and select features that capture the characteristics of wheel flats. This process can be time-consuming and may involve iterative adjustments to optimize performance. While traditional digital signal processing methods are well-suited for scenarios where the diagnostic system needs to be simple and interpretable, they may struggle with the complexity of modern railway systems, where data volume and variability are high. The manual development required for these methods is not entirely different from that needed for machine learning algorithms. However, machine learning, particularly deep learning, offers greater potential for automation in data analysis and feature extraction.
The advent of deep learning has introduced a more automated and potentially more accurate approach to railway diagnostics. Deep learning models can automatically learn hierarchical feature representations directly from raw data, reducing the need for manual feature engineering and extensive pre-processing.9,10 Although machine learning models still require model selection and parameter tuning, they can adapt more readily to complex and variable datasets, making them better suited to handle the intricacies of modern railway systems.
Convolutional Neural Networks (CNNs) are widely used in image and signal processing tasks due to their ability to capture spatial hierarchies in data. In the context of railway diagnostics, CNNs have been applied to process vibration signals, demonstrating high accuracy in detecting wheel flats by automatically learning relevant features from the data. Shi et al. 11 successfully designed a lightweight 1D CNN optimized with Bayesian techniques for this purpose.
Long Short-Term Memory Networks (LSTMs) are a type of recurrent neural network (RNN) specifically designed to handle sequential data and long-range dependencies. They are particularly effective in scenarios where the temporal evolution of the vibration signal is critical for accurate diagnosis. Bahamon-Blanco et al.12,13 leveraged LSTMs to recognize track defects through measured acceleration.
Residual Networks (ResNets) are deep neural networks that include residual connections to avoid the vanishing gradient problem, allowing for the training of very deep models. These networks have shown promise in achieving higher accuracy in fault detection tasks by capturing more complex patterns in the data. This approach has been explored in the work by Mosleh et al., 14 who used spectral analysis for wheel flat detection.
Given the computational demands of deep learning models, recent research has focused on developing lightweight models that can run on low-cost embedded systems like Arduino or Jetson Nano boards. These models are optimized to balance the trade-off between accuracy and computational efficiency, making them suitable for real-time diagnostics in resource-constrained environments. This trend is exemplified by the work of Shi et al. 11 and further supported by the modular design described by Mosleh et al.15,16
While deep learning approaches offer higher accuracy and the potential for real-time diagnostics, they require large datasets and significant computational resources for training and deployment. However, the development of lightweight models is making these techniques increasingly accessible for practical applications.
In Kim, 17 a comprehensive review of existing methods for wheel flat detection using vibration data is provided. A summary of the described methods is presented in Table 1.
Overview of wheel flat detection methods using vibration data.

This study builds upon our previous work, 18 which introduced traditional methods, demonstrated the advantages of deep learning models in feature extraction, and successfully applied ResNet models for classification and regression tasks using simulated vibration data from axle box accelerometers in a numerical dynamic model. While ResNet excels at processing 2D structured data, such as images, it is less suited for sequential data analysis. Therefore, in this follow-up study, we employed LSTM and Transformer models, which are more appropriate for capturing temporal dependencies and patterns in sequential data. Additionally, unlike the simulated data in the earlier study, the vibration data in this research were experimentally measured from both axle box and wayside sensors using a physical test rig, enhancing the real-world applicability and robustness of the findings.
Limitations of conventional methods and methodological framework
Application of LSTM and transformer models in fault detection
In the rapidly evolving field of railway maintenance, deep learning approaches have demonstrated significant potential in enhancing the accuracy and efficiency of wheel flat detection. While traditional signal processing techniques have long been the foundation of diagnostic practices, the increasing complexity of railway systems and the need for real-time monitoring make deep learning methods a promising alternative. These approaches, with their ability to automatically learn and extract relevant features from vast datasets, offer a level of precision and adaptability that is becoming increasingly necessary in modern railway diagnostics. Given their proven effectiveness, deep learning models deserve broader attention and adoption in the industry, particularly as the demand for more sophisticated and reliable diagnostic systems continues to grow.
When comparing different deep learning architectures, CNN, LSTM, and ResNet each offer unique advantages in the context of wheel flat detection. CNN excels in capturing spatial hierarchies within the data, making them particularly effective for analyzing vibration signals in a structured manner. LSTM, on the other hand, is designed to handle sequential data and long-range dependencies, making them well-suited for tasks where the temporal aspect of the signal is crucial. ResNet provides the advantage of being able to train very deep networks by mitigating the vanishing gradient problem through residual connections, allowing for more complex pattern recognition. However, Transformers, with their self-attention mechanism, have emerged as a powerful alternative for handling time-series data. Unlike LSTM, which relies on sequential processing, Transformers can capture dependencies across the entire sequence in a more parallelized and efficient manner, making them particularly effective for time-sensitive applications.
In this context, this study seeks to explore and compare the performance of LSTM and Transformer models in the detection of wheel flats. By examining these models within the same diagnostic framework, the study aims to provide insights into the strengths and weaknesses of each approach, contributing to the ongoing discussion on the most effective tools for railway diagnostics. This comparative analysis will shed insight on whether the advanced capabilities of Transformers can offer significant improvements over traditional LSTMs in real-world applications.
Overcoming data scarcity through scaled test rigs and simulation
Current maintenance strategies in many passenger rail systems, such as subways, rely heavily on scheduled inspections and repairs. This reliance on planned maintenance can lead to fewer naturally occurring fault instances, like wheel flats, being observed and recorded during regular operation. As a result, there is a scarcity of actual fault data available for developing and validating effective damage detection algorithms. To overcome this limitation, both simulations and practical experiments are essential. Simulations help in understanding train-track dynamics and the influence of wheel wear on vibrations, but they require real-world validation. Full-scale operational testing to monitor damages is often impractical, unsafe, or disruptive. A 1:10 scale test rig bridges this gap between simulation and real-world validation:
Scaling strategy and similarity laws: We use a 1:10 scale model of the railway vehicle and track system. All linear dimensions are reduced by a factor of 10, and to ensure accurate representation of the real system, we apply similarity laws and dimensional analysis. Key physical properties such as mass, inertia, stiffness, and damping are adjusted accordingly to maintain realistic dynamic behavior.
Focus on specific damages: Designing a 1:10 test rig involves complex considerations, as not all parameters can be uniformly scaled. We concentrate on specific types of damage, like wheel flats, and carefully select materials and model designs to closely replicate the actual vibration characteristics. This approach ensures that the sensor system and diagnostic algorithms can detect corresponding damages under conditions that mimic real-world scenarios.
The main purpose of using this scaled test rig is to develop and validate damage detection and identification algorithms in a controlled, safe, and cost-effective environment. It offers several advantages:
Introduce controlled damages: We can deliberately apply specific damages or faults to the scaled model to study their effects on system behavior comprehensively and safely.
Collect high-quality data: The controlled laboratory environment enables precise measurements and data collection without the variability found in real-world operations.
Accelerate testing cycles: The reduced size and controlled conditions facilitate faster experimentation and iterative development of effective algorithms.
Ensure safety and cost-effectiveness: Testing on a smaller scale reduces risks and costs compared to experimenting with full-sized railway vehicles and tracks.
This study focuses on developing a scale model that demonstrates the behavior of interest within a limited range in a qualitative manner, rather than fully replicating reality. Most existing scaled models for educational and research purposes focus on vehicle dynamics, analyzing low-frequency global modes like pitch, roll, yaw, and bounce to improve vehicle stability. However, studies on high-frequency local modes related to defective structural parts, such as wheel flats, are rare. Previous research using a 1/5 scale metal roller jig provided limited information on wheel flat shapes and manufacturing processes. 4 Our study differs by placing a vehicle on a track instead of a roller jig, utilizing 3D printing to efficiently build and modify the model, and incorporating embedded systems for vehicle control, offering a new method to investigate wheel flats.
To implement this, the bending modes of the wheelset, which are closely related to the vibration energy caused by wheel flats, were designed to exist within the measurable frequency range. Scaling in railway research is complex, with three common strategies, time and frequency scaling, 19 stress scaling, 20 and material density scaling, 19 each having limitations. This study adopts the time and frequency scaling strategy, focusing on qualitatively replicating the effects of excitation forces from wheel flats on the bending modes of the wheelset, rather than achieving perfect quantitative scaling.
To construct the scale model, Fused Deposition Modeling (FDM) and Polylactic Acid (PLA) filaments were used. PLA is a biodegradable thermoplastic derived from renewable resources like corn starch. It is suitable for rapid prototyping but lacks the strength and durability of metal. Unlike traditional scale models made from metal through machining processes, the FDM approach results in lower stiffness, strength, and durability. Due to these structural limitations, it is not feasible to match the exact stress conditions of wheel-rail contact. Increasing the axle load or wheel-rail contact load to achieve a quantitative downscale level would result in damage to the wheel and rail. Instead, the scale model is designed to ensure that vibration data collected from axle box and wayside accelerometers captures the qualitative influence of the wheelset’s bending modes. This allows in-house fabrication in a laboratory environment without outsourcing, enabling the rapid transformation of ideas into physical forms. It accelerates the processes of prototyping, testing, and design improvement, while efficiently exploring various defect conditions.
Enhancing detection accuracy through onboard and trackside sensor fusion
Traditional railway inspection methods are typically divided by specialization, with the vehicle department inspecting vehicle damage and the infrastructure company inspecting track damage. This approach often results in high deployment and maintenance costs for expensive inspection equipment. However, the inherent mobility of railway vehicles offers the advantage of dynamically monitoring the network as they operate. Meanwhile, trackside detection equipment, installed at fixed locations, can successively monitor the condition of the moving vehicles. By leveraging the complementary characteristics of mobile and stationary railway equipment, sensor fusion technology can enable more efficient and accurate detection of wheel flat faults.
This study will explore the fusion of vibration signals collected from both onboard and trackside sensors, investigating the implementation of sensor fusion algorithms and evaluating their effectiveness. By integrating data from multiple sources, the goal is to achieve higher detection accuracy, ultimately enhancing the overall reliability of the railway inspection process.
Setup of the 1:10 scale railway test rig and data collection
A review of scaling strategies in scaled wheel-rail contact test rigs
Scaled wheel-rail contact test rigs are essential tools for studying wheel flat detection, wheel-rail dynamics, and contact mechanics in controlled laboratory environments. Scaling strategies play a critical role in ensuring that experimental results from these test rigs are representative of real-world full-scale conditions. Various research studies have explored and implemented scaling methodologies to address the complexities of replicating real-life phenomena at reduced scales while maintaining physical relevance.
Most scaling strategies are based on the principles of dimensional analysis, particularly the Buckingham π theorem, which identifies dimensionless parameters governing the wheel-rail interaction system. Key parameters include the geometric scale ratio, material properties, wheel-rail contact pressure, normal and tangential forces, slip ratio, and thermal effects. Researchers emphasize preserving these non-dimensional parameters to ensure fidelity in the scaled experiments.
Naeimi et al. 20 discusses how geometric similarity alone is insufficient for accurate representation. Instead, dynamic similarity (matching velocities, accelerations, and forces in scaled and full-sized systems) and material similarity (maintaining comparable mechanical properties like Young’s modulus and hardness) must also be ensured. This paper highlights the trade-offs and constraints when matching multiple parameters simultaneously.
One of the core challenges in scaling is maintaining geometric similarity while accommodating practical constraints in laboratory setups. In Nagaraju et al., 21 the authors describe a 1:5 scale rig that replicates key physical parameters, including temperature distribution and thermal effects during wheel-rail contact. However, maintaining exact geometric scaling often requires adjustments in loading conditions, rotational speeds, and material composition. Dynamic similarity focuses on replicating inertia forces, centrifugal effects, and impact dynamics in wheel-rail interactions. Vantagodi et al. 22 illustrates how anti-slip control mechanisms need to consider both linear and angular velocities while adjusting traction coefficients. Surface properties, such as roughness, wear patterns, and adhesion levels, are often difficult to scale directly. Many studies suggest using coatings or surrogate materials to mimic surface behaviors at smaller scales. In Naeimi et al., 23 the authors propose replicating wear patterns by carefully adjusting load distribution and speed. Heat generation during wheel-rail contact is highly sensitive to scale. In Nagaraju et al., 21 researchers addressed thermal scaling challenges by using Fiber Bragg grating sensors to measure temperature gradients across wheel-rail interfaces. These approaches often involve scaling the time-dependent parameters differently from static parameters.
In real-world applications, achieving perfect similarity across all parameters is rarely feasible. Researchers often prioritize parameters most critical to their study objectives. For instance, if wheel flat detection is the primary focus, surface contact forces and impact loading may be prioritized over material heat transfer fidelity.
This study aims to qualitatively understand fault-induced vibration mechanisms rather than quantitatively scale parameters like acceleration, stiffness, and mass according to similarity laws, which become error-prone as scale increases. The scaled model serves as a preliminary research tool to validate and refine concepts before full-scale experiments, focusing on ensuring key vibration characteristics are observable in the signals. While 3D-printed components have lower stiffness and strength than metal, they facilitate easier measurement of wheelset bending modes at lower frequencies (around 200 Hz), which align with the sampling limits (1000–1200 Hz) of cost-effective embedded systems like Arduino and Jetson Nano. In contrast, a 1/10 scaled metal wheelset would shift bending mode frequencies to approximately 1000 Hz, requiring costly equipment like NI DAQ and higher sampling rates (≥2000 Hz), increasing system complexity. The scaled speed was reduced to approximately 6 km/h (1.67 m/s) from an actual speed of 60 km/h to ensure adequate detection of bending modes and fault signals. Despite limitations in stiffness matching, the design prioritizes the observability of key vibration mechanisms, enabling efficient validation and analysis in the early research stages.
Infrastructure and vehicle design of the railway test rig
An 1:10 scaled oval track was designed and constructed using Fused Deposition Modeling (FDM) 3D printers at Hefei University (Figure 1). This track consists of both straight and curved modules, with a total length of approximately 16.997 m. Specifically, the track is composed of eight straight modules and eight curved modules. The straight modules are 1.19 ms long. Due to the 3D printer’s size limitation (300 × 300 mm bed), each curved module was designed with a radius of 1.19 m and a central angle of 60°, ensuring it matches the length of the straight modules. This design simplifies construction and maintenance without affecting the experimental results.
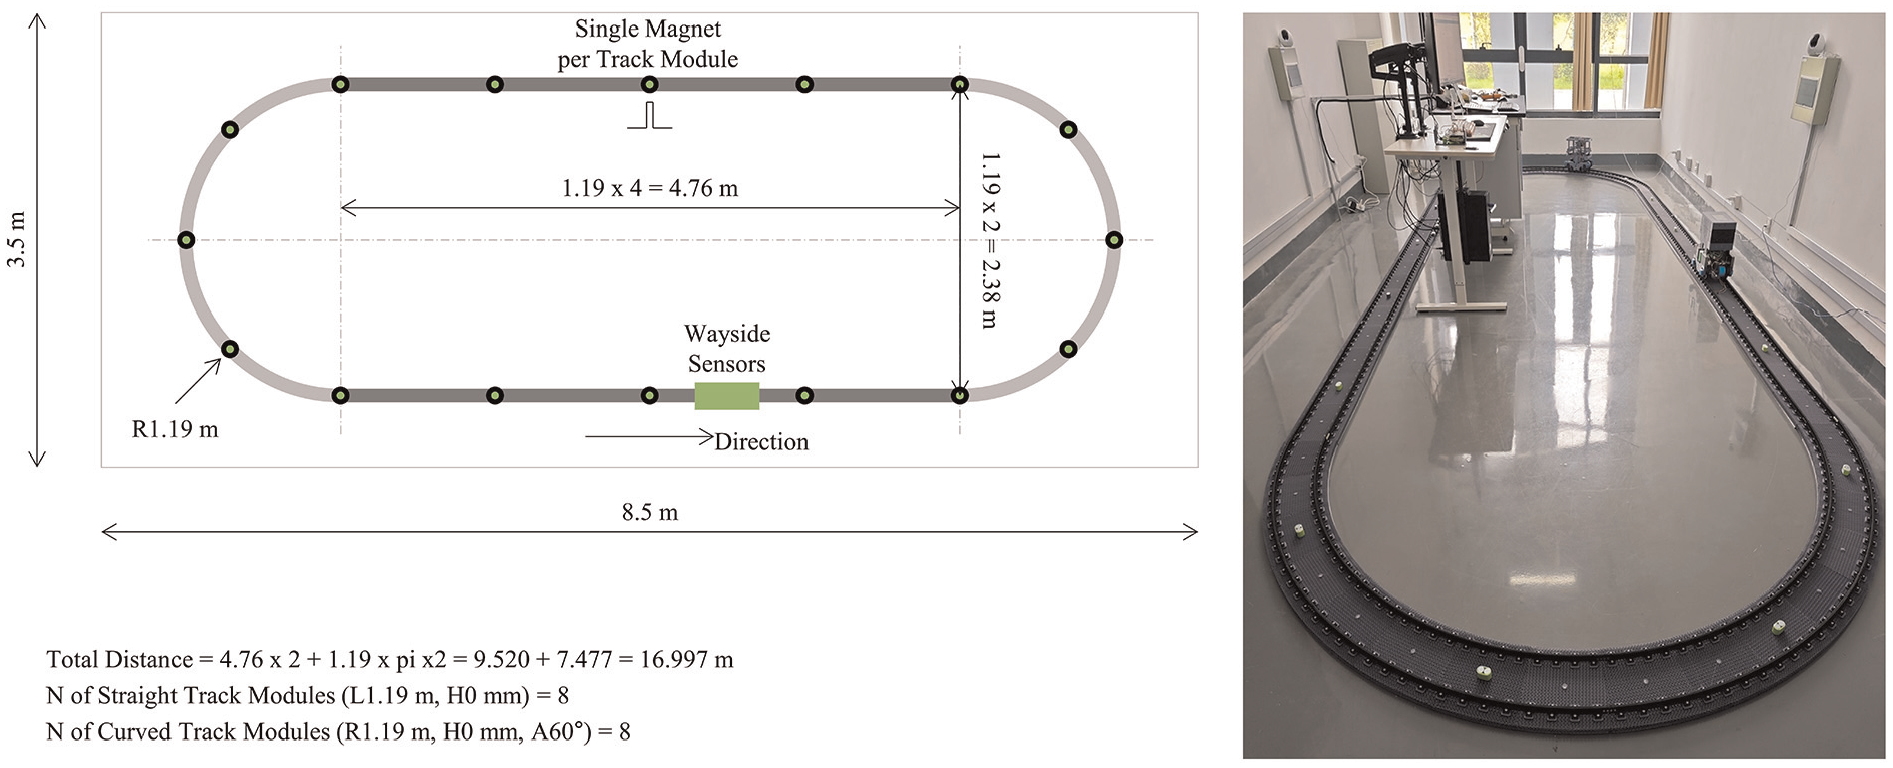
Layout and construction of the oval test track.
Magnets are installed at regular intervals along the track to generate reference pulse signals, which are crucial for vehicle localization within the system. This track design allows for accurate and consistent vehicle positioning, which is essential for various experimental tests and simulations. The overall dimensions of the track setup are 8.5 m in length and 3.5 m in width, accommodating a full loop within a compact area.
The train is composed of two vehicles, allowing for flexible operation and testing scenarios (Figure 2). The control box on front bogie is designed to be modular, enabling the customization of features based on the specific requirements of different applications. The vibrations were measured from the axle box accelerometer mounted on the trailer attached to the rear of the bogie model. This modular design approach facilitates the integration of various sensors and control systems, such as the NVIDIA Jetson Nano for control at the front bogie and the Arduino GIGA R1 for decentralized measurement subsystems at the trailer. The vehicle communicates wirelessly with a central client computer via Wi-Fi, allowing for efficient data collection and control in a networked environment.

Overview of the vehicle design for the scaled test rig. 17
In this study, a 1/10 scale model of a metro vehicle wheel (original diameter 0.84 m) was created using 3D printing, necessitating design compromises due to material and manufacturing limitations. The focus was on qualitatively maintaining key features like wheelset bending modes and wheel-rail contact conditions to ensure measurable vibration data, even if exact frequencies differed from real-world values. Using 3D-printed components with lower stiffness allowed the bending modes to fall within the sampling capabilities of low-cost embedded systems. By scaling the vehicle speed to approximately 6 km/h, the model provides a preliminary environment to qualitatively understand fault-induced vibration mechanisms before conducting full-scale experiments.
It is possible to generate various sizes of wheel flat for different wheelsets. In this study, the wheelset damages generated were 0.5, 1.0, 1.5, 2.0, 2.5, and 3.0 mm. In practical modeling, it is challenging to accurately create the expected size of damage manually. Therefore, these wheel flats need to be modeled through Finite Element Method (FEM) or using 3D scanning. 3D scanning requires additional equipment, in this research, the damage was modeled using finite element analysis. As shown in the Figure 3 (using the creation of 1 mm deep damage as an example): first, a wheel model without damage is created (Figure 3(a)), then a simple cross-sectional model is obtained by cutting 1 mm off the wheel (Figure 3(b)).

Generating wheel flats through FEM simulation: (a) no flat, (b) flat model #1 (depth: 1 mm) simple cut, (c) flat model #2 (depth: 1 mm) Boolean operation (NOT), and (d) flat model #3 (depth: 1 mm) FEM-Simulation. 17
The damaged wheel model created in this way cannot be directly used on the track because its cut edges are too sharp and do not align with the mechanism of wheel flat formation. Wheel flats typically occur during sudden braking, when the wheel locks and skids along the rail. The skidding creates a rough and localized damaged area. As the wheel resumes rotation, the repeated contact with the rail gradually smooths out the damaged surface. However, the sharp edges and unnatural damaged surface, including areas not in contact with the rail, do not accurately reflect a realistic shape. Therefore, further processing is necessary to create a more realistic representation of the wheel flat. Through a Boolean subtraction operation, the sharp cut edges are removed (Figure 3(c)), and the final model is obtained through finite element analysis (Figure 3(d)). The final model was generated using finite element analysis in Abaqus, where the wheel skidding process on the rail under load was simulated to achieve realistic plastic deformation. The wheel and rail models were first exported from Autodesk Fusion 360 and discretized into second-order hexahedral elements (C3D20), with a finer mesh applied in the contact region for stability and precision. Second-order elements were chosen for their ability to capture complex deformations with high accuracy. To reflect the plastic deformation during the skidding process, material properties of steel, including Young’s modulus, Poisson’s ratio, density, and stress-strain curves, were applied. Although the scale model wheel is made of PLA, steel properties were used because PLA does not exhibit plastic deformation under load, whereas steel better replicates the mechanism seen in real-world wheel flats. The mesh was refined in the contact region (±30° around the contact point) to ensure numerical stability and accurate representation of the deformation. This approach ensures that the resulting deformed geometry accurately represents the damage mechanism observed in real wheel flat formation. Once completed, the deformed geometry was exported in STL format, refined, and prepared for 3D printing, providing a realistic and experimentally applicable model.
Data acquisition and processing in vehicle vibration monitoring
Signal capture methodology
Vibration signals are captured from both onboard and trackside sensors during the operation of the vehicle. The onboard sensors consist of a 6-degree-of-freedom Inertial Measurement Unit (IMU) LSM6DS33, which is connected to an Arduino GIGA R1. This Arduino GIGA R1 is further connected to a Jetson Nano for data transmission and subsequent analysis. The trackside detection system, on the other hand, utilizes five Arduino RP2040 devices placed at different locations along the track. These devices collect the vibration data, which is then transmitted via serial communication to a ground-based client computer for further processing.
The vibration signals collected by the onboard sensors are dynamically processed by the Arduino GIGA R1 using C++ code. The processed signals are then sent to the Jetson Nano for storage and analysis. This study focused on capturing raw vibration signals across all relevant frequency ranges without applying specific filtering parameters. A sampling rate of 1000 Hz was chosen based on FEM simulations that identified the wheelset’s primary bending modes at approximately 200 Hz (first mode) and 350 Hz (second mode). According to the Nyquist theorem, this rate allows accurate analysis of frequencies up to 500 Hz, ensuring these critical signal characteristics are preserved.
While higher sampling rates were possible, 1000 Hz balanced system stability and signal resolution and was efficient for the embedded system used. The bending modes have fixed frequencies independent of vehicle speed, so this sampling rate effectively captures necessary signal characteristics across the tested speed ranges. Potential resonance from wheelset rotation was not an issue, as operational speeds were outside resonance conditions. The Arduino GIGA R1 is installed in the trailer and is connected to the left and right wheels of the rear axle, capturing three degrees of freedom of acceleration data from each wheel. The sensor setup, including the axle box, Arduino GIGA R1, and trackside sensors, is depicted in Figure 4. The comprehensive system ensures that both onboard and trackside vibration data are efficiently captured and processed for further analysis.

Vibration signal collection system for onboard and trackside sensors.
Data pre-processing
The data is gathered from various sensors, both trackside and onboard, each capturing different types of acceleration signals. These acceleration measurements represent the vibrational behavior of the train and track and are crucial for detecting and diagnosing potential issues such as wheel flats or track irregularities. These sensors operate at a sample rate of 1000 Hz. Figure 5 illustrates the comparison of raw vibration data with and without wheel flats as an example. To effectively capture impulsive responses, the time-frequency analysis is performed using the Wavelet transform instead of the Fourier transform. The raw data undergoes Min-Max normalization to rescale the signal values to a consistent range 0 and 1. This process adjusts the minimum and maximum values of the data to predefined limits, ensuring uniformity across all signal points. Normalization eliminates scale differences caused by varying sensor sensitivities or operational conditions, allowing for accurate and fair comparison in subsequent analyses. Following normalization, the data is segmented into 0.5-s windows, each containing 500 signal points, for further processing. The time window was set to 500 with the intention of capturing sufficient structural resonance information while also considering training speed and GPU memory capacity to allow for fast training on batch data. This step is crucial for preparing the data for model training and testing.

Comparison of raw vibration data with and without wheel flats: (a) no flat and (b) flat model #1 – simple cut.
In this study, LSTM and Transformer models are used to conduct wheel flat fault detection (see Section “Wheel flat detection with LSTM and transformer models”). The vibration data corresponding to flat defects (see “A review of scaling strategies in scaled wheel-rail contact test rigs”) of 0 mm (no fault), 0.5, 1.0, 1.5, 2.0, 2.5, and 3.0 mm are measured and analyzed. These fault levels serve as labels for training and validation. Given the similarity in signal formats from trackside and onboard sensors, the same model architecture can be applied to both, with variations only in the input tensor shapes: 10-dimensional for trackside sensors (five sensors each in the y and z directions) and one-dimensional for onboard sensors (in the z direction).
Data preparation and processing involve three distinct functions, each tailored to handle trackside data, onboard wheel data, and a combination of both. These functions ultimately prepare the data for use in training and validating the machine learning models.
The “process_track_data” function manages the trackside sensor data, collected from multiple sensors along the track. Due to occasional sensor measurement errors and data transmission issues, the collected trackside sensor data may contain NaN (Not a Number) values. These NaN values can interfere with data analysis and machine learning algorithms, which require complete numerical datasets. Therefore, after reading, timestamp synchronization, and aggregation, the process_track_data function cleans the data by removing any NaN values using Python preprocessing code. This ensures that the dataset is clean and suitable for further processing and analysis. It is then segmented into overlapping windows using a sliding window approach with a defined WINDOW_SIZE (500 points per second), capturing the temporal patterns essential for accurate estimations. Following segmentation, the data is normalized and structured into 10-dimensional tensors, reflecting the data from the y and z directions. The normalized dataset is then split into training (80%) and testing (20%) sets and loaded into PyTorch DataLoader objects for model training.
The “process_wheel_data” handles the onboard IMU sensor data, focusing on signals from the wheels. The processing steps are similar: data reading, synchronization, window segmentation, and normalization. However, the data is represented as one-dimensional tensors, corresponding to the single sensor direction being analyzed. The same training/testing split is applied, and the data is prepared for input into the model.
The “process_all_data” function integrates both trackside and onboard data into a single dataset. After reading, synchronizing, and aggregating the data, it is structured into 11-dimensional tensors (ten from trackside sensors and one from the onboard sensor). This combined dataset undergoes the same segmentation, normalization, and data splitting procedures, allowing the model to benefit from the combined insights of both data sources, potentially enhancing predictive accuracy.
In all three functions, splitting the data into training and validation sets is a critical step, ensuring that the models are trained on one subset and validated on another to assess performance on unseen data. Consistent methodology is applied across the functions: data is segmented using a sliding window approach, normalized, and split into training and testing sets. This preparation maximizes the model’s ability to learn and generalize from the data, whether sourced from trackside sensors, onboard sensors, or a combination of both.
Wheel flat detection with LSTM and transformer models
Overview of LSTM and transformer models
When addressing the challenges of analyzing sequential data like wheel flat damage, both LSTM (Long Short-Term Memory) and Transformer models stand out as effective machine learning algorithms, each offering unique strengths tailored to different aspects of the problem.
LSTM is a specialized type of Recurrent Neural Network (RNN) that excels at capturing long-term dependencies in sequential data. It overcomes the limitations of traditional RNNs, which often lose relevant information over extended sequences. 24 LSTM introduces memory cells with input and output gates, enabling it to retain and access important information across long sequences. This capability is particularly useful for tasks like natural language processing and time-series analysis, where the temporal order of data is crucial. LSTM’s efficiency in handling time dependencies makes it a practical choice for resource-constrained environments and tasks like wheel flat detection in railway systems.
On the other hand, the Transformer model is designed to address the inefficiencies of RNNs when dealing with long sequences by using a self-attention mechanism. 25 Unlike RNNs, which process sequences in order, the Transformer can access information from the entire sequence simultaneously, capturing long-range dependencies more effectively. The Transformer’s architecture, consisting of an encoder and decoder, allows it to excel in tasks that require complex, large-scale sequential data analysis, such as machine translation and text generation. Its parallel processing capabilities also significantly enhance training and inference speed, making it ideal for large datasets.
In summary, while LSTM is well-suited for handling time dependencies with lower resource demands, the Transformer offers superior capabilities for managing long-range dependencies and large-scale data. The choice between these models depends on the specific application, data characteristics, and available resources. This study begins with wheel flat detection using LSTM due to its lower computational requirements and later compares its performance with the more resource-intensive Transformer model.
Comparative analysis with LSTM and transformer models
Model architectures for wheel flat diagnosis
The LSTM model used in this study is illustrated in Figure 6. The model’s structure remains consistent across different data scenarios, whether it is trackside data, onboard data, or a combination of both. The primary difference lies in the shape of the input tensor (
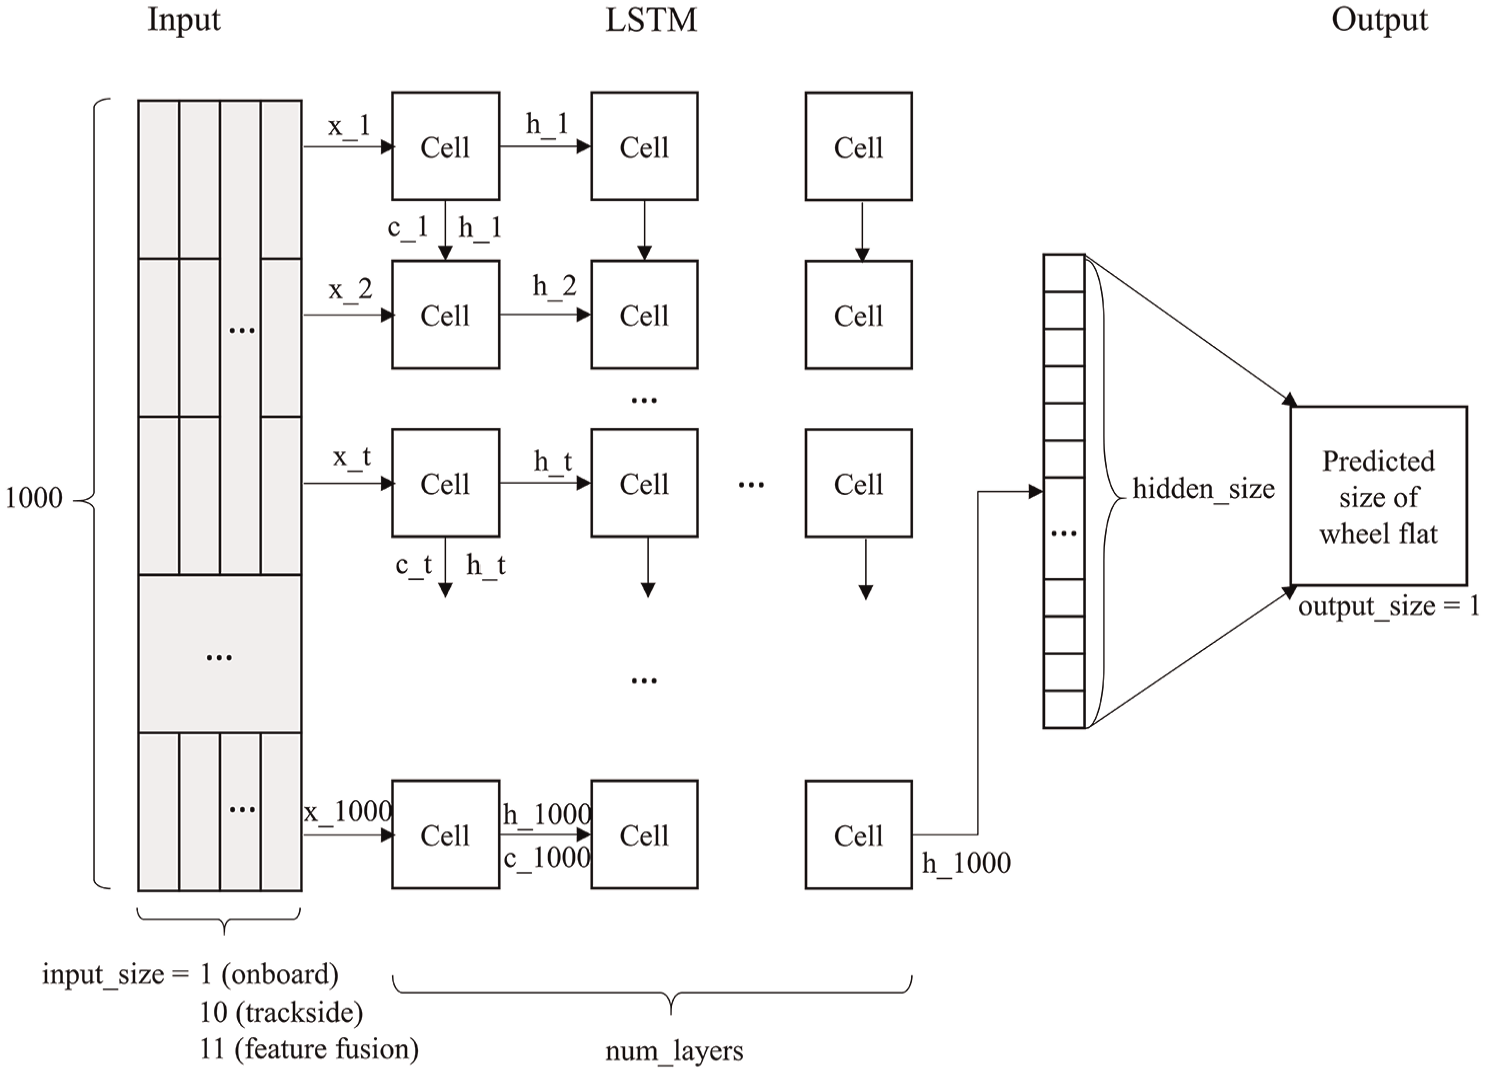
LSTM model for wheel flat diagnosis.
The Transformer model, in this context, is also designed to handle the different datasets. The structure of the model is illustrated in Figure 7. While the input tensor size (
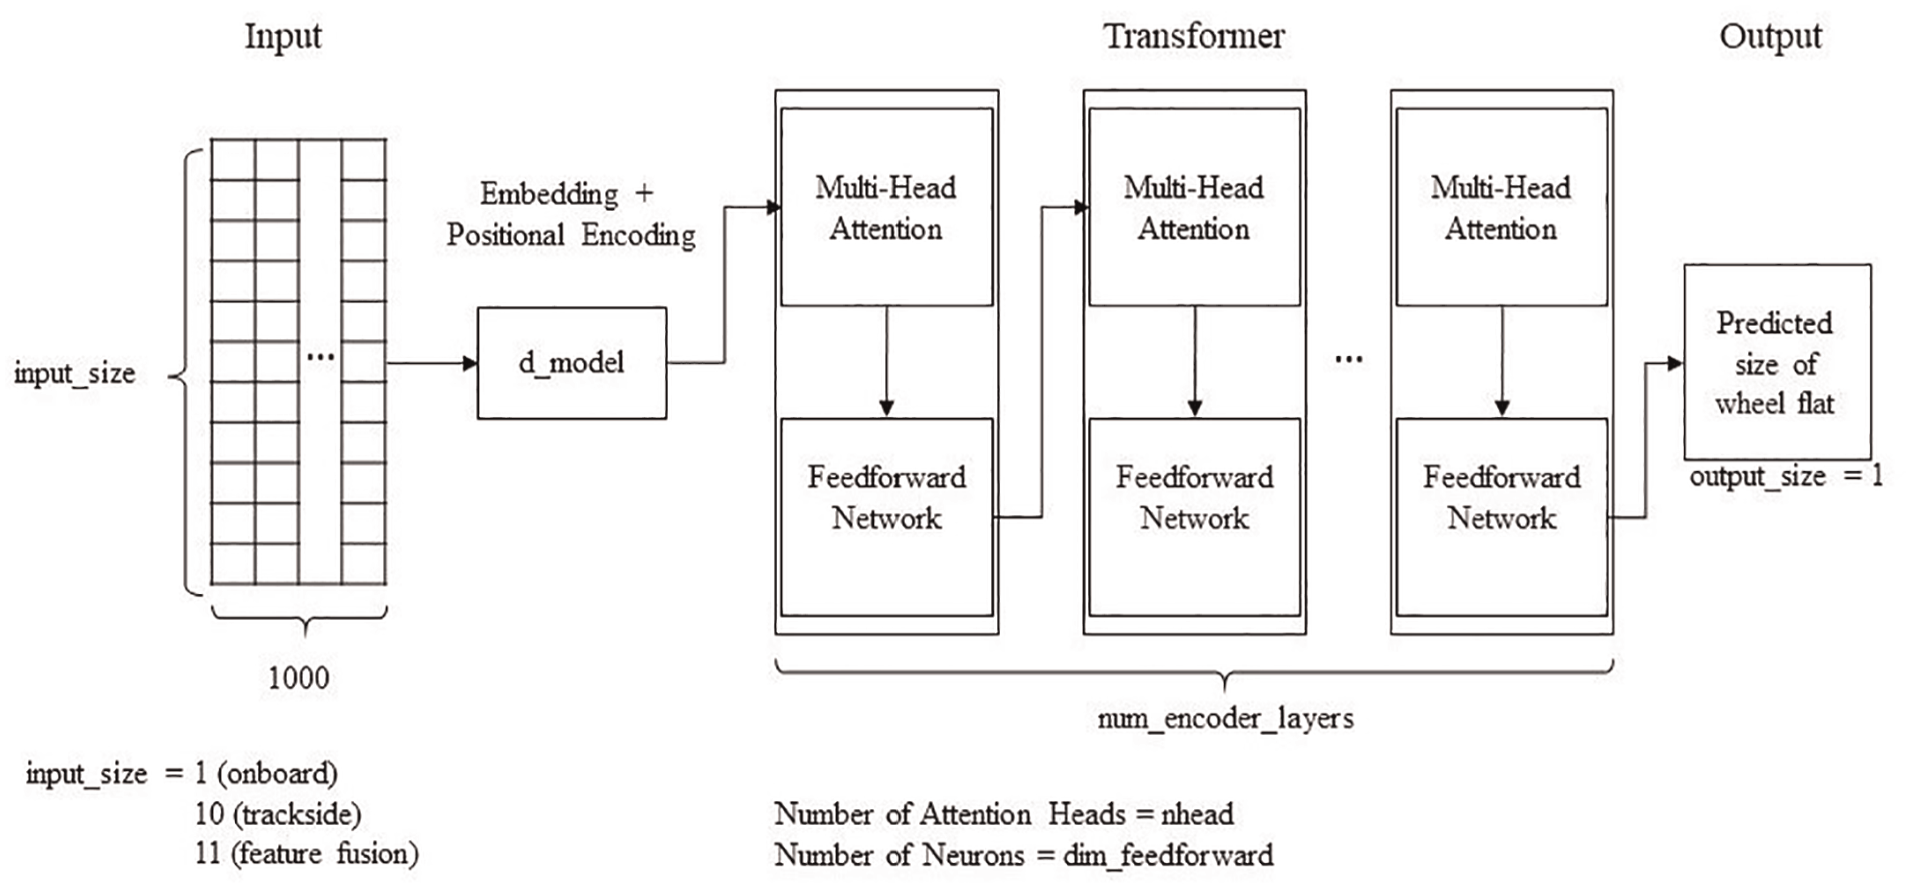
Transformer model for wheel flat diagnosis.
To achieve sensor fusion of the track and wheel monitoring data, either decision-level fusion or feature-level fusion can be employed. Decision-level fusion involves training two separate models, one for track monitoring data and another for wheel monitoring data. The estimations from these two models are then combined to make the final decision. This typically involves averaging the outputs of the two models or using more complex methods to combine these outputs. The specific steps are as follows:
Train two models: Train two separate LSTM or Transformer models, one for the track data and another for the wheel data.
Estimation and fusion: For each sample, use the two models to make estimations independently, and then combine these estimations to make the final decision. The simplest fusion method is to take the average of the two outputs.
Feature-level fusion involves combining features from different sources before they are fed into the model. For time-series data, this usually means merging the features from the track data and wheel data into a longer feature vector. The specific steps are as follows:
Data pre-processing: Concatenate the features from the track data and wheel data. After processing the track data and wheel data, these data can be aligned and merged according to their timestamps.
Train the model: Train a LSTM or Transformer model using the combined data. The model will learn features from both the track and wheel data simultaneously.
The choice of fusion method depends on specific needs and the characteristics of the data. Decision-level fusion offers greater flexibility and allows for independent optimization of the models for each data source. Feature-level fusion, on the other hand, may capture more complex interactions across data sources but requires more data pre-processing and can be more challenging during model training. It is crucial to ensure that the data is temporally aligned when implementing any fusion strategy, as this is essential for obtaining reliable fusion results. In this study, since both the track and onboard data were collected with timestamps, vector alignment was relatively easy to achieve, resulting in 11-dimensional data (10 dimensions from track side sensors, 1 dimension from the onboard sensor).
Experiments for wheel flat detection
A series of experiments were conducted in this study. First, the signals obtained from trackside and onboard were individually trained and tested using LSTM and Transformer models. Then, research was conducted based on sensor fusion.
Hyperparameter tuning is essential for optimizing our machine learning models in diagnosing wheel flat faults. We employed Bayesian Optimization26,27 to efficiently search for the best combination of hyperparameters for both our Transformer and LSTM models. This method allowed us to identify optimal settings, such as embedding dimension, number of heads, and learning rate for the Transformer, and hidden size, number of layers, and learning rate for the LSTM, while using fewer computational resources compared to traditional grid or random search methods. 28 As a result, the models achieved improved accuracy and performance. This concise tuning process demonstrates how Bayesian Optimization can effectively refine complex models for better fault detection in railway systems.
Figure 8 shows the training process on trackside and onboard signals with LSTM and Transformer. The horizontal axis represents Epochs, and the vertical axis represents Training Loss and Validation Loss. During the training process, to prevent overfitting, random noise was added at each Epoch to achieve data augmentation. Training automatically stops when the validation loss no longer decreases significantly. The Training and Validation Loss are calculated using the Mean Squared Error (MSE) method, while the final results are expressed in terms of the average error, median error, and maximum error between the estimated values and the actual values.

Training processes for trackside and onboard signals with LSTM and transformer: (a) LSTM – trackside, (b) LSTM – onboard, (c) transformer – trackside, and (d) transformer – onboard.
We also calculate the Percentage of Error (PE) using a standard approach that compares the absolute difference between the estimated and actual values against the actual value. This approach provides an intuitive measure of relative error by expressing the difference between estimated and actual values as a percentage of the actual value. However, in cases where the actual value is zero, it becomes undefined because division by zero is not possible. To address this issue, we add a small constant (in this case, 0.01) to the actual value when it is zero. The adjusted formula for calculating percentage of error becomes:

The addition of a small constant of 0.01 mm (referred to as epsilon) serves two primary purposes. First, it prevents division by zero, ensuring that the percentage of error is always defined. Second, by using a value that is small relative to the typical scale of the actual values, we minimize its impact on the calculated percentage while still providing a meaningful metric. In practical terms, an epsilon of 0.01 mm is chosen based on the required damaged size and the scale of the data. This ensures that situations where the actual value is small (but non-zero) do not produce disproportionately large percentage of errors.
Table 2 presents the comparison between the Transformer and LSTM models for trackside and onboard detection. The Transformer model achieved a lower average error (0.0044 mm) and percentage of error (4.66%) for trackside detection compared to the LSTM model, which had an average error of 0.0385 mm and a percentage of error of 17.83%. Similarly, for onboard detection, the Transformer model also outperformed the LSTM model. The maximum error recorded for the Transformer model was lower in both trackside and onboard detection scenarios. This study focuses on detecting wheel flat damage from the trackside, which led to the deployment of five sensors on the trackside compared to the onboard setup. On the axle box, sensors were only installed on the wheels with known damage to validate the effectiveness of sensor fusion. As a result, the diagnostic performance from the trackside is significantly better than that of the onboard detection.
Errors of transformer and LSTM in trackside detection and onboard detection.

The results suggest that the Transformer model consistently outperforms the LSTM model in both trackside and onboard detection tasks. The lower errors in the Transformer model indicate its superior ability to capture complex patterns in the data, likely due to its self-attention mechanism, which efficiently handles long-range dependencies in time-series data. In contrast, the LSTM model, while effective, shows higher errors, particularly in the onboard detection scenario, where the data characteristics might be more challenging. This highlights the advantage of using the Transformer model for more accurate and reliable wheel flat fault detection.
Since the analysis was conducted on a 1:10 scale test rig, the final diagnostic error needs to be considered in the context of scaling effects. The measurement precision was scaled down based on the law of similarity found in the literature. At a 1/10 scale, a precision of 0.1 mm was scaled down to 0.01 mm and used as the reference value for calculating the percentage of error in this study. When the experimental errors are magnified tenfold, it is evident that only the trackside Transformer-based method maintains an average error below 0.1–0.2 mm. Such a result is significant for real-world operations, particularly in the context of detecting wheel flatness, where precision is critical. Additionally, it is important to note that the maximum error for all methods exceeded 1 mm during detection, which, when accounting for the scaling effect of the 1:10 test rig, presents a challenge for the application of these methods in practice.
After conducting diagnostics on the sensor signals obtained from trackside and onboard using LSTM and Transformer models respectively, this study further explored the effectiveness of integrating these signals through sensor fusion.
Table 3 compares the performance of the Transformer and LSTM models when employing decision-level and feature-level fusion strategies. For feature-level fusion, the Transformer model achieved a significantly lower average error (0.0069 mm) and percentage of error (5.30%) compared to the LSTM model, which had an average error of 0.0293 mm and a percentage of error of 13.59%. In decision-level fusion, both models showed higher errors, with the Transformer still outperforming the LSTM model.
Errors of transformer and LSTM in decision fusion and feature fusion.

The results indicate that feature-level fusion is more effective than decision-level fusion in reducing estimation errors, particularly when using the Transformer model. The significant performance gap between the two fusion strategies suggests that combining features before feeding them into the model allows for better capturing of the interactions between trackside and onboard data. The Transformer model’s strong performance in feature-level fusion further confirms its capability to handle complex, multi-source data effectively. Meanwhile, the higher errors in decision-level fusion, especially with the LSTM model, highlight the limitations of this approach in accurately diagnosing wheel flat faults. This emphasizes the importance of selecting the appropriate fusion strategy based on the specific requirements and data characteristics.
When employing Transformer-based feature fusion, the model exhibits a slightly higher average error (0.0069 mm) and percentage of error (5.30%) compared to the model without fusion. However, it achieves a substantially lower maximum error, reducing it from 1.9879 to 0.0985 mm. This significant decrease in maximum error is particularly advantageous for applications in railway safety monitoring, where extreme estimation inaccuracies can lead to critical oversight of potential faults. Therefore, despite the minor increase in average and median errors, the Transformer-based feature fusion model offers improved reliability and robustness by effectively minimizing extreme errors, making it a more suitable choice for ensuring operational safety and effective fault detection in railway systems.
Figure 9 shows the Training Process for Feature Fusion with the Transformer Model, which demonstrated the best performance in the experiments.

Training process for feature fusion with transformer model.
In conclusion, while both LSTM and Transformer models are capable of predicting wheel-rail damage, the Transformer model consistently delivers better performance, particularly when used with feature-level fusion. The ability of the Transformer model to manage complex, multi-source data, and deliver precise diagnostics justifies its higher computational demands. Feature-level fusion emerges as the most effective strategy, providing a significant enhancement in accuracy and making it the preferred choice for integrated sensor data analysis in railway maintenance applications.
Conclusion and future work
Summary of key findings
Wheelset condition monitoring is critical in railway operations, as undetected wheel flats can lead to severe consequences, including increased wear on both the wheel and track, potential derailments, and costly maintenance. Implementing effective detection systems is therefore paramount for ensuring the safety and efficiency of train operations. Using a test rig, such as the 1:10 scale railway test rig employed in this study, offers a controlled environment to simulate real-world conditions and validate emerging technologies. By combining this experimental approach with advanced machine learning models, it is possible to develop highly accurate diagnostic tools. These tools not only enable early detection of faults but also facilitate continuous improvement of maintenance strategies, ultimately leading to safer and more cost-effective railway operations.
This study demonstrates the superiority of Transformer models over LSTM models in detecting wheel flats in railway systems, particularly when applied with feature-level sensor fusion. The Transformer model achieved a notable average error of just 0.0069 mm and a percentage of error of 5.30%, significantly outperforming the LSTM model in accuracy. Most importantly, the Transformer model’s ability to minimize the maximum error to 0.0985 mm highlights its effectiveness in reducing extreme inaccuracies, which is crucial for maintaining safety in railway operations.
Future research directions
Future research should focus on addressing the challenges associated with scaling the findings from the 1:10 test rig to full-scale railway systems. The transition from a controlled, small-scale environment to the complexities of real-world railway operations presents several obstacles, such as varying operational conditions, differences in material properties, and the need for robust models that can handle the increased noise and variability found in larger datasets. Exploring these challenges will be crucial for ensuring that the diagnostic models developed in a laboratory setting can be effectively applied to actual railway systems. Additionally, research into adaptive algorithms that can recalibrate and fine-tune model parameters in response to real-world data will be essential for maintaining accuracy and reliability in full-scale implementations.
The integration of data from multiple sensors presents a promising avenue for enhancing the accuracy and comprehensiveness of wheel flat detection. Future studies should investigate the benefits of combining data from various sensor types, such as vibration sensors, acoustic emission sensors, and visual inspection systems, to create a more holistic diagnostic approach. By fusing data from different sources, it is possible to capture a broader range of information, improving the detection of subtle or early-stage defects that might be missed when relying on a single type of sensor. Research in this area should also focus on developing advanced data fusion techniques, such as feature-level fusion, to maximize the benefits of multi-sensor integration.
There is significant potential for future research to develop models that not only detect wheel flats but also predict the remaining service life of wheels based on detected defects. Predictive maintenance models could use the data generated from wheel flat detection systems to estimate the rate of wear and the progression of damage, providing railway operators with actionable insights into when maintenance should be performed. Such models would allow for more precise scheduling of maintenance activities, reducing downtime and preventing unexpected failures. Research in this area should aim to refine life estimation algorithms by incorporating real-world operational data and exploring the impact of various environmental and usage factors on wheel wear rates.
This study has practical implications for railway maintenance practices, where precise detection of wheel flats is critical. The study’s results suggest that employing Transformer-based feature fusion can significantly enhance the reliability of fault detection systems. By integrating sensor data from both trackside and onboard systems, this approach not only improves diagnostic accuracy but also mitigates the risk of overlooking severe defects, thereby supporting more proactive and effective maintenance strategies in real-world railway operations.
Footnotes
Handling Editor: Chenhui Liang
Declaration of conflicting interests
The author(s) declared no potential conflicts of interest with respect to the research, authorship, and/or publication of this article.
Funding
The author(s) disclosed receipt of the following financial support for the research, authorship, and/or publication of this article: This project is support by the funding of Anhui Provincial Key R&D Programmes – International S&T Cooperation (No. 202104b11020013).