
Abstract
The thermal management performance of a commercial vehicle engine compartment is crucial for improving overall vehicle performance and promoting green transportation. In this study, a one-dimensional (1D) and three dimensional (3D) CFD co-simulation method has been proposed for the modeling and simulation of thermal management of a commercial vehicle engine compartment. The steady-state temperature and velocity vector distribution in engine compartment has been obtained through 3D CFD approach. With data exchange between the cooling circuit and air conditioning circuit, the mathematical characterizations of the thermal management performance have been further investigated through 1D simulation and validated using test results. The comparison show that the obtained results for thermal management performance are consistent with test results, validating the accuracy of the co-simulation model. The results indicate an obvious thermal backflow phenomenon in the upper area of the intercooler module, causing a high outlet water temperature of the engine cooler. Thus, a deflector structure for eliminating the thermal backflow problem has been presented, and the heat dissipation effect has been analyzed. The co-simulation results show an improvement in cooling performance that the ATO value of cooling circuit decreased by 2.5% and intercooler constant of air conditioning circuit decreased by 12.1%. The proposed 1D/3D co-simulation method provides a reliable reference for developing the thermal management system of commercial vehicle engine compartment.
Introduction
The automotive engineering is facing novel challenges to improve fuel efficiency and reduce emissions in an effort to achieve environmental goals. Thermal management of the engine plays an essential role in addressing these concerns, especially for the commercial vehicles.1,2 The vehicle’s thermal management system, as per the categorization framework, encompasses the engine cooling circuit, air conditioning circuit, turbocharged intercooling circuit, engine lubrication circuit, and intake-exhaust circuit. Heat exchangers, including the radiator, condenser, intercooler, and oil cooler, are situated in the engine compartment, where they interact with various systems and the thermal environment. 3 These heat exchangers, along with the engine compartment conditions, create a coupled system. An integrated thermal management system represents a holistic approach to vehicle thermal management, where the interplay between multiple thermodynamic systems and the underhood structure is considered in assessing their impact on vehicle performance, which is crucial for thermal management research.4,5 In this research, the focus is on the engine cooling circuit and the air conditioning circuit. By integrating multiple thermodynamic systems, an integrated thermal management model is constructed using 1D/3D co-simulation techniques. This model aims to analyze the comprehensive heat transfer processes occurring within the engine compartment.
Within the engineering and academic spheres, various methods such as bench testing, Computational Fluid Dynamics (CFD) analysis, are commonly utilized to examine the flow field and thermal exchange capabilities within the engine compartment, thereby addressing the issue of enhancing heat transfer.6,7 Chen et al. 8 utilized the three-dimensional fluid dynamics simulation technique to compute and model the flow and thermal fields of a vehicle under varying conditions influenced by multiple factors. The findings indicated that the intake grille opening ratio and the sealing baffle significantly affect the heat dissipation system. Jemni et al. 9 conducted a numerical simulation of the flow and temperature fields within engine compartments using a three-dimensional Computational Fluid Dynamics (CFD) model. In this study, the addition of a choke plate and guide plate was found to mitigate the phenomenon of thermal backflow. Sidik et al. 10 utilized the computational fluid dynamics (CFD) approach to model and analyze the airflow through a radiator, and examined the factors influencing the radiator’s performance experimentally. By varying the coolant flow and vehicle speed, they identified the patterns of change that impact the heat dissipation properties. Zhang and Guo 11 conducted an analysis of the cooling performance of a vehicle’s tube-core radiator by varying the cooling wind speed and air volume. Through this process, they derived the radiator’s resistance characteristic curve and a regression equation. This analysis led to the determination of the optimal airflow rate through the radiator and the most effective inlet air pressure. Lee and Kim 12 employed a three-dimensional CFD method to evaluate the impact of installing a drainage plate on the front module of the engine compartment. The analysis revealed that the implementation of the drainage plate resulted in a decrease in both the engine’s inlet temperature and the ambient temperature within the engine compartment. For 1D method, Peyghambarzadeh et al. 13 adopted a one-dimensional thermal management model to analyze the influence of different structural forms of radiators on heat dissipation performance. Costa 14 employed a 1D simulation approach to scrutinize the underhood structures of trucks and automobiles, delineating the effect of airflow distribution on the engine cooling dynamics. By applying the 1D software, Uhl et al. 15 analyzed the underhood heat transfer process among the radiator, the condenser, and the charge air cooler indicating the interactive effects on heat exchangers.
1D simulation effectively assesses the integration of thermal systems, while 3D simulation excels at demonstrating how the position and structure of components affect their performance. As a prevalent approach in thermal management studies, the 1D/3D co-simulation leverages the benefits of both methods, which can not only capture the effects of component placement and structural design on performance, but also facilitates the investigation of performance aspects at the system level.16,17 Baniasadi et al. 18 developed a 3D flow field model of an engine compartment and a 1D cooling system model using KULI and STAR-CCM+ software. The flow field within the engine compartment was simulated using STAR-CCM+. Subsequently, the velocity distribution across the radiator surface was utilized as the boundary condition for the 1D simulation. Lu et al. 19 introduced a characterization technique for the coupling factor designed to downscale the complexity of a 3D model, thereby facilitating a combined 1D and 3D simulation approach. This method was then applied to analyze and enhance the thermal management performance of the entire vehicle. Chang et al. 20 investigated the effects of the grille’s opening and closing on the system’s aerodynamic drag and the engine cooling system through a weak coupling of 1D and 3D software.
Confronted with challenges such as heat damage in the engine compartment caused by excessive temperatures and inadequate heat dissipation within the cooling system, research has been conducted on achieving thermal equilibrium in engine compartment through a combination of experimental and numerical approaches.21,22 In this study, a one-dimensional (1D) and three dimensional (3D) CFD co-simulation method has been proposed for the modeling and simulation of thermal management of a commercial vehicle engine compartment. The steady distribution of temperature field and flow field have been studied in-depth, and the validity of the built model has been verified by the ATD test data. Finally, structural improvement has been performed to improve the cooling performance of the thermal Management system.
Thermal management modeling
1D/3D co-simulation modeling framework
Figure 1 illustrates the comprehensive framework of the thermal management system. The three-dimensional (3D) engine compartment model is built with two parts, the one is for air flow simulation and the other is for heat distribution simulation. The one-dimensional (1D) model including various systems is also built, namely the engine cooling circuit, air conditioning circuit, intercooler circuit, engine lubrication circuit, and intake-exhaust circuit. These models are situated within the engine compartment thermal environment and are governed by a computational control module. The workflow can be described as that firstly the air flow 3D simulation model is initiated to calculate the flow rate of condenser and radiator. And then the result transported to 1D model to calculate the capacity of heat exchangers. But by this time the air temperature is supposed by value which needs to be confirmed by repeating iterations with 3D model. By exchanging data between 1D and 3D model, a synergistic relationship is established, achieving convergence between the 1D and 3D calculation eventually. This interaction facilitates a collaborative 1D/3D simulation approach. The system calculates the thermal parameters for each subsystem under various driving conditions by adjusting the system parameters and environmental settings. 23 This dynamic calculation process is essential for achieving an integrated analysis of the thermodynamic systems, ensuring optimal thermal performance across all vehicle operations. 24

1D/3D co-simulation modeling.
3D CFD modeling for engine compartment
Geometry modeling
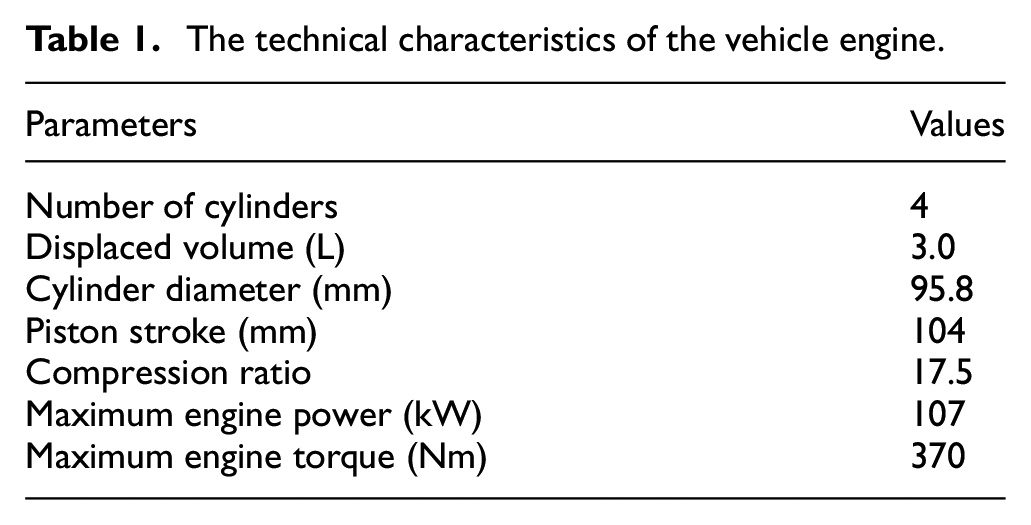
The present work in this paper has been performed within a light-heavy duty commercial vehicle. The technical characteristics of the vehicle engine have been illustrated in Table 1. Due to the multitude of components within the engine compartment, and with the research focus on heat transfer analysis within the compartment, the geometric model of the compartment can be simplified while ensuring computational accuracy. Preliminary geometric cleanup work is performed on the model in the ANSA software, where components such as smaller diameter pipes and wiring harnesses that have a minimal impact on heat transfer are simplified. Figure 2(a) shows the simplified whole vehicle model. The primary subject of the study was the engine compartment, and thus a detailed engine compartment model has been built on basis of the key parts, including the engine bay, cooling fan, intercooler, radiator, and condenser, as depicted in Figure 2(b).
The technical characteristics of the vehicle engine.

The simplified model: (a) whole vehicle and (b) engine compartment.
CFD modeling
In this study, the CFD simulation has been performed in Star-CCM+, as shown in Figure 3. The dimensions of the computational domain for the external flow field were configured as follows: its height was five times that of the whole vehicle model, the width was seven times the width of the model, the outlet’s length was six times the model’s length, and the inlet’s length was three times the length of the model, as depicted in Figure 3(a). In the numerical simulation, the external flow field domain has been meshed with solid elements, and the heat dissipation module has been modeled using a refined mesh technique. The built CFD model contains a total of 34.67 million elements.

The CFD mesh model: (a) external flow field model and (b) refined vehicle model.
The boundary condition of engine compartment inlet is set as a velocity inlet, and the velocity value is consistent with the vehicle velocity. The air outlet is set as pressure-out boundary condition, with a pressure of 0 Pa. The environment temperature is defined as 45°C. The region encompassing the fan’s rotation is designated as a dynamic zone by defining a rotational speed, which is analyzed using a multi-reference frame approach. The boundary conditions for the fan are set using the momentum source method. The momentum source is loaded by inputting the fan’s P-Q curve to accurately simulate the fan’s rotation. With the captured fan’s P-Q test results, the rotational speed at various operating conditions can be determined through data fitting and interpolation process. The other areas are configured as static zones.
The heat exchangers including condenser, intercooler, and radiator are modeled using a radiator-wall approach to calculate the heat transfer. The inlet of the heat exchanger is set with an interior-face boundary condition that permits unrestricted airflow across the surface. The flow mass rate and temperature values featuring the air sate of heat exchanger are obtained in this surface and exported to the 1D simulation process. The outlet is set with a radiator-wall surface. The flow resistance of heat exchanger is defined with porous model. Further, the pressure drop experiments have been on basis of the bench in Figure 4. As shown in Figure 4, the heat exchanger sample has been placed between the hyperbaric and hypobaric chamber, and the state-steady pressure of the air flowing through the heat exchanger sample has been measured through the direction of sample thickness. Thus, the pressure drops per meter

in which

The pressure drop experiment of heat exchanges.

The pressure drop per meter
On basis of the pressure drop curves in Figure 5, the inertial and viscous resistance coefficients for the heat exchangers have been obtained, as listed in Table 2. With the built model, the air flow state and temperature distribution of engine compartment can be obtained in different external environments and driving conditions.
Porous media coefficients for the heat exchangers.

1D modeling for the cooling system
The cooling process of a cooling system is as follows: The water pump circulates the coolant into the engine’s water jackets or the transmission, where it absorbs the heat from the engine or transmission, causing the temperature of the coolant to rise. Then, the coolant is pumped into the heat exchanger, where it exchanges heat with the cooler air in the engine compartment, thereby reducing the temperature of the coolant. After that, the coolant returns to the water pump and is once again pressurized into the engine’s water jackets or the transmission.
On basis of the virtual parts and layout of the cooling system, a one-dimensional (1D) thermal fluid simulation model of the cooling system has been built in Flowmaster in this study, as shown in Figure 6. The model consists of two main circles: the air side and the water side. The air side is composed of the pressure drop caused by the air passing through the grille, oil cooler, condenser, radiator, fan, intercooler, and the engine compartment resistance module behind the fan (represented by a “Loss” element). In which, the pressure drop

Where
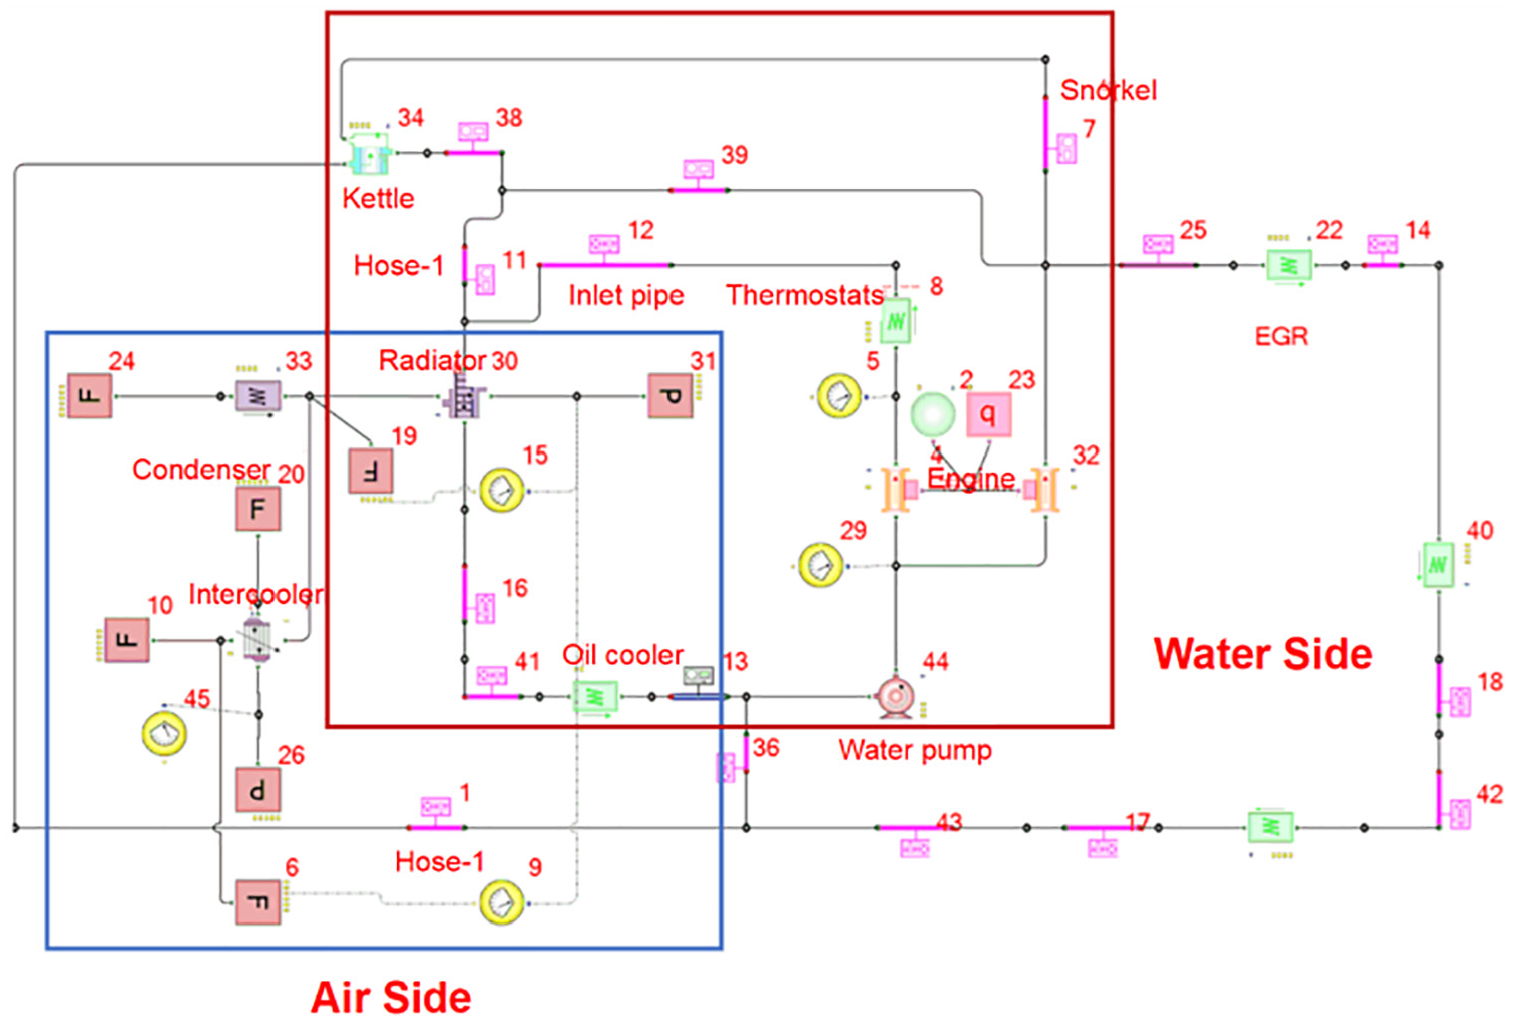
1D thermal fluid simulation model of the cooling system.
Thermal management performance analysis
Air to Derating (ATD) test
In this study, a standard Air to Derating (ATD) test has also been performed to evaluate the thermal management performance of the vehicle engine cooling system, and determine the crucial working condition for further investigation. As shown in Figure 7(a), a trailer is connected behind the test vehicle, and the engine speed conditions of the test vehicle are ensured by controlling the trailer. During the ATD test, the throttle is fully open and the technical characteristics of the engine and vehicle can be referred in Table 1. And then various test parameters including engine temperature, water temperature, coolant flow rate, etc., are monitored and recorded in real time during the test process. By referring to the engine characteristic curves in Figure 7(b), three crucial working conditions have been adopted to perform the ATD tests, including the maximum power and maximum torque conditions. Among them, the maximum power condition is sets at an engine speed of 3500 rpm, and the maximum torque conditions are set at the speed of 2500 and 1500 rpm respectively. The specific simulation settings are obtained and listed in Table 3.

Air to derating test: (a) road test setting and (b) engine performance curve.
Specific simulation settings for thermal management performance analysis.

Air flow and temperature distribution characteristics
Figure 8 shows the velocity vector and temperature distribution cloud map of the engine compartment under the maximum power condition (3500 rpm). As observed in the middle longitudinal cross-section Y = 0 mm in Figure 8(a), the air intake side of the intercooler’s cold end is not directly facing the upper grille, and there is a relatively large gap between the intercooler and the upper grille. Thus, a large amount of cooling air pass through the upper grille and directly flow into the radiator, while only a small amount of air entering through the cold end of the intercooler. This is not conducive to cooling the high-temperature gases at the hot end, evidently reducing the cooling performance of the cooling system.

Velocity vector and temperature distribution (maximum power condition, N = 3500 rpm): (a) middle longitudinal cross-section Y = 0 mm and (b) middle horizontal cross-section Z = 600 mm.
In the middle horizontal cross-section Z = 600 mm in Figure 8(b), there is an obvious thermal backflow phenomenon occurring in the upper area of the intercooler module, resulting in the central cooling area not achieving its full heat exchange potential. Furthermore, the hot air from the backflow mixes with the cooling air, leading to an increase in the temperature of the air entering the intercooler. This, in turn, diminishes the overall heat exchange efficiency of the cooling system.
Figure 9 shows the velocity vector and temperature distribution cloud map of the engine compartment in the middle longitudinal cross-section Y = 0 mm under the maximum torque condition (N = 2500 rpm and N = 1500 rpm). From Figure 9(a), when working at 2500 rpm, the high-temperature zones within the engine compartment are primarily located between the radiator and the engine, reaching a peak temperature of 117.21°C. This is an increase of 2.39°C compared to the maximum power condition, which recorded a temperature of 114.82°C. Under the steady-state flow simulation environment, the temperature of the high-temperature areas in the maximum torque condition is 2°C–3°C higher than that under the maximum power condition. When working at 1500 rpm, the peak temperature reaches 129.03°C, showing an 11.82°C increase compared with that at 2500 rpm, seeing Figure 9(b). This indicates that when working under the maximum torque condition at a lower speed, the engine compartment is more prone to heat retention phenomena due to the slower flow within the compartment.

Velocity vector and temperature distribution in the middle longitudinal cross-section Y = 0 mm (maximum torque condition): (a) N = 2500 and (b) N = 1500.
Cooling performance analysis
By performing the above 3D CFD simulations, the convergence values of the mass flow rate in each cooling module under different working conditions have been obtained, as shown in Figure 10. It can be seen that the mass flow rate in condenser varies around 1.125 kg/s under different conditions, while there is almost no difference seen in the flow rate in radiator and intercooler under different conditions, maintaining at 2.58 and 0.62 kg/s respectively. Using the flow rate values of each cooling module as input for 1D simulation, the 1D numerical simulations for cooling system have been performed, and the engine’s outlet water temperature and the intercooler’s hot-end outlet air temperature have been obtained, as shown in Figure 11. It can be seen that the engine’s outlet water and intercooler’s outlet air temperature converge to 95.1°C and 72.3°C under maximum power condition (N = 3500 rpm; Figure 11(a)), 95.4°C and 71.4°C under maximum torque condition (N = 2500 rpm; Figure 11(b)), 82.3°C and 57.8°C under maximum torque condition (N = 1500 rpm; Figure 11(c)).

The mass flow rates in each cooling module under different working conditions.
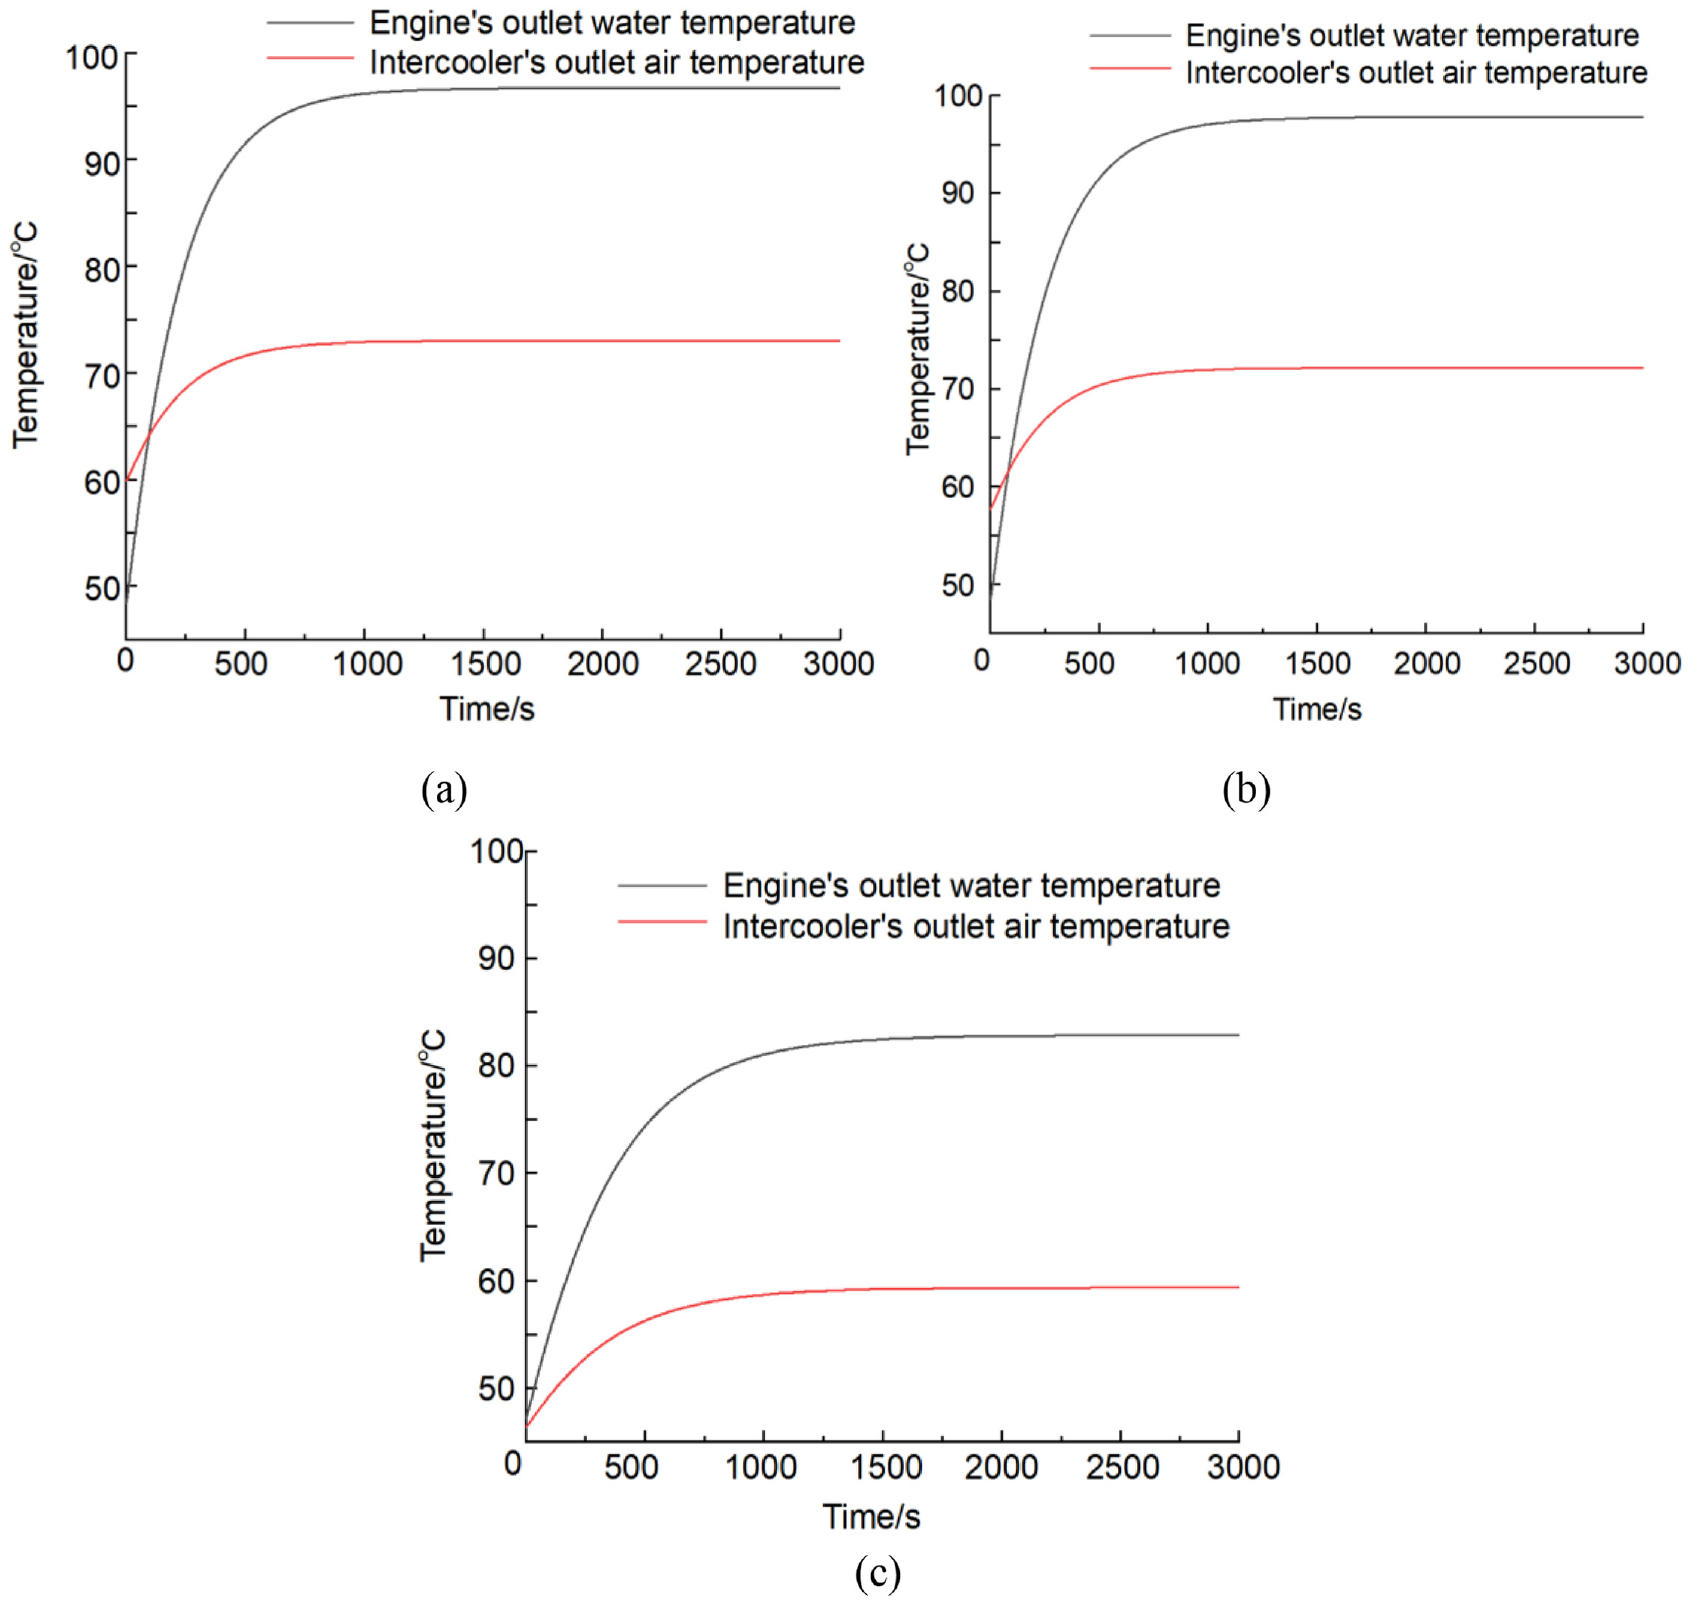
Engine’s outlet water and intercooler’s outlet air temperature: (a) maximum power condition (N = 3500 rpm), (b) maximum torque condition (N = 2500 rpm), and (c) maximum torque condition (N = 1500 rpm).
On basis of the performed 1d simulations, the cooling performance of the thermal management system has been further analyzed, and the mathematical characterizations of the thermal management performance have been obtained and listed in Table 3. Additionally, the ATD test results have also been listed in Table 4 in comparison with simulation results for model validation. It can be seen from the Table that the simulation results from 1D/3D co-simulation method agree well with the test result within a maximum error of 6%. In this study, two indexes namely ATD value and intercooler constant have been adopted to evaluate the cooling performance of the thermal management system, which can be calculated on basis of the mathematical characterizations. The higher the ATD value and intercooler constant is, the lower efficient cooling system is. The calculated values have also been listed in Table 3. Among the three crucial conditions, the ATD and intercooler constant both reach the highest values of 60.3°C and 28°C when working under maximum power condition (N = 3500 rpm), exceeding the engineering allowable range. This might because of the thermal backflow phenomenon leading to the increase in the temperature of the air in intercooler. Thus, further structural improvement has been performed for solving the thermal backflow issue and the maximum power condition (N = 3500 rpm) has been adopted as the target condition.
ATD test and 1D simulation results for cooling performance.

Structural improvement
To effectively address the thermal flowback issue, this study proposes three improvement strategies aimed at optimizing the cooling performance of the intercooler and enhancing the overall system efficiency:
Strategy One: Adding a deflector plate above the intercooler to effectively guide the cooling air from the upper grille to the vicinity of the intercooler’s air intake. This design significantly increases the intake volume of the intercooler, ensuring that more cooling air directly enters the intercooler, thereby enhancing its operational efficiency. Strategy Two: Adjusting the opening direction of the upper grille to change the flow path of the cooling air, directing it more directly into the intercooler. This strategy optimizes air flow, improves cooling efficiency, and reduces the occurrence of thermal flowback. Strategy Three: Raising the spatial position of the intercooler to expose it more directly to the flow of cooling air. By increasing the direct area of the intercooler exposed to the airflow, this strategy helps to fully utilize the cooling air, further lowering the temperature of the intercooler and enhancing the cooling effect.
Among them, Strategy Two involves structural improvements to the grille, which is more costly in terms of research and development. In comparison, Strategy One, which involves adding a deflector plate, is more feasible for implementation in engineering. Therefore, after comprehensive consideration of various factors, Strategy One was chosen to improve the design of the engine compartment structure. The implementation of Strategy One not only allows for more reasonable cost control but also effectively enhances cooling efficiency, ensuring the design’s practicality and operability. The comparison between the geometric models before and after the improvement is shown in Figure 12.

Structural design of engine compartment: (a) original model and (b) improved model with deflector.
The 1D/3D co-simulation has been performed on basis of the improved model. Figure 13 shows the velocity vector and temperature distribution cloud map of the improved engine compartment. As observed in the middle longitudinal cross-section Y = 0 mm in Figure 13(a), through installing the deflector plate, a large amount of cooling air entering from the upper grille is directed to the air intake of the intercooler, increasing the airflow into the intercooler. Concurrently, the temperature behind the radiator has been reduced from 114.82°C to 112.15°C, which has improved the thermal flowback phenomenon. In the middle horizontal cross-section Z = 600 mm in Figure 13(b), due to the deflector plate, the velocity of the airflow near the cooler has been decreased. The temperature behind the radiator has decreased from 115.42°C to 113.74°C, evidently reducing the temperature of the high-heat areas within the engine compartment and enhancing the cooling performance.

Velocity vector and temperature distribution for the improved model: (a) middle longitudinal cross-section Y = 0 mm and (b) middle horizontal cross-section Z = 600 mm.
Through further 1D simulation, the ATD value and intercooler constant for the improved model have also been obtained, as listed in Table 5. It can be seen that, compared with the index of the original model, the flow rate of the intercooler has significantly increased by 17.6% and the flowback rate has notably decreased by 15.9%. The intercooler constant has decreased from 28°C to 24.62°C, and the ATD value has decreased from 60.3°C to 57.78°C, meeting the engineering requirements.
Cooling performance comparison before and after.

Conclusions
In this study, a 1D/3D co-simulation method has been proposed and adopted for the thermal management of a commercial vehicle engine compartment. The temperature and velocity vector distribution in engine compartment has been obtained, and the mathematical characterizations of the thermal management performance have been further investigated. The simulation results proved to agree well with ATD test results, proving the validity of the proposed method. The findings of the present study can be summarized as follows:
A 1D/3D co-simulation framework has been proposed, and in which the 3D simulation is primarily responsible for flow and heat distribution analysis and 1D simulation is used to investigate the cooling capacity of heat exchangers. By exchanging data between 1D and 3D model, a synergistic relationship is established, facilitating a collaborative 1D/3D simulation approach.
A good agreement has been achieved between the ATD test and co-simulation results for thermal management performance, showing a steady distribution of temperature field and flow field. The index for assessing cooling performance, namely ATD value and intercooler constant, have been calculated.
The co-simulation results indicate an obvious thermal backflow phenomenon in the upper area of the intercooler module, causing a high outlet water temperature of the engine cooler. This thermal backflow problem leads the higher ATD value and intercooler constant, exceeding the engineering allowable range.
A deflector structure has been presented to eliminate the thermal backflow problem, and the co-simulation results show that the airflow into the intercooler has been significantly increased. For the improved model, the ATO value of cooling circuit decreased by 2.5% and intercooler constant of air conditioning circuit decreased by 12.1%, thereby improving the performance of the engine compartment cooling system.
The proposed 1D/3D co-simulation method can be adopted to study the flow characteristics within an engine compartment and the performance of engine cooling system, providing a reliable reference for developing the thermal management system of commercial vehicle engine compartment. The directions for further research may aim at the co-simulation methodology enabling whole vehicle model architecture development with reduced costs and developing fast running models.
Footnotes
Handling Editor: Pak Kin Wong
Declaration of conflicting interests
The author(s) declared no potential conflicts of interest with respect to the research, authorship, and/or publication of this article.
Funding
The author(s) disclosed receipt of the following financial support for the research, authorship, and/or publication of this article: This work was financially supported by the Key Natural Science Research Projects of Anhui Provincial Higher Education Institutions (Project numbers: 2022AH052665, 2022AH052668).
Data availability
Data will be made available on request.