
Abstract
This paper proposes a new criterion for selecting the optimum number of Intrinsic Mode Functions (IMFs) from vibration signals measured on rotating machines. The criterion is based on calculating the variation of normalized Shannon entropy (
Keywords
Introduction
In industrial settings, fault detection in rotating machinery has always been critical for predictive maintenance procedures to ensure equipment reliability and peak performance. Vibration analysis is one of the primary diagnostic tools for detecting faults, as it can identify potential issues throughout the equipment through measurement and signal processing. Effective vibration diagnostics can help prevent catastrophic failures that result in unplanned downtime, production losses, and safety hazards. It also helps to plan maintenance operations like adjustment, troubleshooting, and repair. This is why fault detection based on vibration monitoring has remained a popular research topic.
The literature is rich with numerous studies focusing on diagnostics using classical methods, which include time-domain, frequency-domain, and time-frequency domain analyses. 1 Early works concentrated on time-domain analysis of raw vibration signals,2,3 using scalar indicators sensitive to signal shape to indicate fault presence.4–7 Subsequently, frequency-domain analysis via FFT has been extensively employed, yielding satisfactory results,8,9 especially with the development of FFT algorithms such as power spectra 10 and bi-coherence. 11 Cepstral analysis has also been introduced and proven advantageous for rapid fault detection.12,13 High-frequency resonance techniques like envelope analysis have been utilized in the time-frequency domain.14,15 More recent studies have incorporated advanced algorithms, such as enhanced Kurtogram 16 for efficient extraction of fault-induced impulses cyclostationary 17 analysis, which has shown its superiority over other methods. Kebabsa et al.18,19 used frequency modulation techniques to detect bearing and gear faults in an industrial environment, employing the cyclostationarity method. Other decomposition techniques, such as empirical mode decomposition (EMD) 20 and its variants, have been used to improve fault detection, including Ensemble Empirical Mode Decomposition (EEMD), 21 Complete Ensemble Empirical Mode Decomposition with Adaptive Noise (CEEMDAN), 22 and Improved CEEMDAN (ICEEMDAN). 23
Recent advances in fault diagnosis research have centered on improving accuracy and reliability through novel methods. Kebabsa et al., 24 for example, developed an innovative spectral analysis control approach that optimizes predictive maintenance in critical industrial machinery by using the Overall Level (OL) indicator. Hou and Pan 25 used the Teager-Kaiser Energy Operator (TKEO) and envelope spectral analysis to detect faults in reciprocating compressors, which improved signal clarity by removing noise. Damou et al. 26 developed a hybrid method for automated bearing fault classification that combines ensemble empirical mode decomposition (EEMD) and wavelet packet transform (WPT), resulting in high diagnostic accuracy using machine learning algorithms. Furthermore, Imane et al. 27 addressed the issue of variable operating speeds in machinery by proposing a multistage classifier that efficiently diagnoses bearing faults using empirical wavelet transforms. These recent contributions represent significant advances in fault diagnosis, combining advanced signal processing techniques with machine learning algorithms.
Wavelet analysis, widely adopted in recent research, both in its continuous28,29 and discrete forms, 30 has yielded promising results. The initial use of wavelets for vibration signal analysis was pioneered by Wang and McFadden, 31 who applied it to gearbox vibrations of a helicopter, successfully localizing gear faults. Nikolaou and Antoniadis 32 introduced wavelet transform as an alternative method to traditional time-frequency analysis for bearing fault detection, using data collected on a test platform, showing promising results for monitoring rotating machinery conditions. Other studies have utilized continuous wavelet transform (CWT) as diagnostic tools for gear fault detection, as seen in the works of Sung et al., 33 Akira et al., 34 and Meltzer and Dien. 35 In Djebala et al.’s study, 36 the optimization of Wavelet Multi-Resolution Analysis (WMRA) using kurtosis as an optimization criterion was conducted to determine the number of decomposition levels, relevant detail, and other parameters. This technique has been successfully applied in Djebala et al. 37 for bearing fault detection, demonstrating excellent performance in fault detection. Additionally, various studies have combined wavelet analysis with other analytical methods, resulting in significant advancements in the field.38–41
In the literature, research on Variational Mode Decomposition (VMD) focuses on two main axes: its application for fault diagnosis and the optimization of its parameters. 42 In the first axis, notable studies include Mohanty et al., 43 who employed VMD to decompose measured signals from a ball bearing. FFT analysis of the resulting Intrinsic Mode Functions (IMFs) demonstrated VMD’s superiority in health monitoring of bearings compared to EMD, even in the presence of noise. An et al. 44 performed envelope demodulation on IMFs obtained via VMD from a gear fault signal, showing the method’s effectiveness in both simulated and real signal processing for gear fault detection. Mahgoun et al. 45 investigated VMD’s efficacy in diagnosing gear faults under variable speed conditions. Wang et al. 46 applied VMD combined with envelope spectrum for gear fault detection. Chen et al. 47 proposed a scheme for gearbox fault detection using VMD to extract acoustic emission features, successfully diagnosing a failure. Lin et al. 48 further advanced by combining VMD with probabilistic neural networks for gear fault detection, achieving excellent results that affirm the advantages of VMD. In the second axis, focusing on VMD optimization, Li et al. 49 introduced an independent-oriented VMD using locally weighted scatterplot smoothing (LOWESS) for a more reliable and stable selection of the number of intrinsic modes. Feng et al. 50 suggested choosing an appropriate number of IMFs (K) based on spectral characteristics. Zhang et al. 51 used correlation and energy ratio iteratively to determine K. Jiang et al. 52 utilized initial central frequencies as an optimization strategy to obtain effective intrinsic modes. Jiang et al. 53 proposed a coarse-to-fine decomposition technique where VMD is applied to evaluate different signal types for early fault detection in rotating machinery. Numerous other studies have explored various techniques,54–59 significantly advancing vibrational analysis in this field.
Despite extensive research into fault detection using VMD, current methods for optimizing the number of intrinsic modes continue to face challenges in terms of accuracy, computational complexity, and robustness, particularly when dealing with highly noisy industrial signals. Existing techniques frequently lack simplicity and effectiveness, particularly in real-time applications for rotating machinery. To improve fault detection in the presence of highly noisy signals, a simpler and more effective method for determining the optimal number of intrinsic modes is needed. This article aims to close these gaps by proposing a new optimization criterion for IMFs, which will improve the VMD process and be combined with WMRA to improve fault detection performance.
This manuscript is structured as follows: Section “Mathematical formulation” describes the mathematical formulations of the methods used in this article. Next, the proposed approach is explained in Section “Proposed approach.” Section “Numerical simulation” contains a numerical simulation. We move on to Section “Experimental study,” where we present the experimental study, followed by the results and discussion in Section “Results and discussions.” Section “Industrial application of the combined and optimized VMD-WMRA approach” gives an industrial application of the proposed approach. Finally, a brief conclusion is presented in Section “Conclusion.”
Mathematical formulation
This section gives an overview of the signal decomposition process using Variational Mode Decomposition (VMD) and Shannon Entropy (SE) theory, as well as the fundamentals of Wavelet Multi-Resolution Analysis (WMRA). The aim is to help readers acquire a more comprehensive understanding of the background and functioning of these techniques.
Variational mode decomposition (VMD)
Variational mode decomposition (VMD) is an adaptive and innovative data-driven signal processing method proposed by Dragomiretskiy and Zosso
60
that decomposes signal S(t) into their band-limited Intrinsic Modes Functions (IMFs) named

where,
The IMFs provide several components related to detecting faults that cause resonance in the measured signal in the context of diagnosing faults in rotating machinery. The augmented Lagrangian L 60 was introduced to address the minimization problem proposed in equation (1):
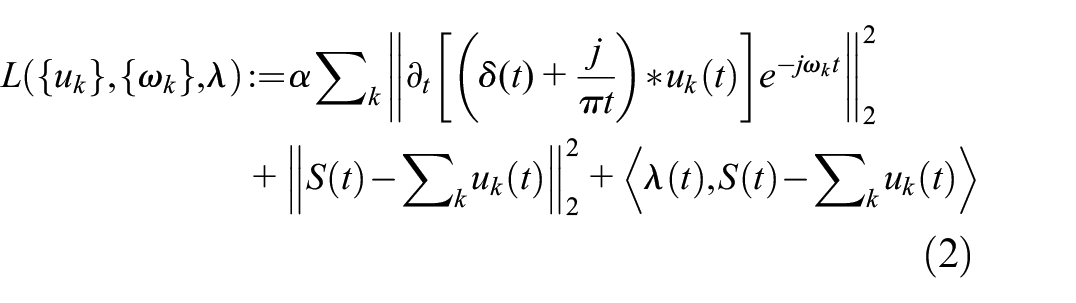
where,
The solution is then obtained through an iterative sub-optimization sequence known as the alternate direction method of multipliers (ADMM),
60
where we can find an estimation of the components
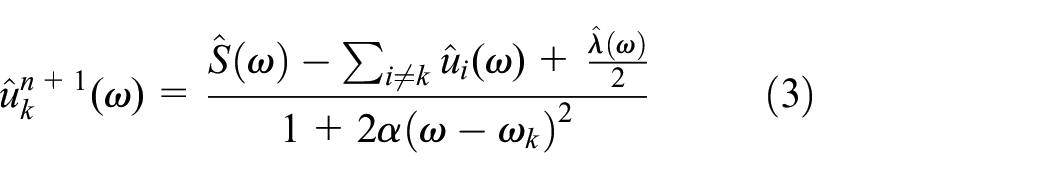

In equations (3) and 4),
Shannon entropy (SE)
Shannon entropy (SE) is a measure of the uncertainty or randomness of a probability distribution. 61 It is calculated as follows (equation (5)):

where,
SE is a measure of the uncertainty and information in the vibration signal produced by a gearbox in gear fault detection. It is used to quantify the degree of randomness obtained from gears, which aids in the detection of gear failures early. 62 Thus, SE can offer a useful criterion for analyzing and measuring the similarity of vibratory signals. 63 The similarity between the IMFs of a signal in this work case is based on changes in the frequency spectrum of the vibration signal.
Wavelet multi-resolution analysis (WMRA)
Wavelet multi-resolution analysis (WMRA) is a highly effective signal-processing method that has grown in popularity in recent years. It employs the wavelet transform, a mathematical technique for representing a signal S(t) using functions derived from the expansion and translation of a singular function known as the wavelet mother
The wavelet family (equation (6)) takes the following form 65 :

Giving that

If we replace

DWT then involves a waterfall decomposition, as proposed by Mallat, 66 which separates the signal using low and high pass filters, resulting in two vectors containing:
- approximation coefficients
- detail coefficients
During the decomposition process, these vectors are down-sampled and then passed through two additional reconstruction filters to obtain approximations

Djebala et al. 36 proposed an optimization of WMRA (OWMRA) that is specifically designed to analyze shock signals. Using kurtosis as an optimization criterion, this optimized version selects various parameters to determine the number of levels required for analyzing gear defects. The number of levels 36 is expressed as:

where,
Proposed approach
The approach aims to detect gear faults in highly noisy signals. To improve diagnostic results, we propose a new criterion that uses the normalized variation of Shannon entropy between two successive IMFs to determine the optimal number of IMFs required for decomposing vibration signals using Variational Mode Decomposition (VMD). WMRA is then used to demodulate the obtained IMFs, which improves fault detection. The detailed methodology of the proposed procedure, as shown in the flowchart of Figure 1, is outlined below:
Measure the vibrational signals and calculate their Shannon Entropies (SE).
Introduce the signal decomposition parameters for VMD, such as the initial number of IMFs, which should be set relatively high (k0 = 20 to 30) for fault detection. Other parameters, such as the bandwidth constraint (α) and tolerance, are chosen based on the works of Dragomiretskiy and Zosso 60 and Zhang et al. 51
Start the iterations at the VMD level, where j varies from 2 to k0 with a step of 1, calculating the Shannon Entropy for each IMF, denoted as

Verify the proposed stopping criterion
By stopping the iterations, we are able to determine the appropriate number of IMFs by taking
Finally, the selected IMFs will be processed using WMRA to identify the IMFs’ demodulation frequencies (for example, bearing resonance frequencies, gear meshing frequencies, and belt resonance frequencies), allowing us to understand the nature of the fault.

The flowchart of the proposed approach for fault detection.
Numerical simulation
Determining the number of IMFs in a sinusoidal signal
Tests on a simulated signal
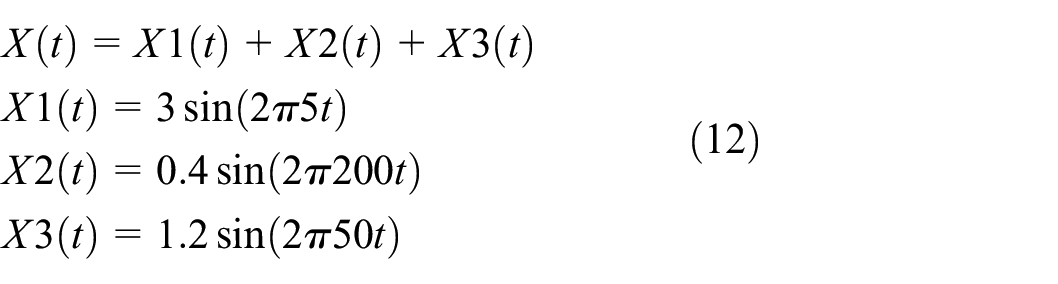

Three simulated sinusoidal signals.

The signal obtained from the sum of the three simulated signals.
In this example application, we already know the exact number of IMFs in the signal
Each of the IMFs obtained should represent a different component of the signal
The decomposition of the signal
Criterion values
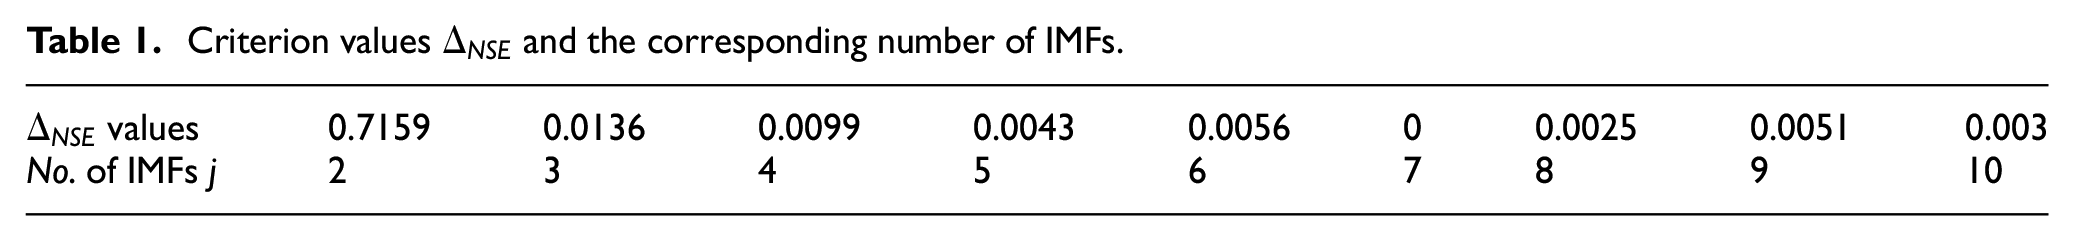
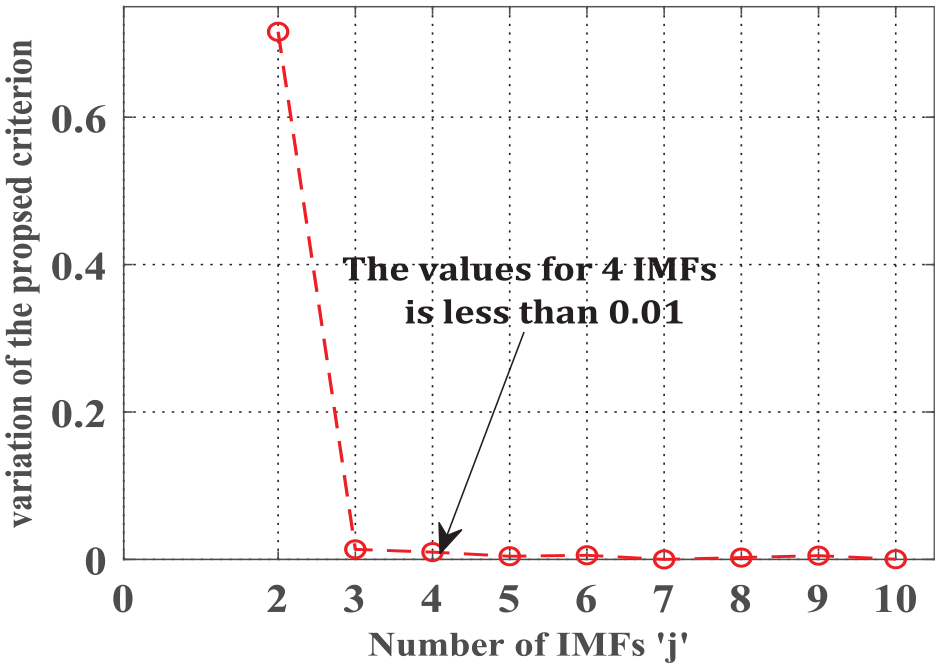
Variation of the proposed criterion
Figure 5 depicts the decomposition of the signal

The resulting IMFs from VMD for K = 3.
To further validate our criterion, Figure 6(a) and (b) show the representations of the IMFs obtained from the VMD decomposition for

Resulted IMFs from VMD: (a) for K = 2 and (b) for K = 4.
In Figure 6(b), (
Numerical simulation of gear faults
Gear faults appear on the spectra and envelope spectra at the rotation frequencies of the shafts on which the gear wheels are mounted. For each pair of gears, the amplitudes of these rotation frequencies will be amplified at the gear mesh frequencies and their harmonics. As a result, it is prudent to choose these resonance frequencies and conduct in-depth analyses around them. The combined approach proposed in this article, “VMD-WMRA,” based on the proposed criterion, can be used to diagnose this type of fault very effectively.
A gear fault signal S
en
(t) is simulated in this section using the mathematical model provided by Capdessus and Sidahmed.
68
Figure 7 depicts a gearbox with three shafts rotating at frequencies of 15, 12, and 17 Hz, respectively. The gear wheels mounted on the first and third shafts have


Gearbox configuration: schematic representation.
where,

The simulated gearbox has two gear mesh frequencies, F m 1 and F m 2, which correspond to the meshing of the first and second shafts, as well as the second and third shafts. Faults were simulated on the intermediate shaft gearwheel Z2 and output shaft gearwheel Z4.
The simulated signal and its spectrum of the two gear faults are shown in Figure 8. The appearance of the two gear mesh frequencies (F m 1 and F m 2) and their harmonics is clearly visible in the spectrum. A quick zoom around the gear mesh frequencies reveals that they are modulated by the rotation frequencies F r 2 and F r 3, which correspond to faults on gearwheels Z2 and Z4, respectively. Therefore, the simulated signal accurately represents the frequency characteristics of the gearbox gears.

Simulated signal
Figure 9 shows the decomposition of the signal-simulating gear faults using the VMD method based on the proposed criterion, which yields four IMFs. The proposed criterion based on Shannon Entropy has the primary advantage of reducing the number of IMFs that may contain information about the presence of potential faults. Thus, it simplifies and improves the combination of the two signal processing methods, VMD-WMRA. VMD can provide an accurate diagnosis for simulated signals or signals measured with minimal noise. However, as we will see in the following section, for superior diagnostic effectiveness in the case of highly noisy signals, VMD must be combined with WMRA.

Variation of the
The signals and spectra of the four IMFs are shown in Figure 10. It is possible to detect extremely effective isolation of the gear mesh frequencies and some of their harmonics, allowing us to perform a more precise diagnosis of potential gearbox failures.

IMFs obtained from VMD of simulated signal
The application of WMRA to each of the four IMFs from Figure 10 yields envelope spectra for each, as shown in Figure 11. As shown in Figure 11(a), IMF 1, which covers the first gear mesh frequency

Envelope spectra obtained from WMRA for each IMF: (a) IMF 01, (b) IMF 02, (c) IMF 03, and (d) IMF 04.
Experimental study
The vibrational signals processed in this section were measured on the test bench designed and manufactured at the Laboratory of Mechanics and Structures at the University of Guelma, Algeria (Figure 12(a)). It comprises the following components:
a 2.2 kW electric motor with a rotation speed of 1500 rpm,
an elastic coupling for transmitting motion between the motor and the gearbox,
a gearbox with mechanical characteristics provided in Table 2,
an electromagnetic brake for applying various loads to the gearbox, and
a V-ribbed belt for transmitting motion between the output shaft and the electromagnetic brake.

The experimental setup: (a) test rig and (b) defected gear.
Used gears and characteristic frequencies.

An experimental setup was designed with the same mechanical components as the previously simulated gearbox to validate the results of the numerical simulation presented in Section “Numerical simulation.”
Table 2 lists all the mechanical characteristics of the gears, including the transmission ratios for each mesh stage (U1 and U2), the rotation frequencies of the three shafts (F r 1, F r 2 and F r 3) and gear mesh frequencies (F m 1 and F m 2), for two different rotation speeds of the electric motor.
The vibrational signals were measured experimentally for both rotation frequencies of 14 and 23 Hz, with and without gear faults, using the Bruel & Kjær PULSE 16.1 analyzer and the Pulse LabShop acquisition software, as shown in Figure 12(a) Three Bruel & Kjær type 4533-B accelerometers were used, one on each meshing stage of the gearbox housing in the horizontal direction.
Four vibrational signals in the frequency range of 6400 Hz were measured and will be processed using the proposed method: two without gear faults (S1, S2) and two with gear faults (S3, S4) for both rotation frequencies, as shown in Figure 13. These signals will be processed using the proposed method.

Vibratory signals measured for different cases: (a) S1 without gear defect and
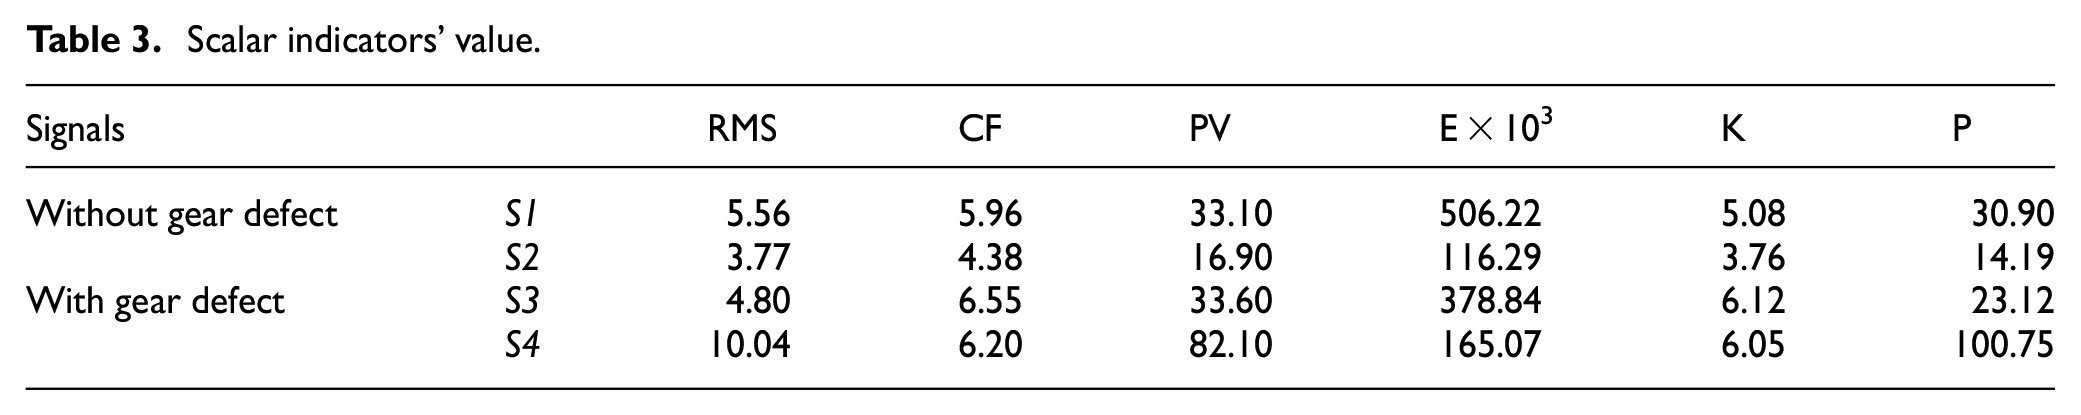
In order to achieve an accurate diagnosis of the measured signals, an analysis of scalar indicators is essential. In this study, a set of six scalar indicators were calculated and are presented in Table 3. Some of these indicators are sensitive to the signal’s energy, such as the peak value (PV), root mean square (RMS), energy (E), and power (P). Other indicators are sensitive to the signal’s shape, such as kurtosis (K) and crest factor (CF). By examining the magnitudes of the calculated indicators, it is clear that the signals contain defects other than the experimentally simulated defects on the gear wheels and are also highly noisy. For signal S1, without gear fault, the kurtosis value reaches 5.08, whereas, in the absence of shock defects, its value should not normally exceed 3. The presence of a high noise level in the various signals will make fault detection difficult and will require a high-performance diagnostic method. These observations highlight the importance of proposing a robust diagnostic method to identify faults despite the significant noise in the signals. An in-depth analysis based on the proposed approach will be necessary for accurate fault detection in the studied gearbox.
Scalar indicators’ value.
Results and discussions
This section is devoted to the experimental validation of the proposed method for detecting gearbox faults. As previously stated, the selected signals from the experimental setup (S1, S2, S3, and S4) are measured for two different system health states, the first without gear faults (S1 and S2) and the second with a gear fault (S3 and S4), at two different speeds,
The work begins with WMRA processing the four signals. The obtained results will be compared to those obtained by applying the proposed approach, which consists of determining the optimal number of IMFs based on the proposed criterion, decomposing the same signals using VMD, and finally processing each IMF obtained using WMRA.
Signal processing without gear fault
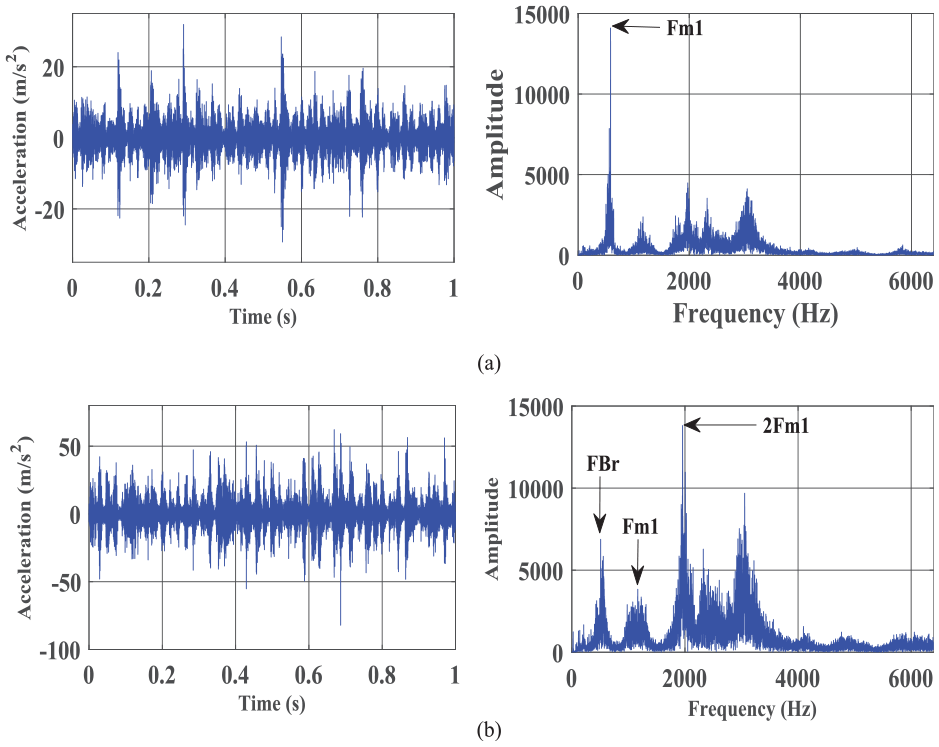
The signals S1 and S2, along with their corresponding spectra, are presented in Figure 14. These signals, without gear faults in the gearbox, show abnormal values of the scalar indicators, indicating the presence of another type of defect.

Signals without gear defects and their corresponding spectra: (a) S1 with F r 1 = 14 Hz and (b) S2 with F r 1 = 23 Hz.
In the case of S1, shown in Figure 14(a), spectral analysis shows the dominance of the meshing frequency F m 1, which has overwhelmed the rest of the frequencies, making the diagnosis difficult and thus requiring more advanced signal processing methods. On the other hand, for S2, presented in Figure 14(b), we can clearly see the noise present in the signal. The corresponding spectrum shows the appearance of the meshing frequency F m 1 and its harmonic 2F m 1, where the amplitude of 2F m 1 is about 1.5 times higher than that of F m 1, which corresponds to an insufficient inter-axial clearance defect (insufficient backlash at the tooth root).
Results obtained by WMRA
The processing of the two signals, S1 and S2, by WMRA for the two rotational speeds gives the envelope spectra shown in Figure 15. It can be observed that the amplitudes of the harmonics of the input shaft’s rotational frequencies 2F r 1, 3F r 1, and 4F r 1 are higher than that of the fundamental frequency F r 1, indicating the presence of misalignment of the input shaft. The misalignment is much more pronounced, especially at the rotational frequency of 14 Hz, as shown in Figure 15(a).

Envelope spectra obtained from WMRA: (a) S1 with F r 1 = 14 Hz and (b) S2 with F r 1 = 23 Hz.
It is noted that the vibrational amplitude at this frequency is twice that observed at the 23 Hz frequency, as shown in Figure 15(b). This result is confirmed by the thesis work of J. Bouyer, 69 which shows that the amplitude of misalignment increases with the intensity of the misalignment torque, especially when the load or rotational speed is low.
Results obtained by VMD-WMRA combination
The decomposition of the same signals using VMD based on the proposed criterion provides the signals and spectra of the different IMFs, as shown in Figure 16. For S1 (see Figure 16(a)), it can be observed that the spectra of the obtained IMFs perfectly isolate the meshing frequency F m 1 (IMF1) and some of its harmonics (IMFs: 2, 3, and 4). Similarly, for S2 (see Figure 16(b)), the isolation of the meshing frequency F m 1 (IMF2) and its fifth harmonic (IMF3) is noted.

Resulting IMFs and the corresponding spectrum obtained from VMD: (a) S1 with F r 1 = 14 Hz and (b) S2 with F r 1 = 23 Hz.
Additionally, IMF1 isolates a resonance at the frequency of 422 Hz, with an amplitude lower than that of F m 1. After investigating this resonance and following the calculations below, we conclude that this resonance represents the natural frequency of the belt, F Br . The values of the frequency F Br for the two rotational speeds are presented in Table 4. The absence of the frequency F Br in S1 is due to its close value to F m 1, which has a large amplitude, thereby overshadowing F Br , unlike in S2.
Calculation results for the two rotation frequencies

The following expressions can obtain the values of the belt resonance frequency:
The natural frequency of the belt
To diagnose faults, we apply the WMRA to each IMF for the two rotational speeds, as shown in Figures 17 and 18. For S1, the presence of misalignment of the input shaft is confirmed by the modulation of the harmonics of the rotational frequency (2F r 1, 3F r 1), which exceed the amplitude of the rotational frequency itself, as shown in IMFs 1, 2, and 4

Envelope spectra obtained by the WMRA for each IMF of S1.

Envelope spectra obtained by the WMRA for each IMF of S2.
For S2, shown in Figure 18, the misalignment of the input shaft is confirmed by the presence of the 2F r 1 peak, which exceeds the rotational frequency F r 1, as seen in IMFs 2 and 3. The presence of misalignment on the input shaft, along with the insufficient inter-axial distance between the two gears, identified in the spectrum in Figure 14(b), caused a misalignment on the second shaft, which is detected in IMFs 1 and 2 by the presence of a peak at the frequency 2F r 2 in the absence of the rotational frequency F r 2. Additionally, in IMF3, a peak at a frequency of 4 Hz is observed.
After investigating the condition of the belt, we found two defects on the grooves of the V-ribbed belt, as shown in Figure 19. These defects justify the presence of the peak at the frequency 4 Hz, which corresponds to the belt passing frequency F B and a large number of its harmonics.

Defects identified on the V-ribbed belt.
Signal processing with gear fault
The signals showing gear defects, S3 and S4, as illustrated in Figure 20, were also analyzed in this section. Due to the presence of a defect on a tooth of the driven gear rotating at the frequency F r 2, we observe an increase in the vibration amplitudes compared to the case without gear defects in the signals and spectra.
Signals with gear faults and their corresponding spectra: (a) S3 with F r 1 = 14 Hz and (b) S4 with F r 1 = 23 Hz.
For signal S3, shown in Figure 20(a), there are impacts with higher amplitudes compared to S1, and the corresponding spectrum still shows the dominance of the meshing frequency F
m
1. The spectrum of S4, illustrated in Figure 20(b), indicates that the presence of a defect on the gear rotating at 23 Hz has exacerbated the inter-axial insufficiency defect, given that the amplitude of 2F
m
1 exceeds that of F
m
1 by approximately 3.5 times. We also observe a sevenfold increase in the amplitude of the belt resonance frequency
Results obtained by WMRA
In the envelope spectra obtained by processing the two signals using WMRA, shown in Figure 21, we observe the absence of F r 2 harmonics for both rotational speeds of 14 and 23 Hz. Therefore, it can be said that WMRA does not allow the localization of the gear fault on the driven wheel.

Envelope spectra obtained by WMRA: (a) S3 with F r 1 = 14 Hz and (b) S4 with F r 1 = 23 Hz.
It was found that during the disassembly and reassembly of wheel Z2 to create the defect on the flank of a tooth, a misalignment was induced on the intermediate shaft. This latter defect is represented by the presence of a peak at 2F r 2, as well as the confirmation of the misalignment of the input shaft by a peak at 3F r 1, as shown in Figure 21(a).
For case S4, shown in Figure 21(b), a very significant increase in vibration amplitudes of approximately 20 times is observed, due in part to the increase in rotational speed in the presence of defects and, on the other hand, to the belt resonance, which allows the appearance of the third harmonic of the belt defect at 3F B and misalignment defects on both shafts.
Results obtained by VMD-WMRA combination
In Figure 22, the IMFs and their spectra obtained by VMD using the proposed criterion for signals S3 and S4 are presented. It is observed that the IMFs perfectly isolate the different frequencies (belt resonance frequency, meshing frequency, and its harmonics).

The IMFs obtained by VMD and the corresponding spectra: (a) S3 with F r 1 = 14 Hz and (b) S4 with F r 1 = 23 Hz.
Figure 22(a) demonstrates the isolation of F
m
1 and some of its harmonics (3F
m
1, 4F
m
1, 5F
m
1, 10F
m
1), while Figure 22(b) shows the appearance of the belt resonance frequency

Envelope spectra obtained by the WMRA for each IMF of S3.
Figure 24 displays the envelope spectra obtained by the combination of VMD and WMRA. On the envelope spectrum of IMF1, a significant number of harmonics of half the belt defect frequency F B are observed, lower in amplitude compared to 2F B , indicating the presence of a dual belt defect as previously illustrated in Figure 19. On the envelope spectrum of IMF2, the modulation of F m 1 by the rotation frequency of the driven shaft F r 2 is observed. In contrast to case S3, diagnosing the gear fault is less straightforward due to the presence of significant misalignment on the input shaft, indicated by a peak at 2F r 1 dominating the harmonics of F r 2. The envelope spectrum of IMF3 shows the presence of F r 1 harmonics, attributed to insufficient backlash. Furthermore, IMF4 confirms the presence of belt defects by the appearance of numerous harmonics of F B .

Envelope spectra obtained by the WMRA for each IMF of S4.
Industrial application of the combined and optimized VMD-WMRA approach
To demonstrate the proposed approach’s effectiveness, the proposed method was applied to signals measured in an industrial setting, specifically on the cooling turbofan (101BJT), a key machine in the ammonia manufacturing process at Algeria’s largest fertilizer company (FERTIAL). 70 The 101BJT is made up primarily of an electric motor, a fan, a speed reducer, and a turbine, as shown in Figure 25.
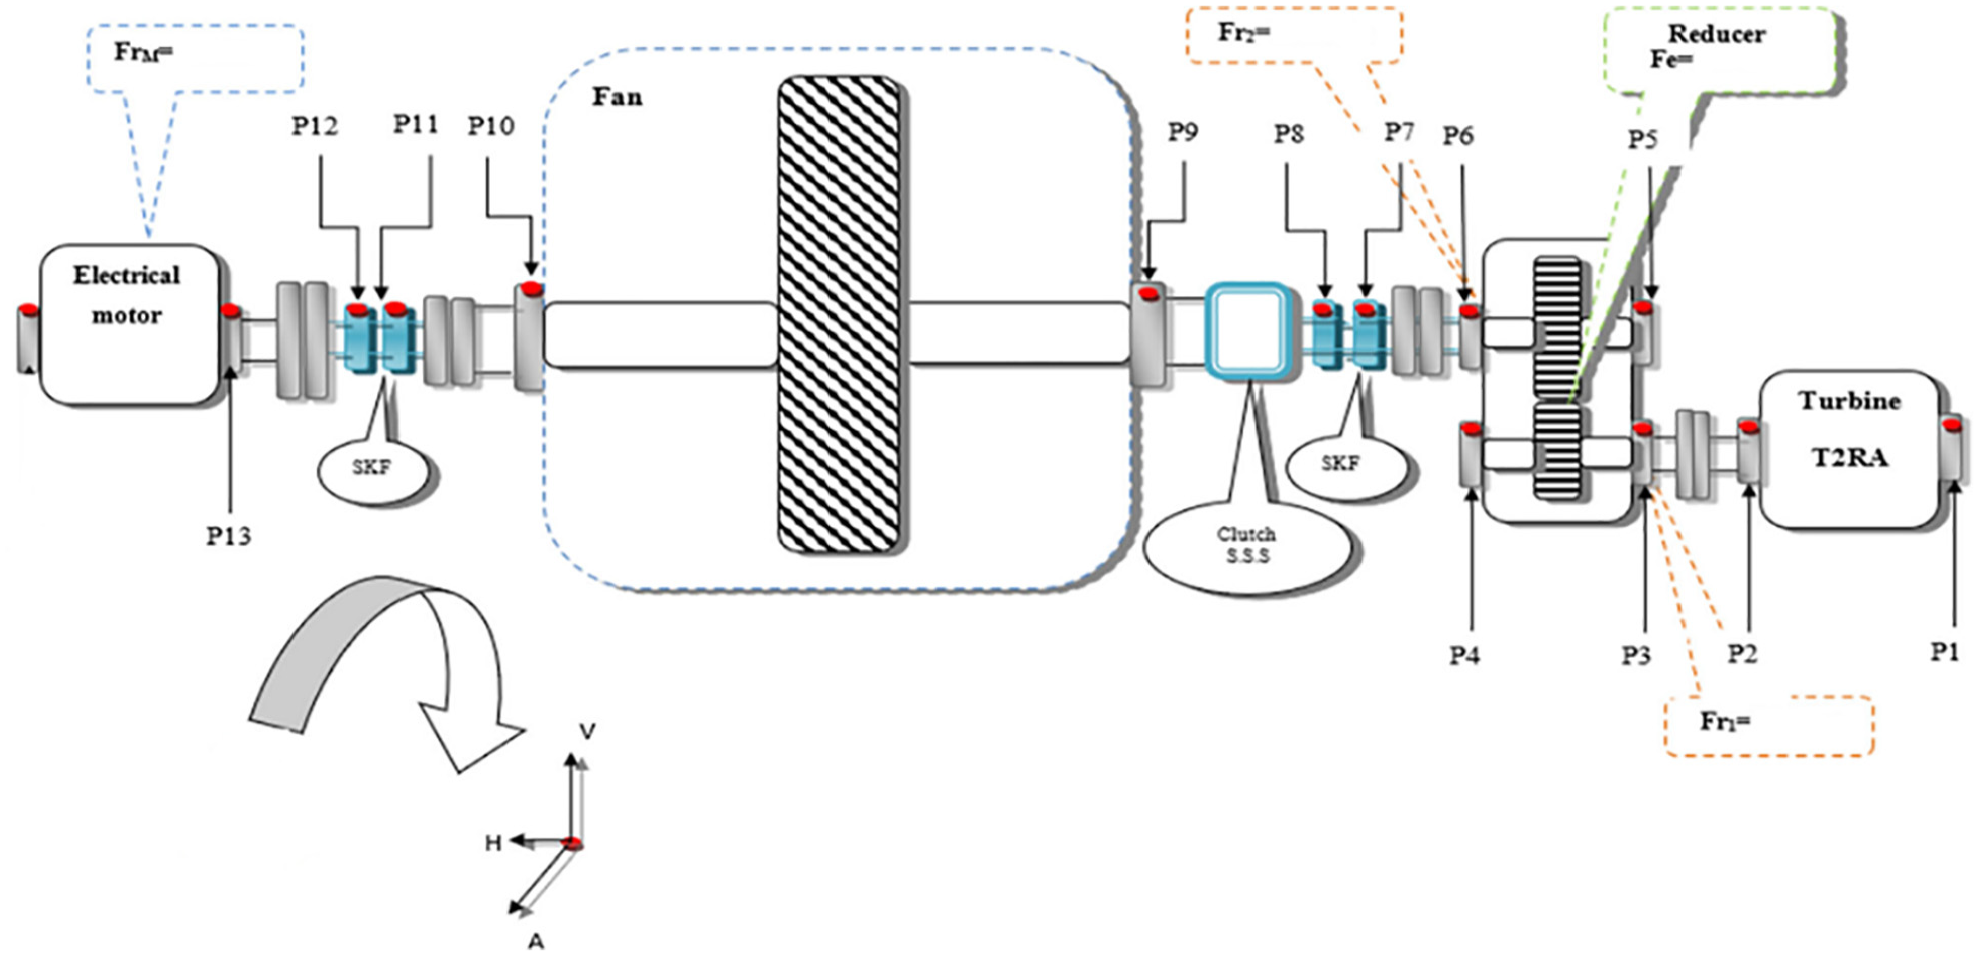
Kinematic scheme of the 101BJT with measuring points.
The 101BJT turbofan comprises two drives: a main drive powered by a steam turbine operating at F r 1 = 83.5 Hz (equivalent to 5010 rpm) and a backup drive powered by an electric motor operating at F r 2 = 15.5 Hz (equivalent to 930 rpm).
The turbine and speed reducer are connected to the fan via a clutch coupling, which disengages automatically when the turbine speed falls below that of the fan drive shaft. Vibration measurements were taken in three directions at turbofan bearing points numbered P1 through P10. Figure 26(a) illustrates the use of two accelerometers: a Bruel & Kjaer triaxial accelerometer 4524B-00 and an industrial accelerometer Bruel & Kjær type 4511-001. Signals were collected using the Bruel & Kjær Pulse 16.1 analyzer and Pulse LabShop acquisition software, as shown in Figure 26(b). Post-processing was done in MATLAB.

Taking measurements: (a) sensor positions and (b) pulse analyzer 16.1.
Based on the overall RMS levels of the measured signals, which were notably high at bearings P2 and P5, these signals were processed in both low-frequency (0–800 Hz) and high-frequency (0–12,800 Hz) bands, as shown in Figure 27.

Signals measured in the P2 and P5 bearings at low and high frequencies.
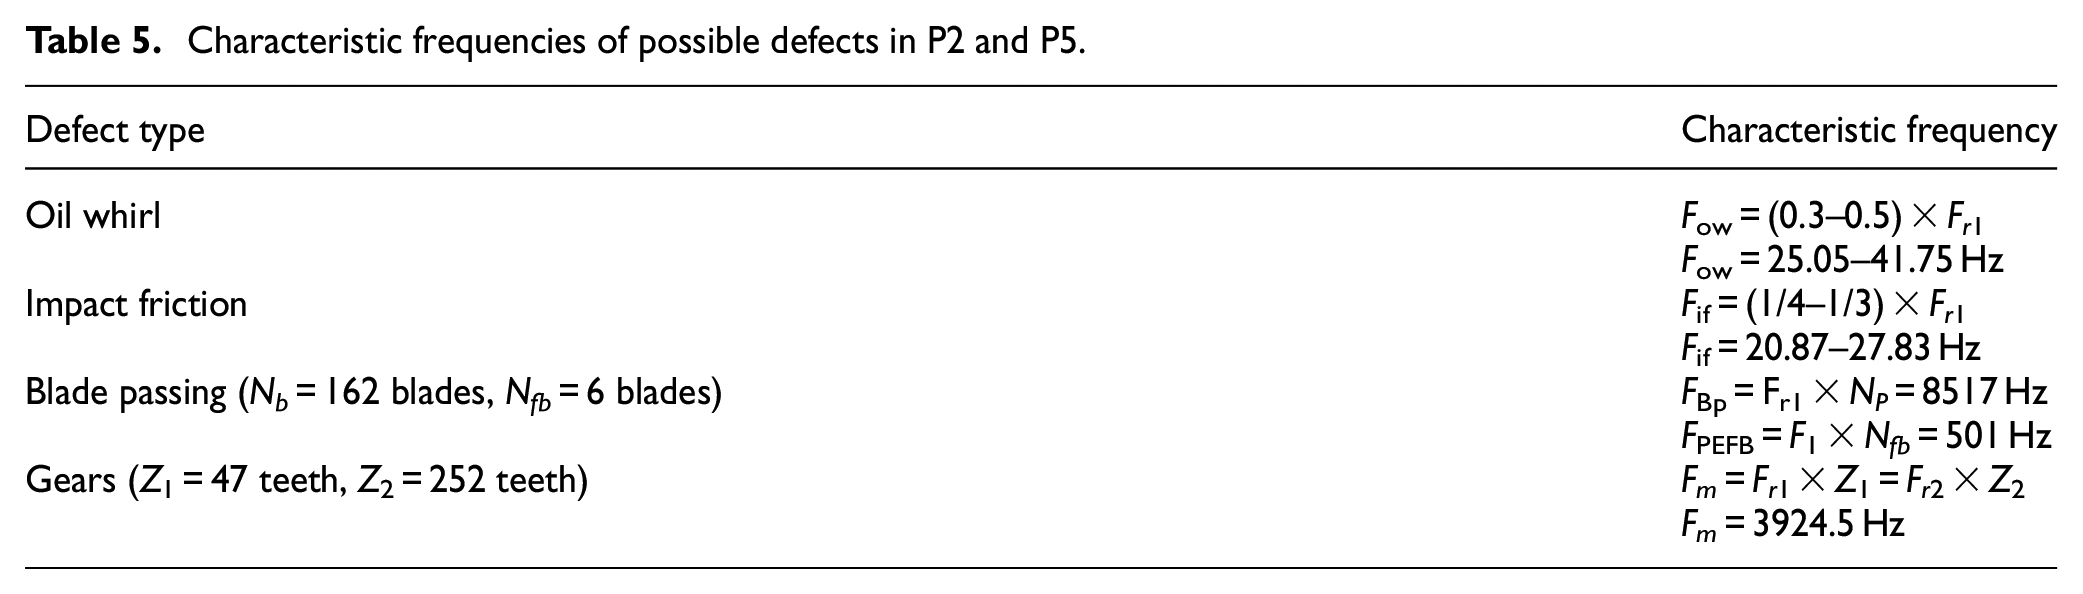
Table 5 presents the characteristic frequencies of various types of faults that may occur in bearings P2 and P5, such as F ow (oil whirl frequency), F if (impact friction frequency), F Bp (blade passing frequency), F PEFB (passing frequency of each set of fixed blades), N fb (number of groups of fixed blades), and F m (meshing frequency), with Nb representing the number of blades in both turbine wheels, Z1 the number of teeth on the driving wheel, and Z2 the number of teeth on the driven wheel. These characteristic frequencies play an important role in vibration analysis and fault detection. Identifying these characteristic frequencies in the measured signals at bearings P2 and P5 allows for an accurate diagnosis of the type of fault present.
Characteristic frequencies of possible defects in P2 and P5.
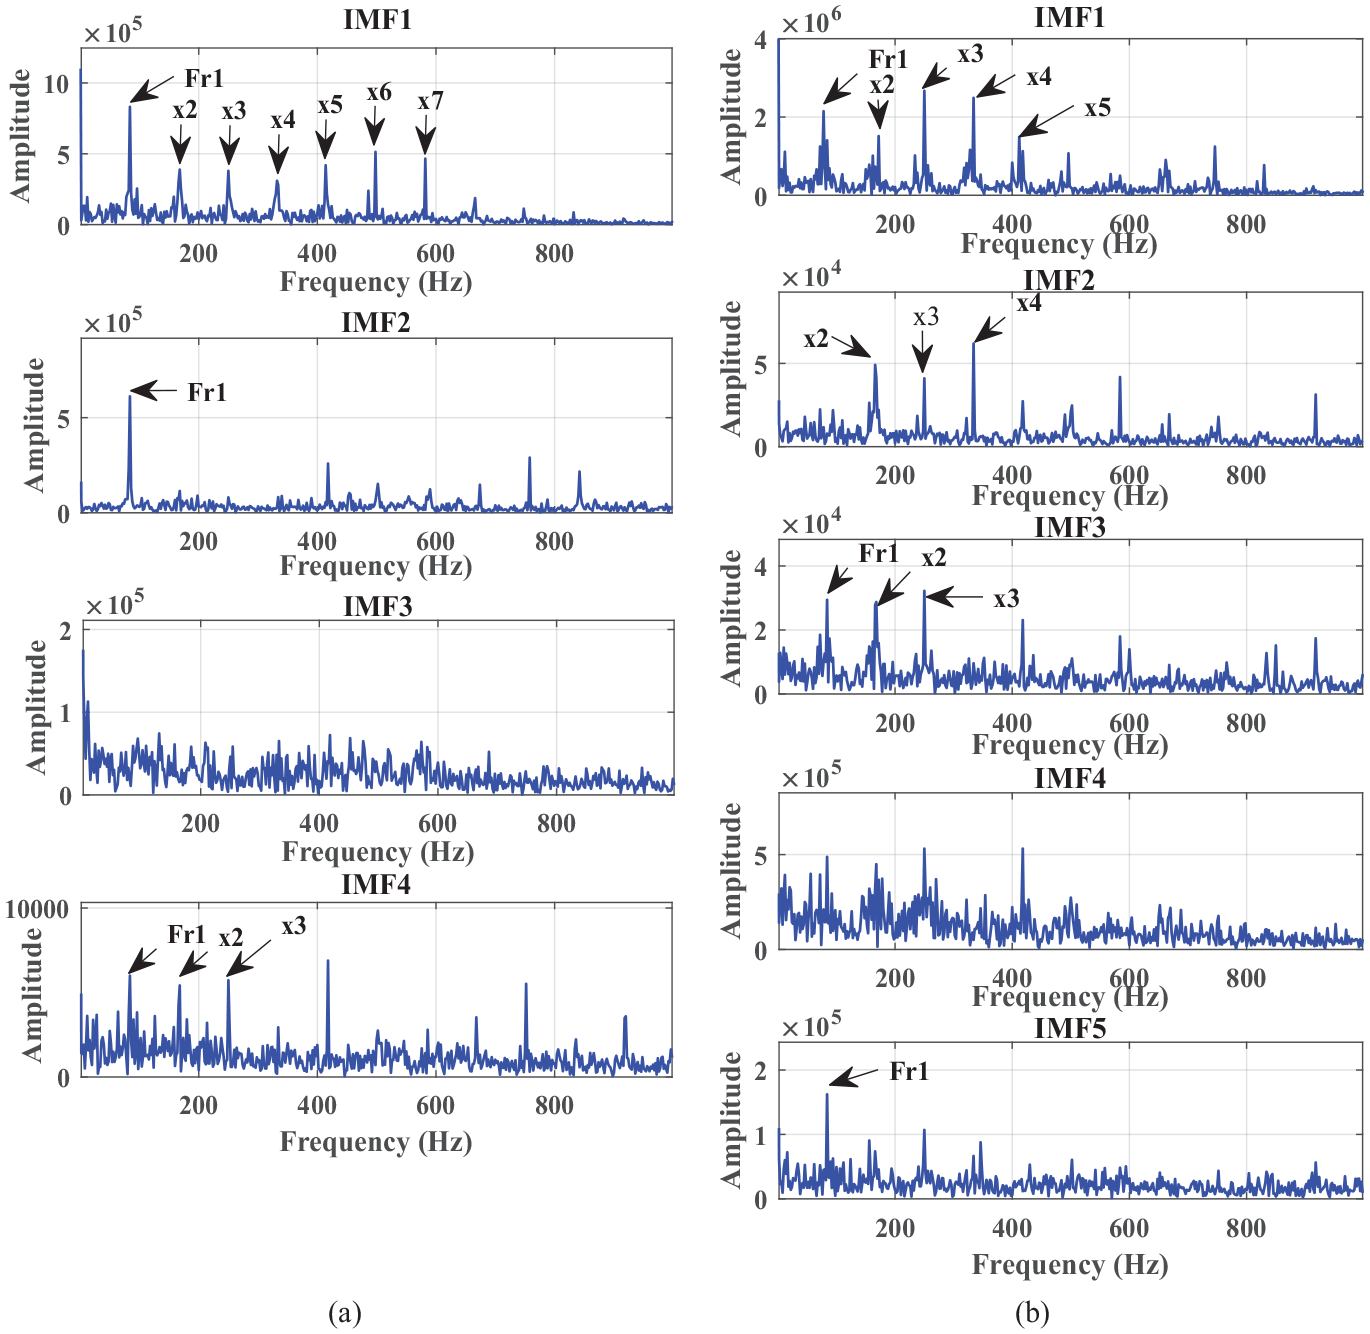
Analysis of signals in the low-frequency band allows investigation of faults manifesting within this frequency range. Applying the proposed criterion for VMD decomposition yields two IMFs for bearing P2 and three IMFs for bearing P5, subsequently processed by WMRA to obtain envelope spectra, as shown in Figure 28. In IMF1 spectra of signals from bearings P2 and P5, the frequencies of oil whirl defect F ow and impact friction defect F if are clearly visible. Both defects are more pronounced on the turbine’s P2 bearing compared to the reducer’s P5 bearing, as indicated by the amplitude differences between the two spectra.

Envelope spectra obtained by WMRA for IMFs of low-frequency signals: (a) bearing P2 and (b) bearing P5.
Similarly, applying the proposed approach to high-frequency signals results in four IMFs for bearing P2 and five IMFs for bearing P5. The envelope spectra obtained by WMRA for these IMFs are illustrated in Figure 29. Investigation of the IMFs from high-frequency signals reveals the presence of a gear defect through the appearance of the input shaft rotation frequency F r 1 and its harmonics in IMFs 1 and 4 for bearing P2, as well as IMFs 1 and 3 for bearing P5.
Envelope spectra obtained by WMRA for IMFs of high-frequency signals: (a) bearing P2 and (b) bearing P5.
Conclusion
This article presented a combined approach to fault detection in industrial installations that uses Variational Mode Decomposition and Wavelet Multi-Resolution Analysis. The primary goal was to create a reliable and effective method for diagnosing faults in extremely noisy vibration signals. To accomplish this, we proposed a new criterion based on the variation of normalized Shannon entropy that maximizes the number of Intrinsic Mode Functions by effectively isolating the various carrier frequencies present in the spectrum. The use of this criterion and the VMD-WMRA combination on both numerically simulated and experimentally measured signals demonstrated the effectiveness of the proposed approach. This method provides a promising solution for detecting faults in rotating machinery while overcoming challenges posed by vibrational signal disturbances such as shaft misalignment and insufficient backlash.
The results from simulation and experimentation show that this approach has the potential to improve the reliability and accuracy of fault diagnosis. This could have a significant impact on preventive maintenance, helping to improve operational efficiency and extend equipment lifespan in industrial settings. Furthermore, the method was applied to signals collected from an industrial cooling turbofan, allowing for the diagnosis of gear, oil whirl, and impact friction faults in the turbine and reducer bearings. While the proposed method has demonstrated efficacy in early fault diagnosis, even within industrial settings, several prospective avenues for future research are identified: the incorporation of the optimized VMD-WMRA approach into machine learning algorithms to facilitate automated fault classification and prediction, as well as the application of cyclostationary methods to analyze signals recorded under fluctuating operating conditions, thereby enhancing diagnostic precision in progressively noisy environments.
Footnotes
Handling Editor: Aarthy Esakkiappan
Declaration of conflicting interests
The author(s) declared no potential conflicts of interest with respect to the research, authorship, and/or publication of this article.
Funding
The author(s) disclosed receipt of the following financial support for the research, authorship, and/or publication of this article: The current research was conducted by the “Structural Dynamics & Industrial Maintenance” research group at the Mechanics & Structures Laboratory (LMS) of the 08 May 1945 University, Guelma, Algeria, under the funding of the General Directorate of Scientific Research and Technological Development (DGRSDT) through the PRFU research project: A11N01UN240120220004.