
Abstract
We conducted combustion tests with marine gas oil (MGO) blended with bioethanol (BE) in ratios of 0%–30% to address International Maritime Organization air pollution regulations on exhaust gases emitted from ships and fossil fuel resource depletion and achieve carbon neutrality. We designed and manufactured a standard 1-ton combustion chamber, using an attached gun-type burner to analyze the exhaust gases of each sample under similar conditions. Compared to pure MGO (BE0), the oxygen content increased by approximately 1.91% at the maximum blend ratio (BE30), while carbon dioxide decreased by 1.39%. Nitrogen oxides were reduced by approximately 30%. Sulfur oxides were minimal (<0.03%), with MGO alone at approximately 0.08 ppm, confirming the superior quality of low-sulfur fuel. In all blends containing BE, no sulfur oxides were detected. Additionally, exhaust gas temperature decreased by 5.8%, and combustion efficiency decreased from 72.24% to 70.33%, a reduction of approximately 1.9%. This indicated that BE has a relatively lower calorific value; however, it provides a similar thermal output, with some reduction of exhaust emissions. A one-way ANOVA and post-hoc verification confirmed that with increased BE content, emission differences were significant (p < 0.01 level in all areas). Through this study, it was confirmed that the use of eco-friendly fuels such as bioethanol has excellent effects on reducing exhaust emissions. It is analyzed that it would help solve global warming and air environment pollution problems. Therefore, it is determined that the future application of MGO-bioethanol blended fuel as an eco-friendly alternative fuel for ships holds significant potential, and positive outcomes are anticipated.
Introduction
Recently, the use and consumption of fossil fuels have increased globally,1,2 and from the 2020s, global oil production is expected to decline considerably. 3 The severe shortage of energy resources due to depletion and the environmental pollution caused by the indiscriminate use of fossil fuels are critical issues. 4 Consequently, a new climate has emerged, with countries worldwide aiming to reduce greenhouse gases by 2030, which are the main cause of global warming. 5 South Korea aims to reduce greenhouse gas emissions by 37% compared to BAU by 2030. The International Maritime Organization (IMO) also aims to reduce total CO2 emissions by approximately 70% by 2050, starting from 2008. 6 Additionally, the IMO has established and strictly enforced the Energy Efficiency Design Index for various ships to reduce greenhouse gases. 7 From 2020, the sulfur limit in marine fuel has been reduced from 3.5% to 0.5%, and the emission of nitrogen oxides in ships is restricted to ≤3.4 g per kWh through the expansion of Emission Control Areas.8,9
Various studies have been conducted to develop environmentally friendly ships or apply alternative clean energy to reduce greenhouse gas emissions from ships.10–12 The National ship classification agency has stated that ethanol possesses physical properties very similar to those of methanol, making it suitable for use as a ship fuel. It is necessary to gradually establish inspection standards for ethanol-fueled vessels to facilitate the development of various eco-friendly ships.
According to the Renewable Energy Policy Network report (2017), renewable energy accounts for approximately 19.3% of the total energy consumption and is expected to become more active in the future.13,14 Among these, environmentally friendly fuels account for approximately 9.1%, and various newly developed renewable energies, including biodiesel fuel, constitute approximately 10.2%. This suggests that the development of alternative fuels to replace fossil fuels will accelerate further.15,16
Regarding orders for ships adopting alternative fuel oil circa 2013, the adoption rate for ships of over 100 tons was approximately 5% of all orders. However, by 2023, this rate had surged to approximately 50%, indicating over a 10-fold increase, and the acceleration of alternative fuel adoption in global shipping is expected to increase further. These alternative fuel energies are directly applicable without modifying the machinery, providing output comparable to conventional fuels while reducing air pollutants.17,18 Therefore, various fields are actively researching these fuels. 19
However, mixing with new alternative energy sources is limited by storage stability because of phase separation during long-term storage. Therefore, research has focused on alternative fuel oils mixed with traditional biodiesel. There has been little research on new alternative fuel oil blends of marine gas oil (MGO) and bioethanol (BE), which are the target items for this study and the most widely used marine fuels. 20
Therefore, this study aims to establish a new system for environmentally friendly alternative fuel using the MGO and BE fuel blend. Specifically, the MGO and BE fuel blend is composed of four stages: BE0 (0%), BE10 (10%), BE20 (20%), and BE30 (30%), with increasing BE content. This study was on a next-generation alternative fuel system defined by three fields: renewable fuel standard (RFS) program, conversion technology products, and bioenergy classification technologies. This new classification of MGO-BE fuel includes the following. First, it is categorized as a “renewable fuel” derived from ethanol produced from corn starch under the RFS2 program. Second, as a conversion technology product, it includes sugar biomass resources such as sugarcane, potatoes, barley, and corn. Third, regarding bioenergy classification, the MGO-BE fuel pertains to BE production technology in bio-liquid fuel production and is composed of starch, sugar, and lignocellulosic BE. Consequently, the MGO–BE fuel blend used in this study qualifies as “renewable fuel,”“sugar biomass,” and a specialized environmentally friendly marine fuel with bio-liquid fuel production technology. Figure 1 illustrates the composition of the MGO–BE fuel oil blend.

Composition of MGO–bioethanol fuel oil blend.
Bae21,22 observed that mixing BE with diesel for land vehicles did not reduce hydrocarbon emissions but partially reduced NOx and PM simultaneously. However, this applies to cases where BE–diesel blends were used in automobiles, which differs from this study.
Ha 23 and Yoon et al.24,25 applied gasoline–BE blends to spark ignition and marine engines, which had reduced carbon monoxide (CO) and relatively comparable engine performance to gasoline.
Poulopoulos and Philippopoulos 26 studied the characteristics of substances produced during combustion by comparing various ethanol samples in a four-cylinder engine. Jeuland et al. 27 reported that using pure BE in a spark ignition engine for lean combustion can improve exhaust emissions compared to gasoline fuel, enhancing fuel consumption by approximately 26%.
Most recent ethanol-related studies involve mixing ethanol with gasoline for vehicle engines. Research on mixing ethanol with MGO is significantly lacking, indicating the need for more research.
The difficulty in developing alternative energy for marine fuel lies in applying it directly to large-scale combustion facilities like the main engines of ships, limiting smooth demonstration tests at sea. 28 Therefore, some researchers are conducting down-scaled laboratory tests to understand combustion characteristics. 29 Preliminary simulation tests using small combustion chamber devices scaled down from large-scale equipment are necessary before conducting demonstration tests at sea. 30
Our research team conducted a demonstration test using a small 30 L water tube boiler on combustion devices to verify marine fuel at a lab scale, establishing a Rankine cycle system similar to the auxiliary boiler system of ships. 28 A 300 L-combustion chamber with a gun-type burner capable of load variation was also designed and manufactured. MGO combustion tests in this chamber revealed a reduction in nitrogen oxides and carbon dioxide by approximately 22.6% and 1.91% within the operating range. However, the exhaust gas temperature was high at approximately 620°C owing to the small volume of the combustion chamber relative to the burner’s capacity, suggesting the need to adjust the burner specifications or expand the combustion chamber. 31
Therefore, our research team redesigned and manufactured the lab-scale combustion chamber with an increased capacity of 1 ton. Comparative tests of MGO and BE blends were conducted to propose the emission reduction effects of BE using this new combustion chamber under the same standard test conditions. We aimed to enable basic simulation tests of various alternative fuels using this combustion chamber in the future.
Materials and methods
MGO (marine gas oil)
MGO is the primary engine fuel for small ships, auxiliary fuel for medium-sized ship engines, start/stop fuel, and fuel for large ship generators. The physical properties of MGO are similar to those of regular diesel but with a higher density. It has slightly higher ignitability and explosiveness than diesel. According to ISO-8217, the international standards for marine fuel oil – distillate fuels such as DMX, DMA, DMZ, and DMB – are considered MGO. 5 MGO has a boiling point of 250°C – 350°C, between kerosene and heavy oil in the crude oil refining process. It is a high-density liquid located well below gasoline; however, it is called “gas oil” to distinguish it from heavy oil, which is located even lower. Typically, the specific gravity (15/4°C) is below 0.890, the kinematic viscosity at 40°C is maintained at 1.5–6.0 cSt, and the sulfur content should be below 1.5%. However, the most recent MGO produced to meet Emission Control Area regulations tends to have sulfur content below 0.1%, and this trend is expected to strengthen further.
Bioethanol
BE, as an alternative energy, is mostly synthesized from plant biomass, using raw materials such as starch, sugar, and lignocellulosic biomass. It is mainly mixed with gasoline, enabling its use with minimal facility modifications to gasoline engines, petroleum refining, and distribution infrastructure. 32 However, BE faces mass production and transportation challenges due to the scattered distribution of energy production resources. Fuel supply needs to be easy, especially for ships; however, the supply chain and distribution infrastructure development for BE in marine use is relatively slow. Additionally, various production resources and corresponding production technologies make developing and selecting biofuel production technologies specialized for ships challenging. 32
BE research and development have long been actively conducted in various fields. It can be broadly classified into three generations based on the edibility of the raw materials.33–35 First-generation BE is based on food resources like corn or palm oil. Second-generation BE is classified based on lignocellulosic non-food resources such as wood and grass. Third-generation BE is based on marine resources like algae and seaweed, which have the potential for carbon reduction. However, the conversion ratio of raw materials to ethanol for third-generation seaweed is low, and the production cost is high, indicating its limitations. Thus, related research should continue in the future. Table 1 summarizes the characteristics of BE based on raw materials, categorized as edible and non-edible. Figure 2 compares examples of BE raw materials for each generation.
Characteristics of bioethanol according to raw materials.


Examples of bioethanol raw materials for each generation.
Manufacture MGO–BE fuel oil blend
The fuel oil blends used in the study were prepared by mixing MGO and BE in four proportions: 0%, 10%, 20%, and 30%, calculated using the unit mass ratio (wt.%), and the samples were named BE0, BE10, BE20, and BE30, respectively.
During the manufacturing, 5000 g of the fuel oil blend was prepared each time, with the duration set to 300 s at operating speeds of 1800 rpm (low speed) and 3600 rpm (high speed). However, despite multiple blending attempts during the initial manufacturing process, the unstable phase separation rapidly occurred over time between the two samples, leading to ignition failure or incomplete combustion and hindering the proper tests. The additive used as the purpose of the emulsifier based on the occupancy ratio, with the highest market share was gelatin (36.67%), followed by glycerol fatty acid ester (25.68%) and carrageenan (13.2%). In particular, glycerol fatty acid ester has the property of being insoluble in water, which allows it to be used for reducing particle size or dispersing in hot water. 36 Therefore, in this study, glycerol fatty acid ester was selected as the emulsifier. Consequently, based on previous cases, a powder emulsifier – glycerin fatty acid ether – was uniformly added at a 10% mass ratio (500 g) to ensure proper mixing stability.
The mixer was operated in multiple stages by repeating low and high speeds with the primary and secondary mixers. When combustion tests were performed on the samples produced, an inverter-type low-speed stirrer was installed at the stage before the fuel supply and operated continuously at 500 rpm. Consequently, the fuel was supplied directly to the inlet of the fuel nozzle at the burner side because it was mixed. Table 2 proposes the final mixing ratios and optimal manufacturing properties for each sample, and Figure 3 visually compares the stably produced MGO–BE fuel oil blend with various marine fuels.
Manufacturing process of mixed fuel oil.


Comparison of manufactured samples with marine fuel oils: (a) heavy fuel oil, (b) marine diesel oil, (c) gasoline, (d) diesel, (e) marine gas oil, (f) ethanol 10%, (g) ethanol 20%, (h) ethanol 30%, and (i) glycerin fatty acid ether powder type emulsifier.
Analysis of physical properties
Elemental analysis and quality certification tests for marine fuel oils were conducted to determine the physical properties of the four samples manufactured. The component analysis followed the standard test methods for marine fuel oil (ISO-8217 and ASTM). The properties of the fuel oil blend samples were analyzed and compared in five categories: net calorific value (lower heating value (LHV), J/g), gross calorific value (higher heating value (HHV), MJ/kg), density (kg/m3), flash point (°C), and kinematic viscosity (mm2/s). The reference density was considered at 15°C, and the flash point was analyzed using a Pensky-Martens closed cup (A cup).
Design and manufacture of the 1-ton standard combustion chamber
A combustion chamber burns fuel to generate thermal energy through chemical reactions. Combustible gas from the fuel mixes with air and burns in a combustion chamber device; thus, it generates thermal energy through chemical reactions by burning fuel. The design is simple for ease of movement, using orthographic projection methods and referencing previous studies.
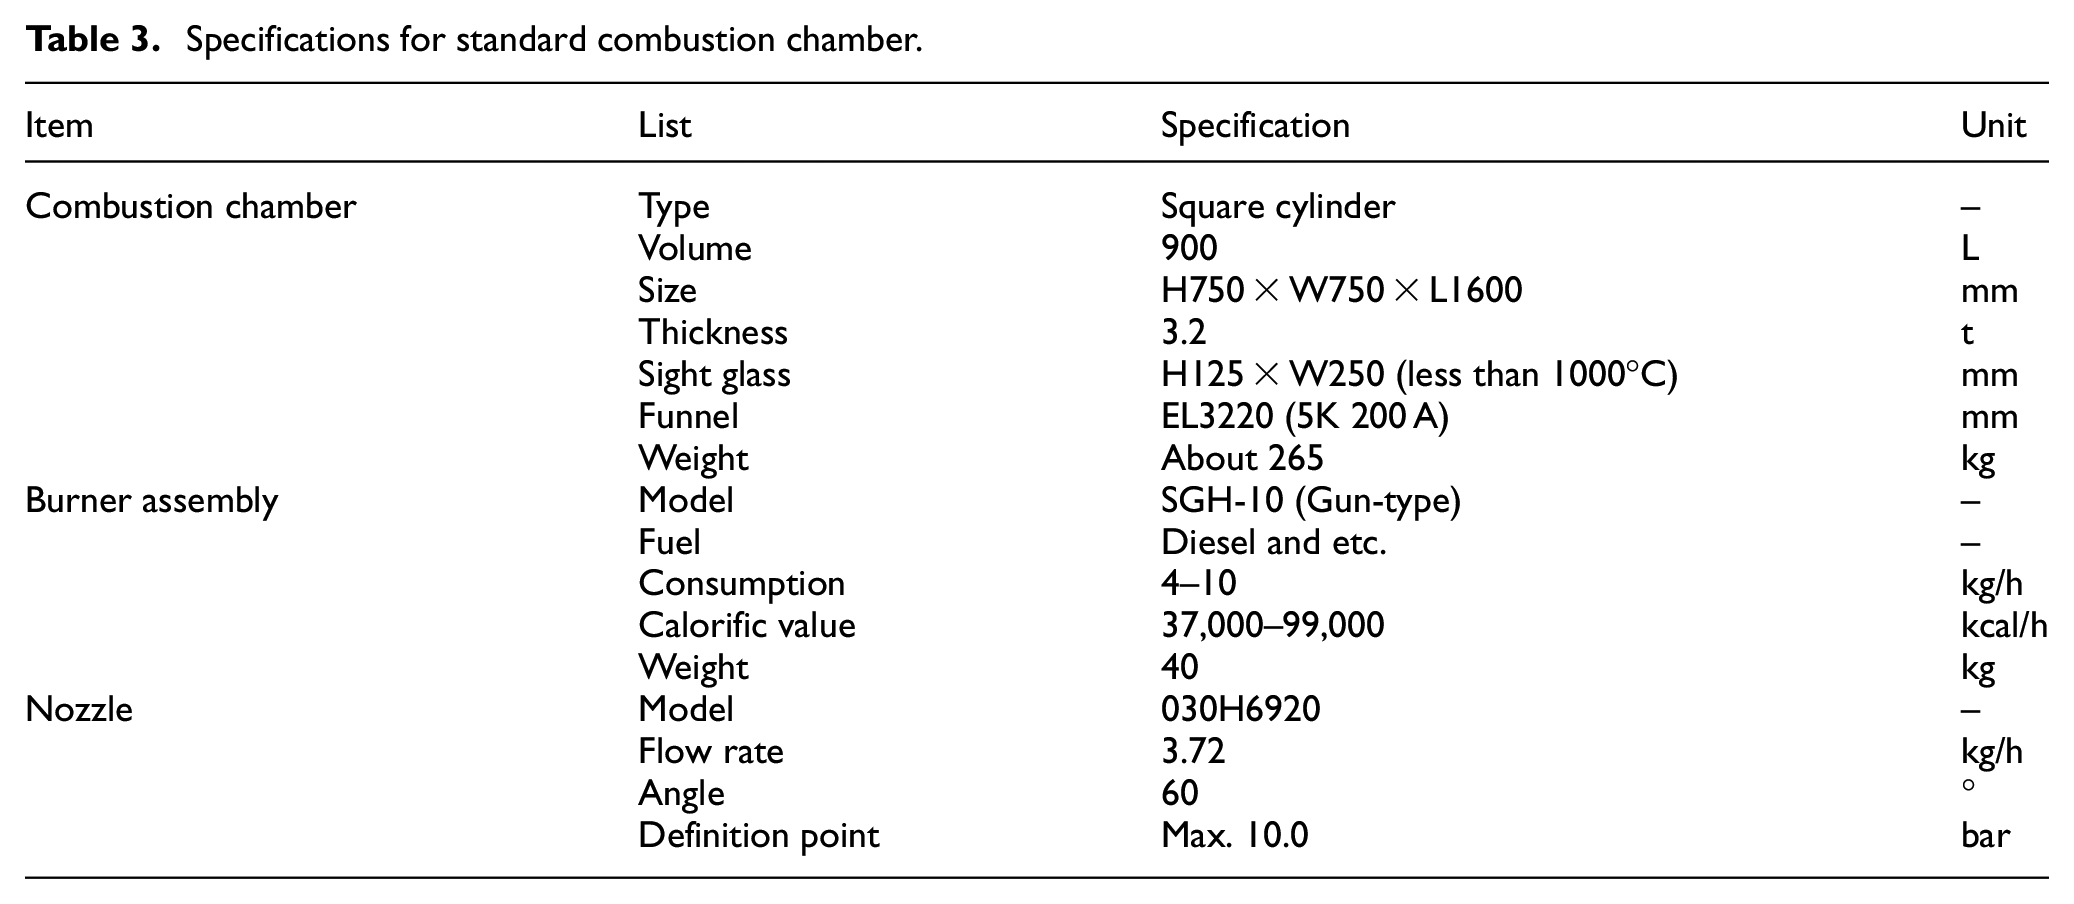
The chamber structure has a volume of approximately 900 L (750 × 750 × 1600 mm) and 3.2 T thick steel plates for durability. The exhaust gas stack comprises 5 K-200 A-sized piping, flanges, and other fittings. A side of the chamber features an integrated gun-type burner with an output of approximately 37,000–99,000 kcal/h and a fuel consumption rate of 4–10 kg/h. The opposite side is equipped with a heat-resistant high-temperature sight glass for analyzing the flame state and visualization. The gun-type burner, suitable for small capacities, has a blower that supplies combustion air, a burner nozzle, an ignition device, a flame detection device, and a control module board. Various sections are equipped with fittings for attaching temperature and pressure sensors under 20 channels to monitor combustion conditions. Caster wheels are added for ease of movement at the laboratory level. The total length of the exhaust gas duct is approximately 3.22 m, and the probe of an exhaust gas analyzer can be easily attached at the end. Table 3 summarizes the specifications of the manufactured combustion chamber, and Figure 4 illustrates the exterior of the chamber based on the design specifications.
Specifications for standard combustion chamber.

Appearance of standard combustion chamber.
Exhaust gas measurement method
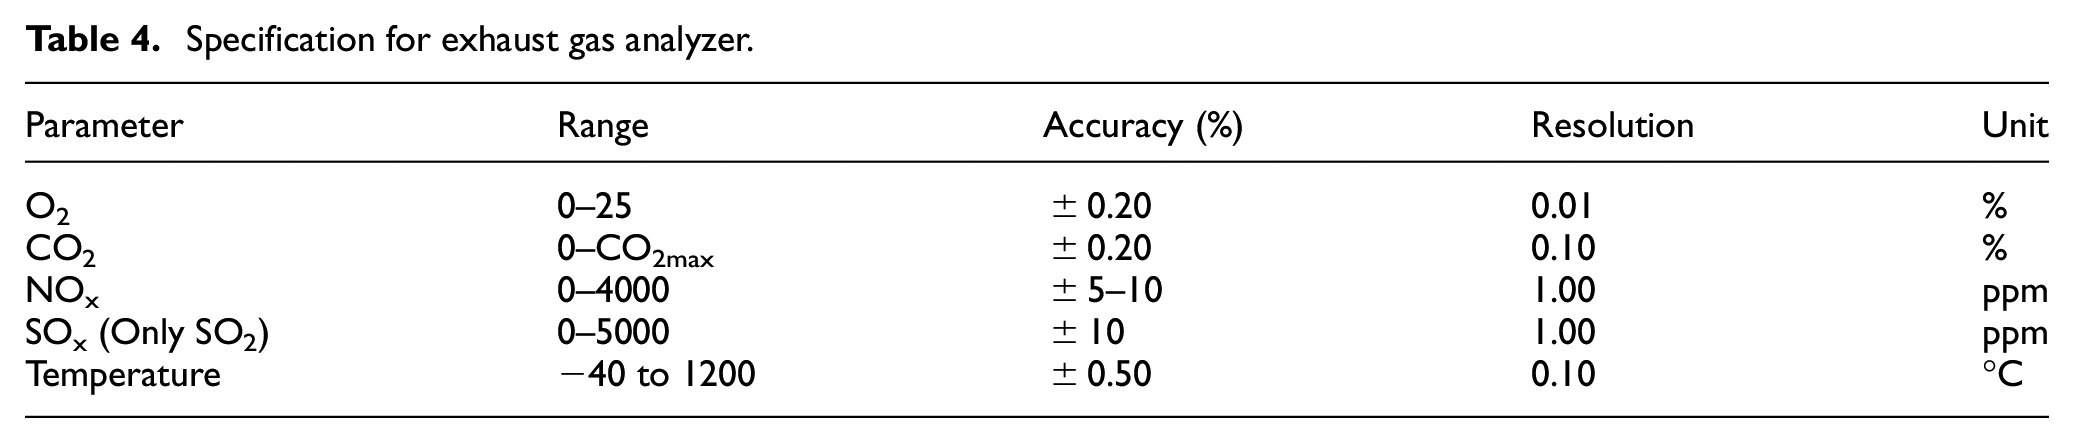
The exhaust gas measurement analyzer selected was the Testo-340 model, and it measured the oxygen, carbon dioxide, nitrogen oxide, and sulfur oxide contents and the exhaust gas temperature (°C). A thermocouple was installed at the end of the probe to simultaneously measure the exhaust gas and ambient air temperatures. The probe sensor of the gas analyzer is 40 cm long. Table 4 summarizes the main specifications of the exhaust gas analyzer.37,38
Specification for exhaust gas analyzer.
The measurement location was approximately 1.22 m away from the combustion chamber in a straight line, and measurements were conducted over a 3.22 m section of the exhaust duct. During all measurement processes, the system was completely sealed to prevent the ingress of external gases or leakage before the gases were released from the combustion chamber.
The standard method for measuring exhaust gas follows the air pollution process test standards of the National Institute of Environmental Research. The average value measured continuously for 5 min was repeated thrice under stable ambient and external conditions to obtain the overall average. Regarding sulfur oxides, only SO2 was presented according to the test standard. 12 Humidity was approximately 87.2% due to prolonged rain during the measurement period. The internal chamber temperature and fuel injection pressure were measured simultaneously using a dedicated data logger and used as reference values. Furthermore, data measurements began approximately 1 h after changing the fuel to allow sufficient line flushing of residual fuel and stabilization of combustion conditions. Table 5 summarizes the experimental conditions at the time of the experiment, and Figure 5 is a schematic presentation of the experiment.
Experiment conditions.

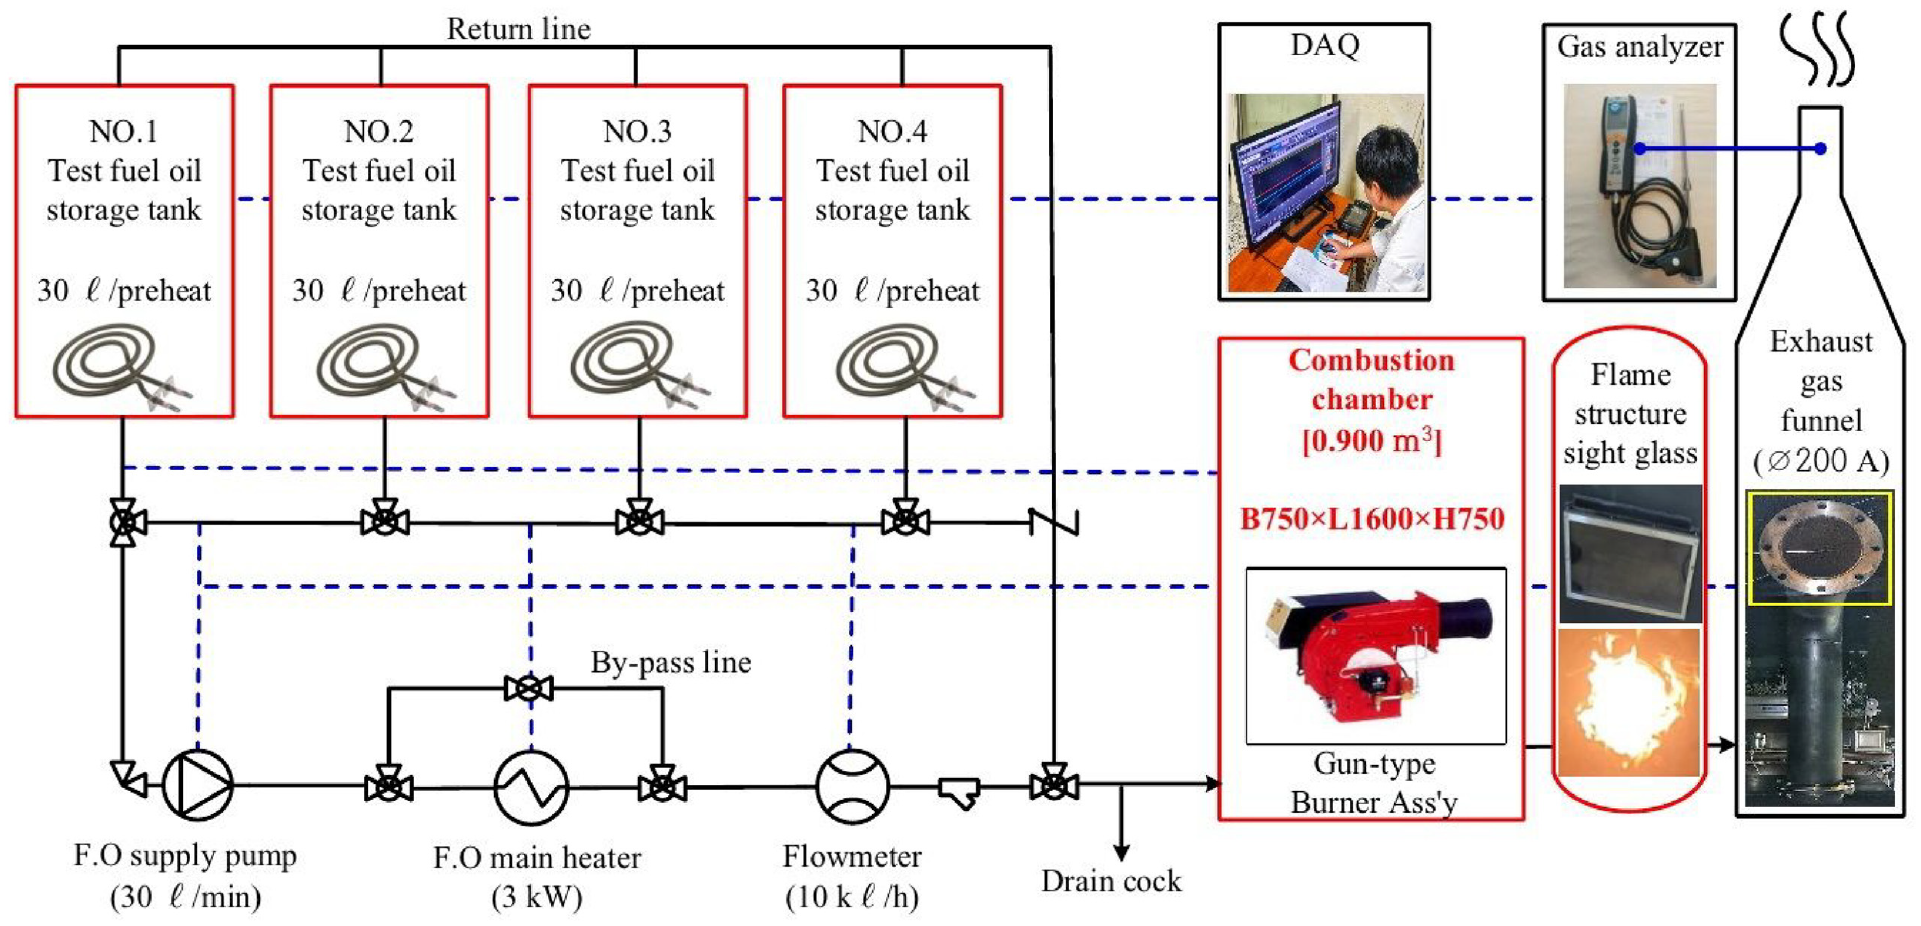
Schematic diagram of combustion comparison experiment.
Results
Exhaust gas emissions
The characteristics of exhaust gas emissions from each sample measured using the standard test method are presented in Figure 6(a)–(d).

Comparison test results of exhaust gas emissions: (a) oxygen, (b) carbon dioxide, (c) nitrogen oxide, and (d) sulfur dioxide.
The oxygen content for pure MGO (BE0) was 8.05%, whereas it was 8.68% for BE10, an increase of 0.63%. BE20 and BE30 had 9.03% and 9.96%, an increase of 0.98% and 1.91%, respectively. As the BE content increased, the oxygen content gradually increased, which was attributed to the water and oxygen content in the BE and the unburned oxygen in the supply air.
Carbon dioxide for BE0 and BE10 was 9.31% and 8.87%, respectively, with a decrease of 0.44% for BE10. BE20 and BE30 had 8.61% and 7.92% carbon dioxide content, a decrease of 0.70% and 1.39% compared to MGO, respectively. As the BE content increased, the carbon dioxide content decreased compared to pure MGO (BE0). This was due to the oxygen in the BE reacting with the fuel during combustion, reducing the carbon dioxide concentration. This implies that blending BE can help reduce the carbon emissions of marine fuel and potentially achieve carbon neutrality.
The nitrogen oxide content for BE0 was 34.10 ppm; BE10, BE20, and BE30 had 31.44, 29.89, and 23.87 ppm, with decreases of approximately 7.8%, 12.4%, and 30.0%, respectively. As the BE content increased, the nitrogen oxides decreased significantly compared to pure MGO (BE0). This was because of the characteristics of nitrogen oxides generated in high-temperature zones, where the latent heat of evaporation of the water in the fuel blend reduced the temperature, and the micro-explosion effect of water droplets during combustion shortened the residence time of hot gases and diluted the exhaust gas with steam generated during combustion. 39
The sulfur oxide content, mainly sulfur dioxide, was approximately 0.08 ppm for BE0, and BE10 to BE30 all had 0.00 ppm. This indicates that pure MGO has a low sulfur content of <0.01%, displaying excellent fuel quality as a low-sulfur fuel. The addition of BE is expected to achieve zero sulfur oxide emissions.
Exhaust gas temperature
The comparison of exhaust gas temperatures generated during the combustion of each fuel is presented in Figure 7(a), with the excess air ratio depicted in Figure 7(b). The exhaust gas temperature for pure MGO without BE (BE0) was 367.2°C. For BE10, BE20, and BE30 it was 359.6°C, 356.9°C, and 346.1°C, with 2.1%, 2.8%, and 5.8% decreases, respectively. Therefore, the exhaust gas temperature decreased as the BE content in the standard combustion chamber increased under the same measurement conditions as the air pollution process test standards. The maximum decrease was 5.8% at 30% BE content. This decrease in temperature can be attributed to the LHV of BE, the latent heat of evaporation of the water content, and the dilution of unburned components in the supply air. Despite a 30% BE content, the temperature reduction was approximately 5.8%, suggesting that the output remains relatively close to the expected value.

Comparison test results of temperature (a) exhaust gas temperature and (b) air ratio.
The excess air ratio for pure MGO (BE0) was 1.622. For BE10, BE20, and BE30, it was 1.705, 1.756, and 1.902, with 5.1%, 8.3%, and 17.3% increases, respectively. Therefore, as the BE content increased, the excess air ratio gradually increased compared to that of BE0. This was because the fixed supply air volume could not be adjusted, resulting in an increase in excess air ratio due to the dissolved oxygen and the unburned components of the ambient air supply.
Table 6 presents the comparative analysis results of the elemental analysis. For pure MGO (BE0), carbon (C) was 84.8%, and hydrogen was 14.311%. At the maximum proportion (BE30), carbon was 64.8%, and hydrogen was 11.528%. The oxygen content increased from 0.14% to 5.86% at BE30, indicating that a higher BE proportion corresponds to higher oxygen (O) content due to its chemical composition, which includes water (H2O) and alcohol (C2H5OH). This suggests relatively stable and appropriate mixing overall. Nitrogen (N) and sulfur (S) were analyzed at trace amounts – below 0.1%. Variations existed among the samples; however, these differences were negligible considering the overall mass and were likely due to sampling and analytical instrument errors.
Results of elemental analysis.

Table 7 compares the analysis results for each component according to the standard test methods. The LHV ranged from 43,030 to 37,010 J/g, indicating that as the BE proportion increases, the LHV decreases. The HHV was 46.065–39.460 MJ/kg, showing that the HHV also decreases as the BE proportion increases. The slight difference between both heating values can be attributed to the latent heat of evaporation due to the 5% water content in BE. Density was 840.8–837.0 kg/m3, revealing a gradual decrease as the BE proportion increases. This suggests that the increased BE content or adding powder emulsifier results in a lower density per volume.
Standard testing method of fuel oil materials.

The flash point for pure MGO (BE0) was approximately 67.5°C; however, it was below 40.0°C for BE10 to BE30. This decrease in flash point compared to BE0 is due to the increased BE content and the additional emulsifier in BE10 to BE30. Additionally, the emulsifier, which is semi-solid, easily undergoes phase change, further lowering the flash point compared to BE0. However, the specific flash points of BE10 to BE30 are not provided because, according to the Pensky-Martens closed cup A method, measurements can be made within 40°C–360°C. Furthermore, the kinematic viscosity decreased from 3.011 to 2.502 mm2/s as the ethanol content increased. This lower viscosity can promote more homogeneous atomization during combustion tests, contributing to more stable combustion characteristics.
Combustion efficiency
Combustion efficiency is the ratio of the heat generated in the combustion chamber to the calorific value of the fuel. This study aimed to compare and analyze the combustion efficiency of increasing BE content against pure MGO (BE0). Combustion efficiency can be derived using various formulas; however, this study used the combustion efficiency formula from the parameter data sheet of the Testo-340 gas analyzer for comparison. The general formula for combustion efficiency can be derived as equations (1)–(3).

where

where

where


where

As with equation (5),

Comparison test results of combustion efficiency.
One-way analysis of variance (ANOVA)
A one-way ANOVA was conducted to verify significant differences in the averages of the exhaust gas temperature, oxygen content, carbon dioxide, nitrogen oxides, and sulfur oxides based on the BE content.
The one-way ANOVA results for exhaust gas temperature were F = 9490.016 and p = 0.000, indicating significant differences at a significance level of 0.01. Tukey post-hoc analysis revealed that the average exhaust gas temperature differed with the BE content. The temperatures were 367.209°C, 359.569°C, 356.891°C, and 346.084°C for BE0, BE10, BE20, and BE30, respectively, with a trend of BE0 > BE10 > BE20 > BE30. This indicates that the exhaust gas temperature decreases as the BE content increases.
Regarding the oxygen content, F = 52,663.323 and p = 0.000, indicating significant differences at a significance level of 0.01. Tukey post-hoc analysis revealed that the average oxygen content differed with the BE content. The oxygen contents were 8.051%, 8.678%, 9.028%, and 9.958% for BE0, BE10, BE20, and BE30, respectively, exhibiting a BE0 < BE10 < BE20 < BE30 trend. This indicates that oxygen content proportionally increases with the BE content. Therefore, oxygen content increases by approximately 1.91% at 30% BE content. This was attributed to the water and oxygen content in the BE and the unburned oxygen in the air supply.
Carbon dioxide had F = 49,714.861 and p = 0.000, indicating significant differences at a significance level of 0.01. Tukey post-hoc analysis revealed that the average carbon dioxide content differed based on the BE content. The carbon dioxide content was 9.309%, 8.868%, 8.611%, and 7.924% for BE0, BE10, BE20, and BE30, respectively, with a BE0 > BE10 > BE20 > BE30 trend. This indicates that the carbon dioxide content decreases as the BE content increases. Therefore, at 30% BE content, the carbon dioxide content decreases by approximately 1.39%. This reduction was due to the reaction of atmospheric oxygen with the fuel during combustion, reducing the carbon dioxide concentration.
Nitrogen oxide had F = 6000.645 and p = 0.000, indicating significant differences at a significance level of 0.01. Tukey post-hoc analysis revealed that the average nitrogen oxide content differed based on the BE content. The nitrogen oxide content was 34.099, 31.439, 29.888, and 23.874 ppm for BE0, BE10, BE20, and BE30, respectively, with a BE0 > BE10 > BE20 > BE30 trend. This indicates that nitrogen oxides significantly decrease as the BE content increases. Therefore, at 30% BE content, nitrogen oxides decrease by approximately 30.0%. This was attributed to the reduction in exhaust gas temperature due to the latent heat of evaporation of BE and the dilution of exhaust gas concentration by the steam generated during combustion, which affects the nitrogen oxide produced in high-temperature regions.
For sulfur oxides, the ANOVA results were F = 82.917 and p = 0.000, indicating significant differences at a significance level of 0.01. Tukey post-hoc analysis revealed that the average sulfur oxide content differed based on the BE content. The sulfur oxide content was 0.084 ppm for BE0 and 0.000 ppm for BE10 to BE30, exhibiting a BE0 > BE10 = BE20 = BE30 trend. Sulfur oxides were 0.08 ppm at 0% BE content and decreased by up to 100% (0.00 ppm) at 10%–30% BE content. The sulfur content of MGO is approximately 0.001%; therefore, the sulfur oxides emitted were detected at less than 1 ppm (on average), indicating excellent fuel quality. Sulfur oxides were not detected at BE levels of 10%–30%; thus, the sulfur oxide emission was zero. Table 8 summarizes the results of the one-way ANOVA.
Analysis of one-way ANOVA for exhaust gas emissions (N = 3600).

p < 0.05. **p < 0.01. ***p < 0.001.
Conclusion
In this study, we selected BE as an alternative fuel to MGO and set four concentrations of BE (BE0–BE30; 0%–30%). Combustion experiments were conducted using a specially manufactured 1-ton standard combustion chamber under experimental conditions similar to the air pollution process test standards to assess the emission reduction characteristics of the MGO–BE fuel oil blends. The conclusions drawn are as follows.
According to the BE mixing ratio, the exhaust gas temperature decreased by approximately 5.8% at a 30% BE content, which was the maximum in this study. This was attributed to the reduction in temperature due to the latent heat of evaporation from the water content in BE during combustion, unburned portion of the supply air, cooling effect from the evaporated heat of BE, and heat loss due to excess air intake.
The oxygen content increased by approximately 1.91% at a 30% BE content. This was due to the water and oxygen content in BE and the unburned oxygen in the supply air. Carbon dioxide decreased by 1.39% at a 30% BE content. This reduction was attributed to the reaction of atmospheric oxygen with the fuel during combustion. Therefore, an increase in BE content had a carbon emission-reducing effect.
Nitrogen oxide contents were reduced from 34.10 ppm for pure MGO to approximately 23.87 ppm as the BE content increased under experimental conditions similar to the air pollution process test standards, indicating a potential reduction of approximately 30% in this study.
Sulfur oxides were detected at 0.08 ppm with 0% BE content but were not detected (0 ppm) with BE contents of 10%–30%. This indicates that MGO has a low sulfur content of 0.01%, demonstrating excellent low-sulfur fuel quality. No sulfur oxides were detected when BE was included, confirming that blending with BE can achieve zero sulfur oxide emissions.
This study revealed the possibility of using MGO–BE fuel oil blend in ships using a standard combustion chamber. Additionally, BE is considered to have excellent potential as a marine fuel and to contribute substantially to reducing exhaust emissions. Future research will include demonstration tests on marine engines and boilers based on the results obtained using the standard combustion chamber. Additionally, we plan to conduct a comparative analysis of exhaust emissions based on various types of ship engines and operating conditions such as load variations and we hope to achieve commercialization on vessels through simulated tests of the ship engines. Our future research includes experiments on optimized combustion conditions using special burners for which the supply air volume can be controlled.
Footnotes
Appendix
Main parameters of the reference model.

| Symbol | Definition | Value | |
|---|---|---|---|
| O 2ref | Reference value | 21% | |
| K gr | Specific parameter data coefficients for light oil | Gross calorific | 0.48% |
| MH2O | hydrate compound | 0 | |
| H | Hydrogen | 13 | |
| Q gr | Gross calorific value | 45.6 | |
| K 1 | Constant based on gross or net calorific | 53.0 | |
| A2/B | Factory release at setting coefficient | 97.14 | |
| K k | Condensate below the dew point | – | |
Handling Editor: Chenhui Liang
Declaration of conflicting interests
The author(s) declared no potential conflicts of interest with respect to the research, authorship, and/or publication of this article.
Funding
The author(s) received no financial support for the research, authorship, and/or publication of this article.