
Abstract
This work presents the structural design of a propeller, with its profile established using the OpenProp software for a 5 m long competition catamaran at a speed of 5.5 m/s. The materials selected using the Ashby method were polymer matrix composites, and the chosen manufacturing method was vacuum bagging. The determination of the stacking sequence was initially done using panel theory and the macromechanics of composite materials. The stacking sequence was then optimized using the finite element method with Abaqus CAE. Experimental validation was conducted through instrumented cantilever bending tests on both specimens and the blade. The finite element results showed errors of less than 5% compared to the experimental measurements, thus validating the simulations and allowing the blade to be designed with static safety factors greater than eight under operational service conditions.
Keywords
Introduction
The efficiency of ships depends on several parameters, among the most important of which are the type of motor, the geometry of the hull and propeller. 1 The geometry of the propeller will not present the same efficiency for each speed regime and displaced volume for the same boat, hence variable geometry propellers exist. The stiffness and weight of the propeller are aspects that also contribute to its efficiency, this explains the use of polymer matrix composite materials with high specific stiffness and strength especially for competition boats.
This work presents the structural design of a 4-blade propeller with a NACA 65A010 profile, shown in Figure 1. This aluminum propeller is commonly used in electric-powered catamaran boats for the competition organized by Hydros Foundation, 2 known as “Hydrocontest.” These boats are about 2.5 m in length overall (LOA) and 0.5 m in beam, and travel at a speed of about 5.5 m/s. Due to the complexity of the blade geometry, both the panels’ theory and finite elements (FE) were used for the structural design. The selected materials were carbon fiber and a core of epoxy resin with hollow glass spheres. The vacuum bag method was used for the manufacturing of a quarter of the propeller, which was used for experimental validation of its stiffness and stresses developed.

Propeller geometry obtained.
Methodology
Geometry and blade forces
The design process begins inserting parameters into the OpenProp
3
software such as: boat speed (5.5 m/s), propeller profile (NACA “a = 0.8 meanline and NACA 65A010 thickness”
4
), rotor diameter (0.3 m), hub diameter (0.042 m) and desired thrust (500 N). This software determines the geometry of the propeller and calculates the external hydrodynamic forces (thrust and drag). The lift coefficient (
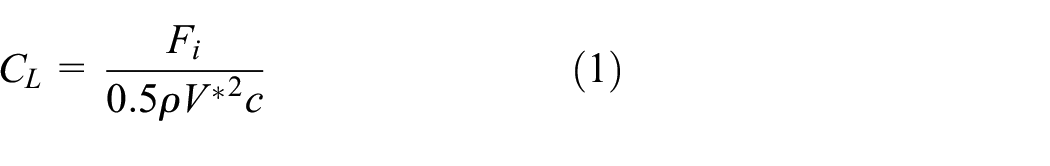

The different forces acting on the blade are shown in Figure 2. Here, ρ is the density of water, c is the chord length of the blade,

Force scheme used by OpenProp software.
Using the OpenProp output data, we can obtain the values for forces

Since these are distributed forces, units of N/mm are used. However, since they will be used in finite element software as pressures, these values must be divided by the chord length at each point to obtain a pressure distribution function. A second-order polynomial was fitted to approximate these data sets (Figure 3), and this polynomial was used to describe the pressure distribution.
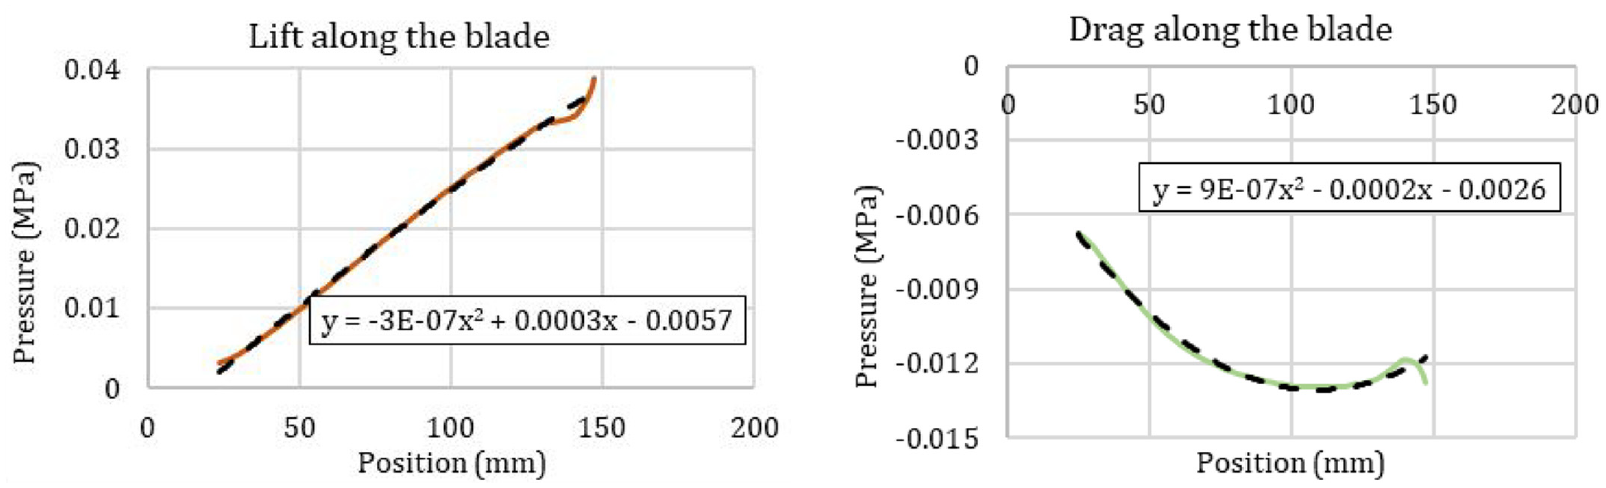
Pressure distribution on propeller: UP thrust pressure and DOWN drag pressure.
Materials and manufacturing method selection for the blade
The selection of materials was conducted using the Ashby 7 method, assuming that the blades can be considered panels subjected to cantilever bending: The objective function was to minimize the mass while maximizing the stiffness, restricted to materials with a fracture toughness greater than 20 . MPa*m0.5, 7 and to materials with “excellent” resistance to a saline water medium. The performance index is shown in equation (4) 7 :

Where E and ρ stands for the elastic modulus and material density, respectively. Using ANSYS GRANTA EduPack 8 software the results shown in Figure 4 are obtained. Following this, the most suitable materials are epoxy matrix composites reinforced with unidirectional carbon fibers. However, due to torsion loads, 45° aligned fibers are required, thereby plain or twill weave fabrics must be added to unidirectional ones.

Material selection for layers using ANSYS GRANTA EduPack 8 for a panel with minimum weight and maximum stiffness.
If the goal is to achieve further weight savings and given that the blade has a thickness of 7 mm, composite materials can be employed with a cored-sandwich configuration. For the core materials candidates, the objective function is to minimize mass while maximizing shear stiffness (G). To achieve this, the elastic modulus (E) must be substituted by G in equation (3). Tensile strength was limited to a minimum of 10 MPa due that the core will have to withstand shear and tensile loads, furthermore, this will help to take out core materials as aluminum and PVC foam which are hard to shape and would be difficult to implement during the manufacturing process. The selected material, as shown in Figure 5, will be an epoxy resin filled with hollow glass microspheres, which can be mixed and poured during the manufacturing process.

Material selection for core using ANSYS GRANTA EduPack 8 for a core with minimum weigh and maximum shear stiffness.
Material design
Mechanical properties of materials
Since selected materials are polymer matrix composites, it is necessary to determine local available materials and with this, the approximate stacking sequence. Additionally, material properties must be calculated and will depend on the raw materials and the manufacturing process. For this work, vacuum bagging with prepregs was selected, similar to those used in Marin 9 ).
Table 1 shows raw materials commercially available in Colombia.
Raw materials available in Colombia.

Table 2 shows properties for composite materials using raw materials from Table 1. Properties tagged with asterisk (*) were measured using strain gauges, others were taken from literature. 14
Properties for raw materials available in Colombia.

Source: Barbero. 14
Tensile properties for the core were extracted from matrix datasheet 12 and diminished using the rule of mixtures assuming hollow glass microspheres are air and represent a volumetric fraction of 0.4, these properties are shown in Table 3.
Properties for manufactured core using epoxy resin and hollow glass microspheres with volumetric fraction of 0.4.

Stacking sequence preliminary determination
For the initial estimate of stacking sequence, Hexcel 15 sandwich panel theory was used, with this is possible to calculate blade deflections using equations (5)–(7).
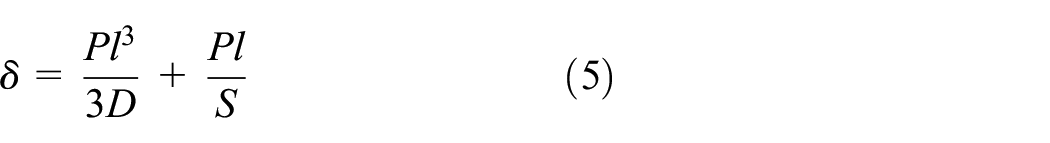


Where


Sandwich cross section with geometric variables.
Normal stresses of sandwich skins (


The elastic modulus for the whole sandwich skin (
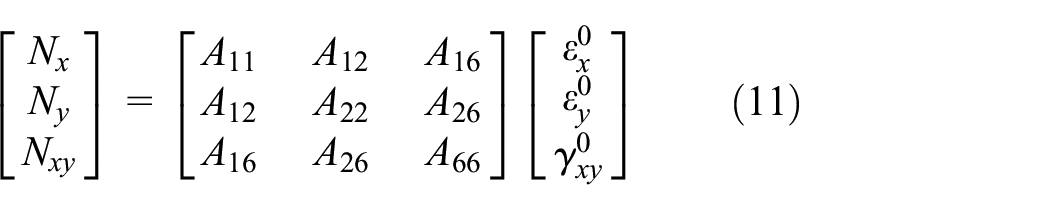
Using properties from Table 2, stiffness matrix (ABD) is calculated. This matrix correlates the forces applied to the laminate [N] and unitary deformations [

These results were used to calculate several panel configurations shown in Table 4, which shows calculations for a panel with 7 cm width, 12.5 cm length, 7 mm in thickness, and a core about 5.0 mm in thickness.
Stacking sequence effects on composite sandwich stresses and deflections in cantilever.

Maximum load 125 N: Ef predicted using micromechanics (equation (12)) and the rest of variables through equations (5), (9), and (10). Where U: unidirectional fabric; T: Twill fabric.
Now that the skin stacking sequence is defined, finite elements simulations and experimental validations can be performed.
Finite element simulation and validation methods
Three finite elements models were done:
The first model simulated a simple beam to evaluate the ratability of the FE simulation. Then, one of the blade’s skins was simulated and validated to test the manufacturing procedure and to check the FE simulation in a more complex structure than a simple beam. Finally, a quarter of a cored blade was manufactured, simulated, and tested.
In all FE simulations, the part was modeled in Abaqus CAE 19 software using 3D plane stress shell elements, squared shape and quadratic formulation, 20 where composite thickness is assigned as a property. 21 The stacking sequence design was made using the “Composite layup” tool,19,20 which allows assigning several plies with varied materials and orientations to the same shell using classic laminate theory to apply geometric properties and sections to surfaces. “Conventional shell” elements were used with Gauss integration, with three integration points per ply to calculate values in thickness. Simulation parameters were configured in the Step module. One general static step was created considering the nonlinear or large-deflection effects (NLgeom).
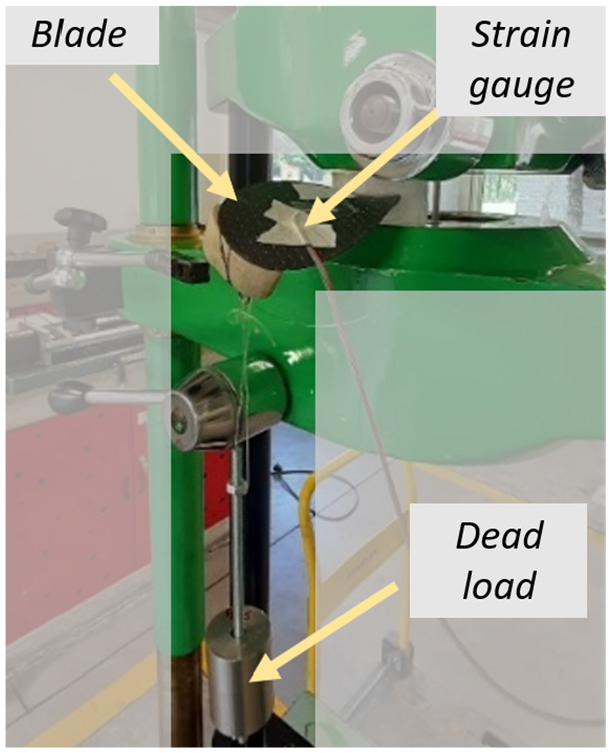
For the simple beam bending simulation, the following dimensions were used: 150 × 12.8 × 0.78 mm. The stacking configuration was [U0 T0 U0]. For the boundary conditions, the beam end was fixed, restricting all degrees of freedom; a force per unit area (Surface Traction) with a specific direction vector was applied at the tip of the composite. Five repetitions were done. The same beam was manufactured (see section “Manufacturing of composites samples and one quarter of propeller for the FE validation”) and subjected to bending tests with strain gauges to measure unitary deformation, and deflection was measured using a digital camera and image overlap using ImageJ software. 22 The load was applied using different verified weights, with a maximum weight of 252 g. The experimental setup can be seen in Figure 7.

Experimental setup to measure deflection and unitary deformation on a composite material beam, stacking sequence [U0 T0 U0] loaded in cantilever.
Once the simulation model was verified, one blade skin was manufactured (see Section “Manufacturing of composites samples and one quarter of propeller for the FE validation”), simulated, and experimentally verified for the deflection and unitary deformation values. Five repetitions were done. The experimental setup is shown in Figure 8. In this case, the reference orientation is shown in Figure 9 and was configured such that the main direction was aligned with the blade span.
Experimental setup to measure deflection and unitary deformation of one blade ply, stacking sequence [U0 T45 U0] loaded in cantilever.

Reference orientation for simulation of 1/4 of blade.
Finally, once the results of the skins simulations were validated, 1/4 of the propeller was manufactured (see section “Manufacturing of composites samples and one quarter of propeller for the FE validation”) and subjected to an instrumented bending test, using a digital dial comparator to measure deflection on the edge and strain gauges to measure unitary deformation, the experimental setup is shown in Figure 10. Five repetitions were done. Additionally, another FE model was made, similar to the one made for the skins, but using 3D solid finite elements for the core and adding the proper parameters to the field output variables to verify the fulfillment of the Tsai Hill failure criteria for composite materials. 23

Results of the instrumented test setup in a quarter of propeller.
Manufacturing of composites samples and one quarter of propeller for the FE validation
The manufacture of the sample test specimens, including one quarter of the propeller skin, was conducted using the vacuum bag method with manually pre-impregnated fabrics. In the case of the simple beam, a flat glass was used as the mold. In the case of the skin blades, the models used were manufactured using a 3D printer with PLA filament. The models were polished with 600 grit sandpaper and then coated with acetone. The remaining imperfections were coated with a polyurethane putty to improve the surface finish (see Figure 11(a)). From these models, molds were obtained by manual lamination with polyester resin and glass mats (see Figure 11(b)).

(a) Models after sanding and acetone application and (b) FRP mold and templates used for cutting carbon fabrics.
Finally, templates for the skin fabrics were fashioned using a lightweight fabric, following the contours of the blade within the mold, as depicted in Figure 11(b). This process facilitated the elimination of wrinkles and ensured proper alignment of the fabrics with the mold’s geometry. Additionally, a template was crafted for the fiber reinforcement in the hub-blade transition zone. Both templates and their placement are illustrated in Figure 11(b). The templates were deliberately oversized by 3 mm around their periphery, addressing the issue of edge inhomogeneity and providing flexibility in fabric positioning within the mold.
Figure 12(a) shows the positioning of a Twill fabric in the middle of two plastic bags. Then the epoxy resin was prepared and impregnated into the fiber fabrics with the help of a plastic spatula. Finally, the fabrics were cut and positioned in the mold, as shown in Figure 12(b). This figure also shows a vacuum extender previously manufactured in polyurethane to force the fabrics to follow the shape of the mold in the hub-blade transition zone.

(a) Twill fabrics inserted between two plastic sheets with templates and (b) polyurethane model, marked with the arrow, placed in the hub area to force the fabrics to copy the shape of the mold.
After 24 hours, the composite skins were demolded and trimmed using a motor tool, as illustrated in Figure 13(a). Subsequently, the two skins were positioned in the molds, which were then closed, as depicted in Figure 13(b), to inject a mixture of epoxy resin with hollow glass microspheres.

(a) One skin of the blade and (b) propeller skins mounted on the mold and ready for core pouring.
Results
Manufacture of a quarter of blade
Figure 14 shows the manufactured quarter propeller, with a weight of 32 g, representing a decrease of approximately 75% with respect to a blade with the same geometry made of solid aluminum.

Blade manufactured with composite materials and in the process of preparation for instrumented tests.
The cross section of the blade is shown in Figure 15, where the skins and the core of the composite material can be differentiated:

Microstructure of the blade cross section: (a) 50× magnifications image shows the core with the microspheres and three carbon plies: U0 T0 U0, (b) and (c) show a close-up view of the external skin revealing some resin rich areas, particularly within the unidirectional fabrics.
In general, the cross section shows that there are few porosities in the sandwich skins and some resin rich zones, especially in the unidirectional fabrics which will surely decrease the fatigue strength life. 24 Uniformly distributed microspheres are also observed in the core. For the analyzed cross section, perpendicular to the main axis of the blade, an average thickness for the twill fabric of 200 ± 5 µm and 293 ± 10 µm for UD fabric was found, giving a total thickness of 786 ± 15 µm for the skin of the sandwich (30 measurements were performed along the section of the sample).
Finite elements simulation
Simulation results and validation of the cantilever beam
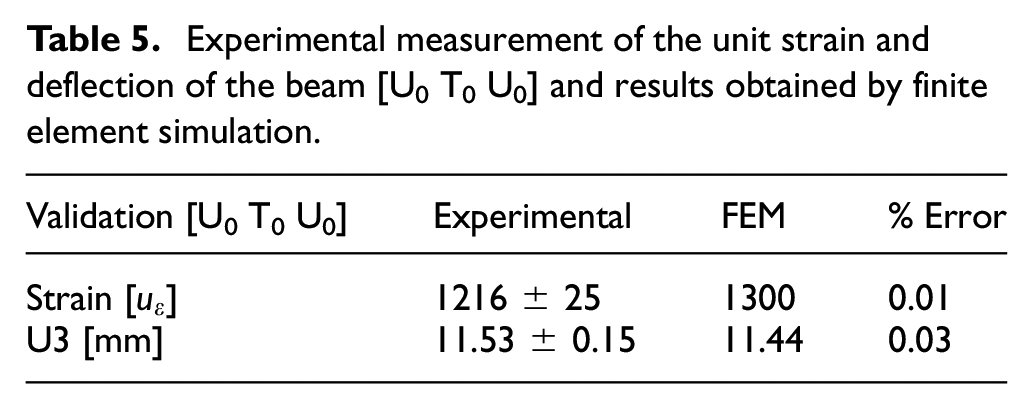
Figure 16 shows the numerical predictions of displacements and deformation of the cantilever beam [U0 T0 U0]. Table 5 compares the experimental measurements with the finite elements results. This comparison validates the FE simulations since it shows that the set of parameters for thicknesses, properties, and, in general, the simulation setup produces small errors with respect to those obtained experimentally.

Simulation results of the cantilever beam with a stacking sequence [U0 T0 U0]: (a) Magnitude in mm, and (b) elastic modulus in MPa.
Experimental measurement of the unit strain and deflection of the beam [U0 T0 U0] and results obtained by finite element simulation.
Simulation results and validation of the blade skin
Figure 17 shows the results of the propeller blade skin FE; this simulation was performed with a [U15 T45 U15] stack sequence due to a 15° deviation in the unidirectional web positioning during blade fabrication. The maximum deflection value measured experimentally at the very tip of the blade using image correlation techniques was 8.96 ± 0.16 mm, while the finite element simulation yielded a result of 10.3 mm, which gives an error of less than 13% in the computational prediction. Given the deviation in the ply angles from the specified orientation (with the twill layer clearly deviating from the target 45°, but unquantified as it is sandwiched between the unidirectional layers), these predictions are considered acceptable, and the method is validated. The next stage was the manufacture of the quarter propeller for the experimental validation of the finite element simulation.

Blade skin FEM results subjected to static load of 540 g in cantilever with stacking sequence [U15 T45 U15]. The maximum deflection of 11.1 mm corresponds to the load application point at 5 mm from the blade tip, the deflection of the tip is 10.3 mm: (a) maximum strain in main direction, and (b) maximum deflection in mm.
Simulation results and validation of the propeller
Figure 18 shows the simulation results of a quarter of the propeller. The simulation was performed with a [U15 T45 U15] stacking sequence due to a 15° deviation in the unidirectional web positioning during blade fabrication. A maximum load of 8 kg was applied near the tip of the blade. Figure 10 shows the experimental deflection value. Table 6 summarizes the results, showing that the maximum deflection value measured experimentally was 5.04 ± 0.10 mm, while the finite element simulation yielded a result of 4.81 mm, resulting in an error of less than 5%. Moreover, a strain gauge located at the top of the blade skin (see Figure 14) measured strains for comparison with FEM simulation results, as shown in Table 6. There is good agreement between the predicted and experimentally measured strain values.

Simulation results of one quarter of the propeller subjected to a static load of 8 kg in cantilever with a layup of [U15 T45 U15] on the skins and epoxy resin core loaded with hollow glass spheres: (a) maximum deflection in mm, and (b) maximum strain in main direction.
Measured and predicted static unit strain and deflection for a quarter propeller.

With these results, the finite element simulation was fully validated, allowing the propeller simulation to proceed with the actual loading conditions, which include the application of distributed dragging, thrust pressure, and inertial forces, described in section “Geometry and blade forces.” The results in Figure 19 clearly show that the propeller design is structurally optimal, with almost the entire structure having static factors of safety higher than 8 25 (Tsai-Hill safety value TSH < 0.12, Figure 19) and maximum deflections lower than 0.5 mm. Only at the root of the blade is the factor of safety less than 2.3 due to the stress raisers, which can be resolved by adding an extra layer of carbon ply. Considering the good fatigue resistance of carbon fiber composites, the propeller is expected to have a long service life and meet its design objectives.

(a) Stresses in the main direction of the fibers (S11 [Pa]) in the tensile face of the blade, (b) Tsai-Hill number obtained in the blade, and (c) maximum deflection of the propeller.
Conclusions
The materials chosen for propeller manufacturing were well-suited to the production process and demonstrated satisfactory mechanical performance, achieving a static safety factor of 8 in most of the blade. This design allows for a significant weight reduction of up to 75% compared to a component made of solid aluminum, a commonly used material for the manufacture of low-diameter propellers.
Finite element computational simulations were validated in three distinct scenarios: a cantilever bending beam, one blade skin, and a quarter of the propeller made from a sandwich composite material. The variations between the values predicted by the numerical model and the experimental results were below 5% in the blade validation, indicating a close agreement between both approaches. This instills confidence in the mechanical design conducted.
Footnotes
Handling Editor: Riccardo Nobile
Declaration of conflicting interests
The author(s) declared no potential conflicts of interest with respect to the research, authorship, and/or publication of this article.
Funding
The author(s) disclosed receipt of the following financial support for the research, authorship, and/or publication of this article: To the Universidad Nacional de Colombia, Medellin, for funding this work through the project: UN INNOVA-2019-202, code 48715. To Mr. S. Cadavid for his help with the calculation of thrust and dragging loads.