
Abstract
In this study, the thermodynamic performance of a ventilated brake disc was improved by securing structural stability and verified through bench experiments. A brake disc is a braking device that decelerates a vehicle or stops it, and the disc should maintain a reliable braking force. The temperature rise on the disc surface has the greatest effect on the braking force. In recent years, many studies have been conducted on the shape of the disc in order to secure stable braking force and heat dissipation at the same time. However, as the disc surface is processed further, it becomes more difficult to have stable braking force, although the heat dissipation property is improved. Therefore, in this study, disc shapes were designed to improve heat dissipation performance while maintaining structural performance. The stress and temperature distribution were analyzed using ANSYS and optimal design of disc shapes was performed through PIAnO. In addition, to compare and verify the initial model and the optimized model, a prototype was fabricated to judge the feasibility of the optimization using a dynamometer. It can be expected that the heat dissipation performance and driving safety can be improved by using new brake discs.
Keywords
Introduction
A brake disc is a braking device that decelerates a running vehicle or stops it, and the disc must maintain a reliable braking force. Due to the thermal energy generated during vehicle braking, the temperature of the surface of the disc rises on the friction surface, fatigue accumulates, and cracks may form.1–3 In addition, when the brake is overheated, the surrounding structures are affected. It is important to secure stable braking force and heat dissipation because the lining may be damaged, or a vapor lock phenomenon may occur and cause fatal problems while the vehicle is running.4,5
It is possible to improve heat dissipation performance by drilling a hole in the friction surface of the rotor. 6 However, the more holes are drilled, the more structurally vulnerable they become, and the possibility of cracks occurring around the holes increases. 7 Therefore, various studies are being conducted to improve the heat dissipation effect without structural weakness, but studies on coupling analysis and optimization of ventilation structure considering two or more characteristics are insufficient8–10
The studies of the brake disc shape considered structural and thermodynamic characteristics, but the validity of the relationship between the design variables and the objective functions was insufficient. It was not an optimal shape to select one of several shapes. 11 There are also studies that have conducted experiments, but have been conducted to establish simulation procedures, are limited to identifying problems, and are difficult to consider as experiments for validation of optimal shapes. 12 Furthermore, previous disc-related studies lacked experimental data obtained from benchmarking tests of the results derived from the analysis, making the analysis not sufficiently validated.13,14
Therefore, in this study, the shape of a brake disc was optimized to improve the thermodynamic performance while securing the structural stability of the ventilated brake disc. The result was verified through bench experiments. Structural and thermal analyses were conducted using ANSYS, which is a finite element analysis program, for the shapes of holes and slits to secure stable braking force while improving heat dissipation performance. 15 Based on the results of the analyses, changes in stress and temperature values in the analysis results according to changes in design variables were compared and analyzed using design of experiments in PIAnO, which is a multi-disciplinary integrated optimal design program. In addition, through design problem formulation, object functions were set to minimize stress and temperature, and through optimal design, a brake shape model was derived in which both structural stability and heat dissipation performance were improved compared to existing discs. Finally, a disc heat dissipation performance experiment was performed using a dynamometer to secure the reliability of the finite element analysis and the predicted optimal value.
Progression procedure and introduction of the brake disc
Progression procedure
The study procedure to derive the optimized disc while considering cooling performance and structural stability is shown in Figure 1. To find a brake disc shape that minimizes the surface temperature and stress distribution of the disc during braking, a design problem formulation was carried out first to select objective functions and set design variables that have the most effect on the objective functions. Through the design problem formulation, design variables were selected by defining them in the forms of discrete and continuous variables. In addition, efficient designs of experiments according to the levels of the design factors were defined.

Progression procedure.
Next, finite element analysis (FEA) was conducted. To understand the structure and cooling performance, it was assumed that all kinetic energy would be converted into thermal energy, and the input conditions for individual analyses were calculated. Next, structural and thermal analyses were conducted on the test points derived through the design problem formulation. Optimal design was carried out based on the resulting data obtained through analyses of test points.
The optimal design was carried out with two optimization algorithms: the HMA method, which enables reasonable calculation, and the MOGA method, which considers weights for efficient design because there were two objective functions. Next, through analysis of the resulting data, individual results were compared, and a comprehensive evaluation was carried out to derive an optimized disc drawing. As the final process, an experiment was conducted using a dynamometer to verify the predicted optimal value through FEA and the optimization program.
Brake disc model
As shown in Figure 2, the disc brake system is largely divided into a rotor and a caliper and consists of a mounting bracket, a shim, a pad, a rotor, a caliper, a cylinder body, and other components. The rotor is a disc, and the caliper is fixed to the car body. Inside the caliper, there is a brake pad to hold the disc and a piston to hydraulically push the pad. During braking, pressure is applied to the hydraulic system, and the resulting hydraulic force is transmitted to the wheel cylinder through the brake line and converted into mechanical force. At this time, high-temperature heat is generated due to frictional force and affects the mechanical behavior. Therefore, disc selection considering the heat dissipation performance and structural properties is important.

Vehicle disc brake system structure.
The brake disc used in this study is a ventilated disc, as shown in Figure 3. Unlike one flat solid disc, in this brake disc, two flat discs overlap with each other at a certain space. Therefore, the ventilated disc quickly lowers the surface temperature to improve braking and helps extend the life of the disc. In addition, it is possible to reduce weight and maximize cooling performance by making additional through-holes on the disc surface. 16 The brake disc model used in the NF-15 Fr model was selected as the subject of this study, and cast iron with excellent wear resistance and crack resistance was selected as its material. The main structural parameters and material properties of the brake disc are shown in Tables 1 and 2.

Disc model.
Parameters of the components of the brake disc.

Material properties.

Formulation of design problems
Finding a brake disc shape that minimizes the disc surface temperature and stress distribution was set as the goal of the optimal design. Among the design variables of the brake disc, four variables were judged to be variables that can have the greatest effects on the temperature and stress distribution: the shape, diameter, length, and the number of holes. The formulated design problems are as shown in equation (1).
Three types of processing were defined as discrete variables: “hole,”“slit,” and “mix.” As shown in Table 3, the processing shapes of the outer surface of the disc were three types of structures: a hole type with four holes at regular intervals, a long slit type, and a mixed type in which the hole and slit types are mixed. Other variables were set in the form of continuous variables with lower and upper limits. Since the selected design variables included discrete variables, an orthogonal array (OA) was selected among the designs of experiments provided by PIAnO, which is an integrated optimal design program. The design of experiment has an advantage that the number of experiments can be reduced by detecting a part with the main effect and interaction without obtaining unnecessary interactions. Therefore, 36 test points were created by defining the factors of each design variable at three levels, and the values of the objective functions according to changes in the design factors of each test point were derived through FEA. 17

Three types of ventilated brake discs.

To minimize Stress, Temperature
Shape = {Hole, Slit, Mix}


FEA
Analysis model and boundary conditions
FEA was performed to compare and analyze the stress and temperature distributions according to shapes. Creating a good-quality mesh is a very important process because it enables maximizing time efficiency and deriving accurate analysis results. Among mesh setting methods, refinement is a tool that repeatedly performs a procedure to find a solution, calculate error estimates, and redefine elements in areas with high error rates. 18 Therefore, in order to increase the accuracy of the solution, the outer surface, which is a part that has a large effect on the analysis and the inner surface where the blades are, were set as “refinement,” and the number of mesh elements was set to 550,000. Figure 4 shows the mesh of the finite element model.

Finite element model.
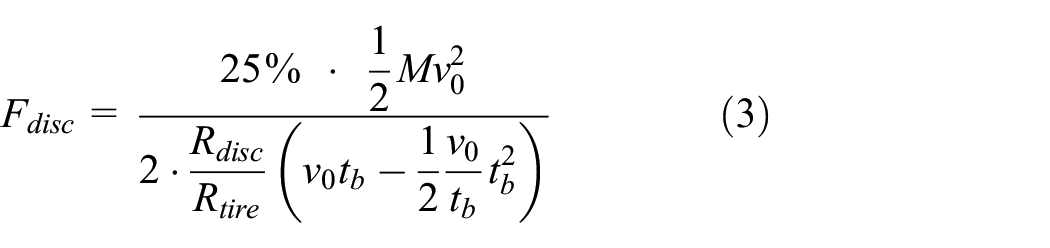
The thermal energy generated by the brake disc and pad during braking is equal to the vehicle’s total kinetic energy, the wheel’s inertial energy, and potential energy. 19 However, in this paper, it was assumed that all friction occurring between the brake disc and the pad is converted into thermal energy. A boundary condition was imposed so that pressure was applied to the front surface of the disc. In addition, fixed support was imposed on the part where the bolts are fastened on the back side of the disc, and rotation speed was imposed on other parts. Using the vehicle data given in Table 4, the values of the constraint conditions required for structural analysis were calculated and analyzed through equations (2)–(4) before conducting the analysis.

Vehicle data used for boundary conditions.

where
The external pressure between the disc and the pad is calculated with the force acting on the disc. The hydraulic pressure is shown in equation (4).

Boundary conditions.
Results of structural and thermal analyses
Figures 6 and 7 show the results of structural and thermal analyses and the stress and temperature distributions according to the three shapes. Among the 36 test points, the shape with the lowest maximum stress was one of the hole shapes at 62.9 MPa. When the stress is small, braking safety can be secured and cracks can be prevented by dispersing the stress concentrated on the through hole. Assuming the heat dissipation time after braking is 10 s, the resulting temperature distributions according to time were shown. The temperature distribution were compared with those that had been recorded at 5 s. In the thermal analyses, the shape with the lowest temperature was the hole type. The hole shape shows lower temperature distributions than other shapes because convection occurs actively at the contact surface in the case of hole shapes.

Equivalent stress of the three types of discs.

Temperature distribution of three types of discs.
Shape optimization
Optimal design
Figure 8 shows the process of optimal design. Data analysis for the possibility of optimization and the definition of design variables was performed first. By analyzing the data, it is possible to judge whether the design requirements are satisfactory for the formulation of the design problems, and time can be saved by modifying the shape before optimization. After data analysis was completed, a metamodel was created.

Process of the optimal design.
The metamodel replaces the real model. A real model requires much time and money. A metamodel is burdensome in interpretation, but it does not require a large number of analyses. Therefore, a metamodel was used because it was judged to be suitable for the design area search and optimal design, which require much analysis. Next, based on the created metamodel, optimal design was performed using two techniques. HMA and MOGA were compared and analyzed to derive the optimal value.
Through the Reviewer provided by PIAnO, sensitivity analysis was conducted to understand the influence of the design variables of the objective function. The sensitivity graphs are shown in Figure 9. The first one is a graph of sensitivity of stress to design variables. The design variable that had the greatest influence on stress was the shape of processing, which accounted for 71%, followed by the diameter at 11%, the length of processing at 9.3%, and the number of processes at 8.3%.

Sensitivity analysis of objective functions.
The second one is a graph of sensitivity of temperature to design variables. It can be seen that the shape of processing has a much larger effect compared to other variables. The effect of the shape of processing accounts for 93% of the entire effect, and the effects of the remaining variables account for 7%. The best values were derived through analyses according to the correlations between the objective functions and the design variables, but in order to derive more improved results, a metamodel was created to derive the optimal values rather than the best values derived between the test points.
Before optimal design, the model was numerically approximated based on the inputs and outputs to create a metamodel. Optimal design was carried out based on the metamodel. The experimental points (training points and test points) used in the creation of the metamodel were utilized. Equation (5) is a standard equation for judging the use of test points, and equation (6) is a standard equation for selecting the number of test points.


A total of 15 metamodels such as EDT, KRG, and PRG_B were created, and those with the smallest values of individual objective functions were selected. As a result, MLP_custom was selected for stress, and RBFr was selected for temperature. Optimal design was carried out with the two metamodels. HMA and MOGA were used as optimization algorithms.22–24 HMA is faster than other algorithms because it sequentially adopts the average of values and is accurate because incorrect matches are automatically removed. However, HMA does not consider weights and was judged to be insufficient to apply in this study with two objective functions, so MOGA was also used. MOGA derives each optimal value by considering multiple weights. 25
Table 5 shows the resulting values derived through the HMA algorithm. Since HMA cannot consider weights, a total of 10 weights were directly substituted to carry out the optimization:stress:temperature = 0.1:0.9–0.9:0.1. It can be seen that the weight of temperature must be increased to 0.7 or higher to maintain 64°C, and the stress is 59 MPa. In addition, when the weight of the temperature was 0.6 or smaller, the proportion of changes in stress became larger, so the optimum values of the temperature of 65°C and the stress of 53 MPa were derived. Figure 10 shows the resulting values derived through the MOGA algorithm. Unlike HMA, the results of MOGA are derived in the form of a graph. The final optimal values came from choosing minimums. These are the smallest that participate in HMA and MOGA equally.
Optimal values using the HMA method.


Optimal values using the MOGA method.
Model from optimization result
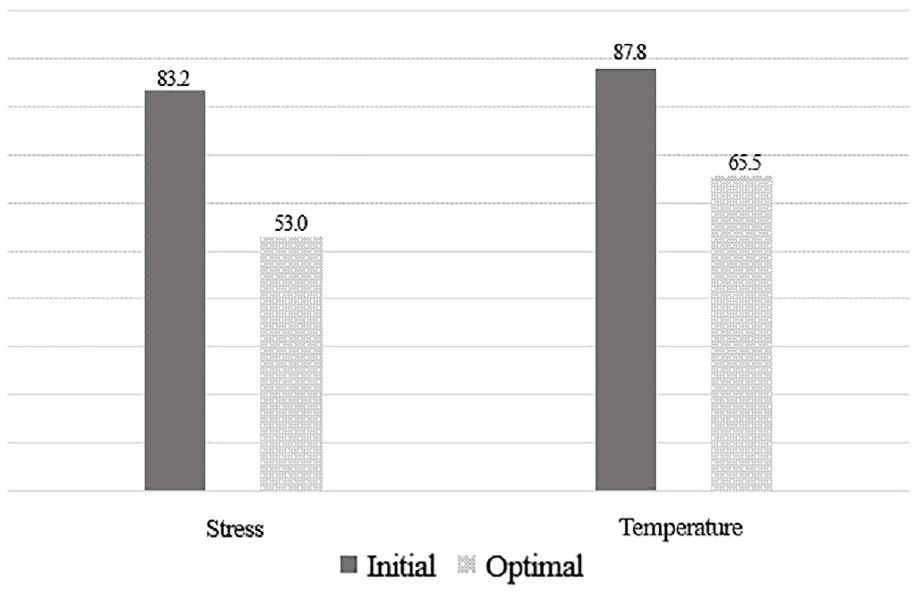
The results of performing the optimal design are as follows. Figure 11 shows the differences between the initial and optimal values of the two objective functions. Since the initial model was a ventilated disc where the surface was not processed, there were no design variables for processing, and the resulting values derived by separately carrying out stress analysis and temperature analysis were compared with the optimal values. It was identified that the stress decreased from 83.2 to 53 MPa. Also, it was found that the average surface temperature of the initial model at 87.8°C decreased to 65.5°C in the optimized model.
Comparison of optimal and initial objective function values.
Table 6 shows the optimal values of individual design variables. The optimal values of individual design variables were the hole shape (which is a discrete variable), 5.3 mm for the diameter of the hole, 25.4 holes, and 36.1 mm for the length of the hole. Based on this, a new disc shape was drawn as shown in Figure 12 below. Considering the disc manufacturing process for the test progress, 25 holes were made, even though the number of holes derived was 25.4, and the length of the holes was made 36 mm, even though the length of the holes derived was 36.1 mm.
Comparison of optimal design variable values.


Comparison of optimal and initial objective function values.
Verification of predicted optimal values through dynamometer test
Test process
Actual vehicle tests should be conducted to identify the braking and heat dissipation effects of the discs derived in this study and to verify the reliability of the results the FEA. Therefore, a performance test was conducted through a single dynamometer with the MODE 881 test standard for a general performance test. 26 The test configuration is shown in Figure 13. The brake disc was connected to the rotating part of the dynamometer, and pads and calipers were mounted on the disc. The measurement was carried out by making a hole in the rear surface of the disc and a hole in the area of the pad friction material and inserting sensors into the holes.

Brake dynamometer equipment.
In the experiment, two kinds of tests were conducted: a burnish test and a fade-and-discovery test. The burnish test was the first test and was conducted to obtain a physically sufficient contact surface between the friction material of the pad and the disc. Through this test, a sufficient contact area between the disc and the friction material can be secured, and the temperature and stress of the disc when the disc and the friction material come into contact with each other can be identified. The burnish test’s driving conditions were a rotation direction of CW, initial speed of 65 kph, initial pad temperature of 80°C, wind speed of 11 m/s, and pedal force of 0.35 G. The test was repeated 100 times.
The fade-and-discovery test is used to identify the effect of the friction material and the disc temperature, which change during consecutive braking in a limited time. The braking is carried out in a situation of running on a road on a mountain or hill in order to see if certain levels of friction coefficient and heat dissipation are secured when the temperatures of the friction material and disc have risen to high temperatures due to consecutive braking. The test was carried out 15 times under the driving conditions of rotation direction of CW, initial speed of 100 kph, time limit of 120 s, wind speed of 11 m/s, and pedal force of 0.45 G. The speed was then reduced to 50 kph, and the pedal force was reduced to 0.3 G to compare the effects of the brake in order to investigate the degrees of recovery from heat. Other detailed test information is shown in Table 7.
Dynamometer information and test environment.
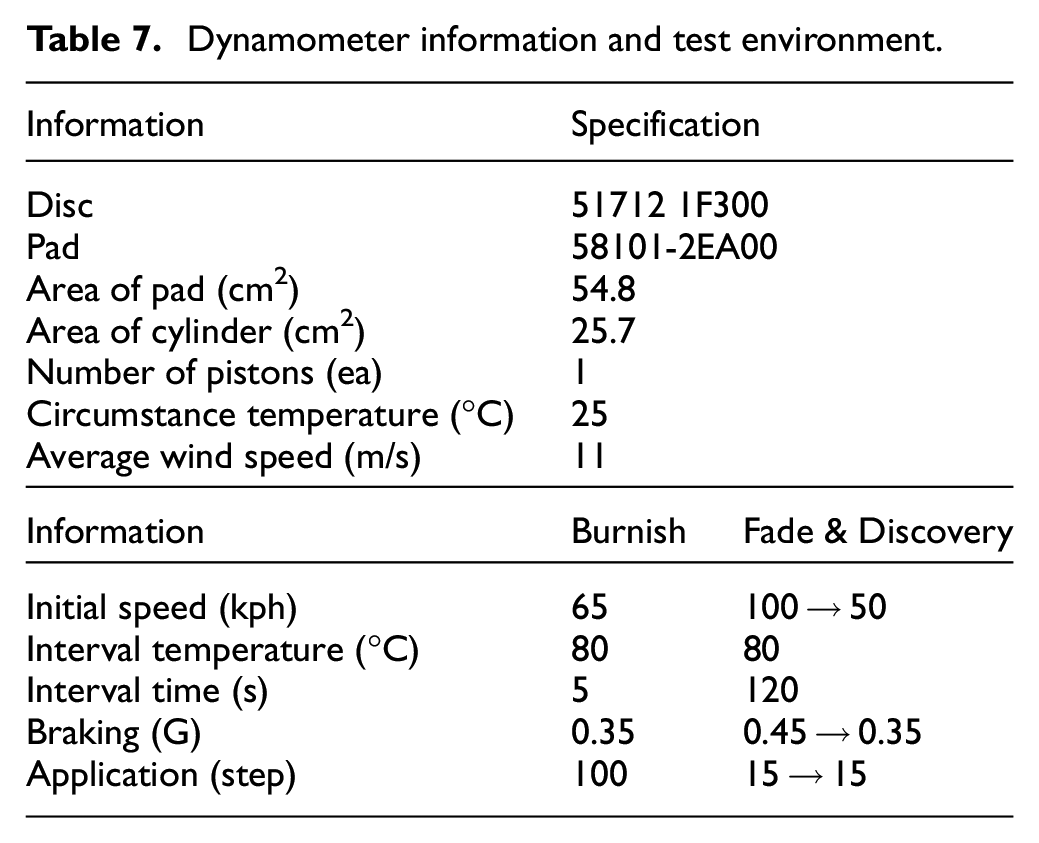
The wind speed value used in the two tests means that arbitrary cooling winds are supplied to the brake parts in the test when considering the cooling of the brake during running. According to the purpose of the test, there are cases where the wind speed changes or the wind blows in response to a change in vehicle speed due to deceleration. However, it is difficult to implement the same cooling wind in actual car tests and in dynamometer tests because the brake installation states are different. Therefore, during general performance tests and wear tests, the cooling wind speed is fixed at around 11 m/s and is applied by changing the vehicle speed according to the conditions.
Comparison and analysis of the results of dynamometer tests
Figure 14 shows a graph for comparison of the temperatures and stress of general discs and optimized discs at every time of the test conducted with the results of the first dynamometer test. Of the 100 Burnish Tests conducted, a total of 10 findings from every 10 units were confirmed. It can be seen that the pressure and temperature of the optimized discs are lower than those of existing discs. The reason why the temperature of the optimized disc was higher than that of the existing discs in the 20th and 100th tests is that uneven heat flux distributions or concentration of heat flux at a certain moment may occur on the surface of the disc, leading to a rapid temperature rise.

Result of burnish test.
In terms of structures, it can be seen that the force received by the optimized disc is smaller than that of the existing disc. Since the optimal stress values appeared in the form of a rising curve, a second test was conducted. The second test was conducted 35 times, and the other conditions were the same as in the first test. In the second test, it could be seen that the values of the optimized disc were also smaller than the values of normal discs. In addition, no cracks or wear were identified in the specimens used in the test. Figures 15 and 16 show the state of each specimen.
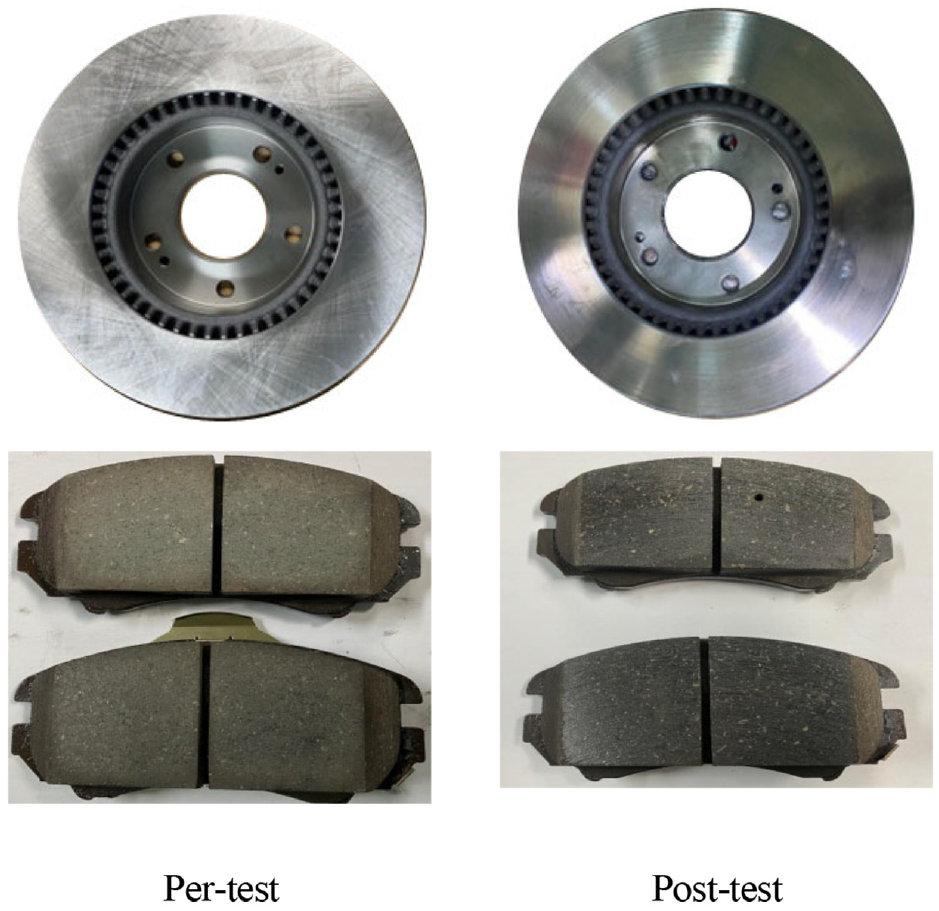
General discs before and after test.
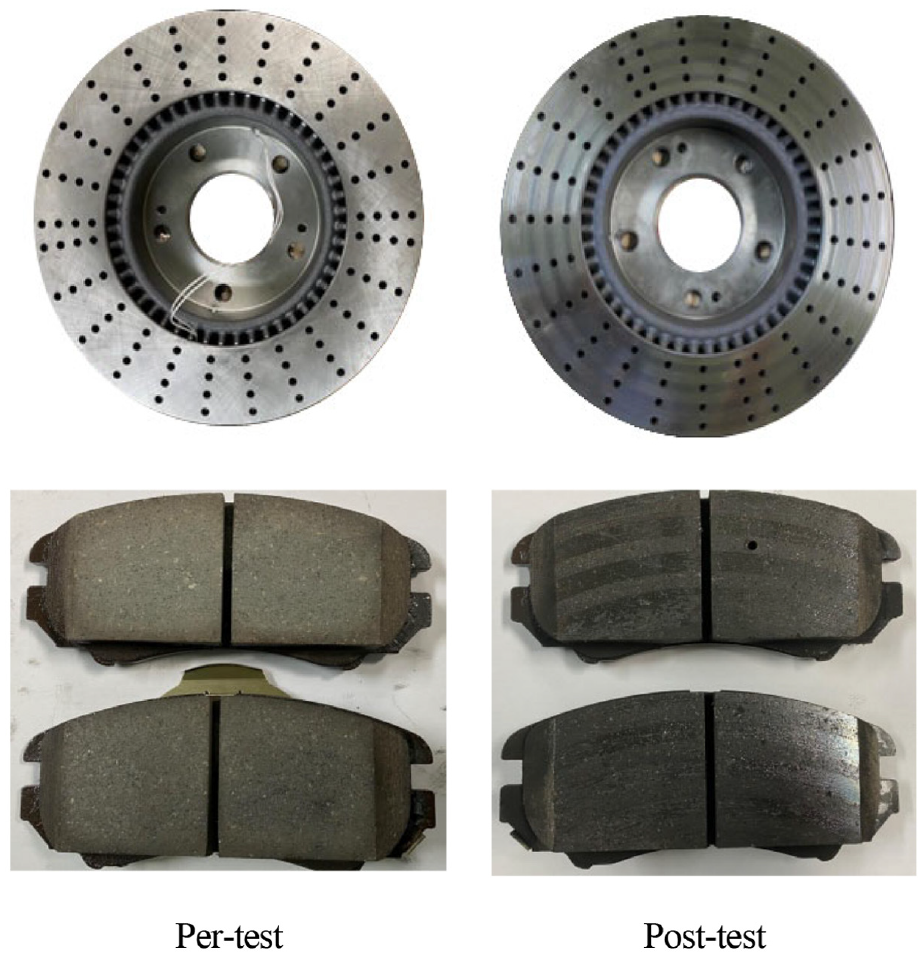
Optimized discs before and after test.
The second test analyzed whether a constant friction coefficient was secured and the tendency according to temperature changes, and the test results are shown in Figure 17. The average friction coefficient was used as the friction coefficient of the two discs, and the error was about 0.027, indicating that there is little difference. It demonstrated that the friction coefficient decreased as more experiments were run. It can be inferred from this that a constant friction coefficient can be preserved.

Fade test result.
The disc surface temperature changes were checked for 120 s after braking. It can be seen that the temperature change of the optimized disc is larger than that of the normal disc. It can be seen that the heat dissipation of the optimized disc increased, the temperature change of the normal disc increased in the initial stage, and then it converged to a certain value. It can be seen that the heat dissipation performance of the optimal disc was improved compared to that of the normal disc. Therefore, it is judged that the more stable the friction coefficient and the greater the temperature change, the better the disc is, and the optimized disc meets these conditions, but the normal discs do not.
Conclusion
Brake disc temperature rises during the braking process and cause various problems such as cracks. If surface holes are made to solve the problem, the surface temperature of the disc will decrease, but the disc will become structurally weak. In order to solve the tradeoff problems, a disc with stable structural performance and improved heat dissipation performance was designed. The following conclusions and effects were identified.
1) Thirty six test points were derived through the design of experiments OA, and an optimal design formulation was established. In addition, structural and thermal analyses were conducted for each test point to carry out a disc analysis.
2) Optimal design was carried out based on the results of numerical analysis, and through HMA and MOGA algorithms, an optimal shape of discs was derived, which had holes, a hole diameter of 5.3 mm, 25 holes, and total length of four holes of 36 mm.
3) Through a braking test using a dynamometer, it was identified that the temperature and stress distribution of the optimized disc were lower than that of the existing disc during braking. In addition, it was identified that the optimized disc had a stable coefficient of friction and a large amount of temperature change.
Based on the results, it was possible to identify the performance of the disc derived in this study and to verify the reliability of the FEA.
Footnotes
Handling Editor: Chenhui Liang
Declaration of conflicting interests
The author(s) declared no potential conflicts of interest with respect to the research, authorship, and/or publication of this article.
Funding
The author(s) disclosed receipt of the following financial support for the research, authorship, and/or publication of this article: This research was supported by the National Research Foundation of Korea (NRF) grant funded by the Korean government (MSIT)(No. 2022R1A2C1005357).