
Abstract
The method of throat aeration was used to improve the performance of the annular jet pump (AJP). In order to study the influence of throat aeration on the performance and flow field of the AJP, the CFD method was used. The results show that at a low flow rate ratio (q) the appropriate aeration rate can narrow or even eliminate the recirculation region. Meanwhile, the efficiency of AJP is improved at a medium-to-high q. Notably, the maximum increase in efficiency is 7.32% at q = 0.7 and the optimal aeration rate should be between 1% and 2%. Since the dynamic viscosity of air is much lower than water, a small amount of air attached to the wall can reduce friction loss. The air flows along the wall after the air aerated into the throat, reducing the shear stress between the high-speed jet and the wall. At a low q, most of the area in the throat is the high efficiency drag reduction region which the drag reduction rate exceeds 80%. Moreover, the high efficiency drag reduction region extends toward the diffuser when the q is high. In addition, throat aeration can optimize the pressure distribution near the wall and axis.
Introduction
The jet pump (JP) is a type of fluid machine that effectively transfers momentum from the primary flow to the entrained flow. Its versatile application in diverse domains like civil engineering, energy engineering, aerospace industry and hydraulic engineering is attributed to its uncomplicated architecture, easy maintenance and safety.
JP is classified into two distinct categories, namely central jet pump (CJP) and annular jet pump (AJP), based on the position of the nozzle and the suction chamber. The CJP has its nozzle situated in the central position, which is surrounded by the suction pipe to form an annular suction chamber. However, AJP has its nozzle position opposite to that of CJP. Due to an unobstructed flow passage, the AJP finds application in transporting mixed fluids with large solid particles.1,2 The AJP has a simplistic architecture, while its energy transfer efficiency is comparably low. Most researches focus on the performance improvement of AJP through geometric optimization. Long et al. 3 conducted a numerical investigation using the realizable k-ε turbulent model to analyze the impact of different throat lengths on the efficiency of AJP. It was found that the efficiency of the AJP was the highest when the throat length was 2.69 times the throat diameter. In another study, Xiao and Long 4 analyzed the effect of the angle of the suction chamber on the recirculation region of the AJP. Their results indicate that when the suction chamber angle ranges from 18°to 25°, the recirculation region is relatively small. However, with a suction chamber angle of 30°, there is an increase in the range of the recirculation region. In the study conducted by Lyu et al., 5 they used the DOE and CFD to optimize the structure of AJP. The findings indicate that the reciprocal interaction between two factors is more suitable for enhancing the performance of the AJP compared to considering only a single factor. Additionally, the optimal structural parameters were provided for different area ratios. Wang et al. 6 converted the traditional conical suction chamber into a streamlined suction chamber to improve the performance of AJP. They found that the efficiency was increased by 1.4% under a low q. Furthermore, the local low-pressure at the throat inlet was eliminated.
The cavitation phenomenon also occurs in JPs. Under critical working conditions, a large number of cavitation bubbles are generated in the throat and diffuser, blocking the flow passage. Simultaneously, the suction flow rate no longer rises as the outlet pressure lowers and the critical flow rate ratio is attained at this moment. Same as the other hydraulic machines, the aeration in the JP can improve its cavitation performance. Experimental studies by Long et al. 7 demonstrated that supplementing air in the CJP effectively absorbed the impact force and radiation in reduced cavitation vibration, noise, and optimized pressure distribution in the throat. Lu et al. 8 proposed a new method of inhaling air into the local low-pressure region of the CJP, which formed a water-air cushion layer on the wall boundary, leading to a significant decrease in noise and improving its performance. However, most studies applied asymmetric unilateral aeration, which interferes with the axial flow of the jet and causes an asymmetric flow field. To maintain the axisymmetric flow field of JP, Chen et al. 9 introduced a method of symmetrical uniform self-aeration at the throat, which improves JP’s cavitation performance. Li et al. 10 conducted experimental investigations on symmetrical aeration at CJP’s throat and confirmed that an appropriate aeration rate could improve its cavitation performance under critical working conditions. Most of the previous work has focused on throat aeration in CJP, with few reports of throat aeration in AJP.
In addition, studies have shown that the throat aeration of the JP not only improves its cavitation performance under critical working conditions but also enhances its efficiency when working under normal conditions7,8,10 The reason why is that the air has lower dynamic viscosity than water, and when aerated to the inner wall of the throat, it effectively reduces the frictional resistance of water. Aerated drag reduction has a broad application in various fields. Zhao and Zong 11 conducted experiments and numerical simulations to study the aeration drag reduction of ship models and found that smaller bubbles and larger air coverage areas are more effective in reducing drag. Zheng et al. 12 theoretically analyzed the velocity distribution and resistance law of gas-liquid stratified laminar flow in circular tubes. The results showed a theoretical drag reduction rate as high as 68.2% with even small air content in the near-wall layer, under the same water flow rate. However, the effect of aeration on drag reduction in AJP is rarely reported. During the operation of the AJP, the high-speed primary flow is close to the wall, and there is a local low pressure near the inlet of the throat. Simultaneously, the front section of the throat may be in a vacuum state, which creates convenient conditions for self-aeration. The air attaches to the wall, and the drag reduction effect should be significant. However, the impact of throat aeration on the energy transfer efficiency, flow field, and cavitation performance under different flow rate ratios in AJP is unclear.
At present, numerical simulation is the predominant method for investigating the internal flow field of JP. After throat aeration, the internal flow of the JP becomes gas-liquid flow, which involves numerical simulation of the two-phase flow of water and gas. Sharma et al. 13 numerically investigated the impact of different turbulence models on the liquid-gas jet pump (LGJP) and optimized the structural dimensions of the LGJP. Zhu et al. 14 employed k-ε turbulence model and VOF method to simulate the internal flow of the LGJP. Wang et al. 15 conducted numerical investigations into the mixing behavior between gas and water in a gas-liquid ejector. They identified three distinct phases of mixing: co-axial flow, mixing shock flow, and bubble flow. Notably, their results indicate that the mixing shock is the key factor affecting the ejector’s performance. In studies conducted by Gao et al., 16 numerical studies were performed for LGJPs with different suction chamber angles. The results showed that the efficiency of the LGJP changes with the angle similarly to the pressure ratio, reaching a maximum value at a certain angle. However, there are less relevant examples of the liquid jet pump after throat aeration.
This study mainly focuses on the performance and flow field of AJP after throat aeration. Based on the Realizable k-ε turbulent model and VOF method, the flow in AJPs under different flow rate ratio conditions after throat aeration is studied. By comparing the differences in pump efficiency, flow field, wall shear stress and pressure distribution, the optimal aeration rate can be selected.
Mathematical formulations and numerical methods
Numerical model
The VOF method can simulate two or more immiscible fluids by solving a single momentum equation and tracking the volume fraction of each fluid in the entire region. Governing equations are as follows.
Continuity equation:


where ρ is density, α is the volume fraction, υ is velocity. Subscript l and g stand for liquid and air respectively.
Momentum equation:


where μ is viscosity, F is body force.
Water transport equation:

The Realizable k-ε model is used in this study. This model based on the constraints from rapid distortion theory can well predict the internal flow of AJP under high Reynolds number.17,18
The structure and performance parameter of AJP
The structure of AJP is shown in Figure 1. The area ratio m is the ratio of the cross-sectional area of the throat to the annular nozzle and m = 2.22 in this study. The geometry parameters include out pipe diameter (Dd = 60 mm), throat diameter (Dt = 40 mm), suction pipe diameter (Ds = 44 mm), suction chamber angle (α = 20°), throat mouth distance (Lc = 43 mm), throat length (Lt = 100 mm), and diffuser angle (β = 6°). Based on the structural characteristics of AJP, the length Xa which is from the throat inlet to the central axis of the air inlet is set as 0.2 times Dt, and the air inlet width Wa is set as 2 mm.

Annular jet pump and aeration structure.
The performance parameter of AJP is flow rate ratio (q), pressure ratio (h), and pump efficiency (η), as follows:


where Qs and Qj represents flow rate of the inlet of the entrained flow and the inlet of the primary flow, respectively. Hc, Hs, and Hj represents the total water head of the mixed flow, the entrained flow and the primary flow.
The dimensionless parameter aeration rate C is introduced to represent the relative content of the air.

where
Mesh and boundary conditions
The internal flow of the AJP can be categorized as axisymmetric flow in a limited space and can be adequately represented using a two-dimensional axisymmetric model, as has been demonstrated in numerous studies.19,20 For throat aeration, the air enters the throat all around through the air inlet, and the airflow can also be considered axisymmetric. Therefore, it is reasonable to use a two-dimensional axisymmetric model in this study. As shown in Figure 2(a), the computational domain includes the suction pipe, annular nozzle, suction chamber, air inlet, throat, diffuser, and outlet pipe. The origin of the coordinate axis is set at the center of the throat inlet section, with the positive x-direction aligned to the flow direction and r representing the radial direction. To ensure that the flow has fully developed, the length of the suction pipe and the outlet pipe should be extended.21,22 In this paper, the length of the suction pipe and the outlet pipe is extended by 5Ds and 5Dd, respectively.

Computational domain and the local mesh: (a) computational domain, (b) throat inlet and air inlet, and (c) diffuser inlet.
Since the air inlet is the intersection of gas and liquid, the mesh was refined in these areas, as shown in Figure 2(b) and (c).
The primary flow inlet was set as the velocity inlet and the velocity was kept at 14 m/s at different working conditions. The entrained flow inlet was set as the pressure inlet with the relative pressure was set Ps = 0 kPa (operating pressure was 101.325 kPa). The mixed flow outlet was set as the pressure outlet with the relative pressure range was 15–75 kPa; The air inlet was set as velocity inlet and the velocity was based on the aeration rate. The wall was no-slip and the axis was axisymmetric. The Scalable wall function was used to ensure the correct calculation of the turbulence characteristics and the calculation results of any fine grid will not be deteriorated.23,24 By adjusting the outlet pressure of the mixed flow with a fixed intake velocity of the primary flow, different flow rate ratios can be achieved. For the same flow rate ratios, different aeration rates could be obtained by changing the inlet velocity of the air.
The commercial CFD code Ansys-Fluent 2020 R2 was used for all simulations. To cope with the coupling of the velocity and pressure fields, the PISO algorithm was applied. The momentum and turbulence kinetic equations were discretized using the second-order upwind approach. Furthermore, the PRESTO! and Compressive schemes were employed for the pressure and transport equations of air mass fraction, respectively. The time step was set as 10−5 s. When all residuals were less than 1.0 × 10⁻⁵, the calculation was judged to be converged.
Mesh independence validation
The accuracy of the CFD model used in this study has been verified by previous study. 25 To establish a balance between computation accuracy and calculation cost, three meshes of coarse, medium, and fine are constructed in the same geometric structure with a constant refinement ratio. Figure 3 depicts the change in pressure ratio with flow ratio at three different resolutions. Because the pressure ratio of the coarse grid is much lower than that of the other two grids, and the pressure ratio of the medium grid and the fine grid is not significantly different, the medium grid is chosen for further computation.

Comparison of pressure ratio under different meshes.
Analysis of numerical results
Performance curve
Figure 4 shows the performance curve of AJP. As shown in Figure 4, the q increase with the outlet pressure decreases. However, once the outlet pressure reaches a certain critical value, the flow rate ratio of the AJP will no longer increase. This working condition is called the critical working condition of AJP. At this moment, the flow rate ratio is 0.76 which is defined as the critical flow rate ratio.

Performance curve of AJP (without throat aeration).
Figure 5(a) and (b) present a comparison of h and η of the AJP at varying levels of aeration rate C. As shown in Figure 5(a), without throat aeration, the h ranges from 0.303 to 0.523. When C = 1% ∼ 2%, q < 0.76, the h at the same flow rate ratio is higher than that without aeration. In addition, when C = 1%, q = 0.7, the improvement value of h reaches its maximum, increasing from 0.323 to 0.367. Moreover, there is no sharp decrease in h under the critical working condition. Under C = 3%, when q ≤ 0.5, the h is slightly higher than that without aeration, while when q > 0.5, the h is lower. For C = 5%, the h is significantly lower than that without aeration. As shown in Figure 5(b), the efficiency improvement under high flow rate ratio conditions is considerably more significant than that under low flow rate ratio conditions. When q = 0.7 and C = 1%, the efficiency improvement of the AJP reaches a maximum value of 7.32%. Nevertheless, when C > 3%, the efficiency of the AJP is reduced due to the separation of some air from the wall surface, which interferes with the jet flow field and increases the energy loss.

The comparison of pressure ratio and pump efficiency at various aeration rate: (a) h − q and (b) η − q.
The results demonstrate that an appropriate amount of aeration in the throat can enhance the efficiency of the AJP, and the optimal aeration rate is C = 1%–2%.
Flow field
Under low flow rate ratio conditions, the primary flow and entrained flow experience violent mixing, leading to the generation of a recirculation region in the vicinity of the inlet of the AJP’s throat. This region can significantly decrease the AJP’s efficiency. Figure 6 depicts the recirculation region in the AJP at the low flow rate ratios. As shown in Figure 6(a1), at q = 0.2, the recirculation region without aeration covers x/Dt = −0.43 to 0.61. However, after throat aeration, the recirculation region is reduced to x/Dt = −0.43 to 0.46. As shown in Figure 6(b), at q = 0.3, the recirculation region disappears after throat aeration. All in all, under a low q, throat aeration can narrow or even eliminate the recirculation region in AJP.

Comparison of recirculation region at the low flow rate ratios (a) q = 0.2 and (b) q = 0.3.
The attenuation degree of the primary flow speed is reflected by the length of the primary flow potential core. The longer the length of the primary flow potential core, the slower the attenuation of the primary flow speed. The primary flow potential core length lp is defined as the length from the annular nozzle exit to the endpoint, where the value of the speed changes into the value at the annular nozzle exit again. 22
Figures 7 and 8 show a comparison of the length of the primary flow potential core at different q. As shown in Figure 7, when q = 0.3, the primary flow potential core without aeration reaches x/Dt = 0.596. However, under C = 1%, the primary flow potential core extends to x/Dt = 0.686. With a further increase in aeration rate to 2%, the primary flow potential core reaches x/Dt = 0.767. Similarly, as shown in Figure 8, when q = 0.6, the primary flow potential core without aeration reaches x/Dt = 1.273. With C = 1%, the primary flow potential core becomes longer, reaching x/Dt = 1.411. When the aeration rate is increased to 2%, the primary flow potential core extends even further to x/Dt = 1.537. It can be concluded that the primary flow potential core becomes longer after the throat aeration and a higher aeration rate results in a greater increase in primary flow potential core length. The lengthening of the primary flow potential core suggests a decrease in jet wall resistance, resulting in a slower attenuation of the jet speed.

The length of primary flow potential core at different aeration rate (q = 0.3).
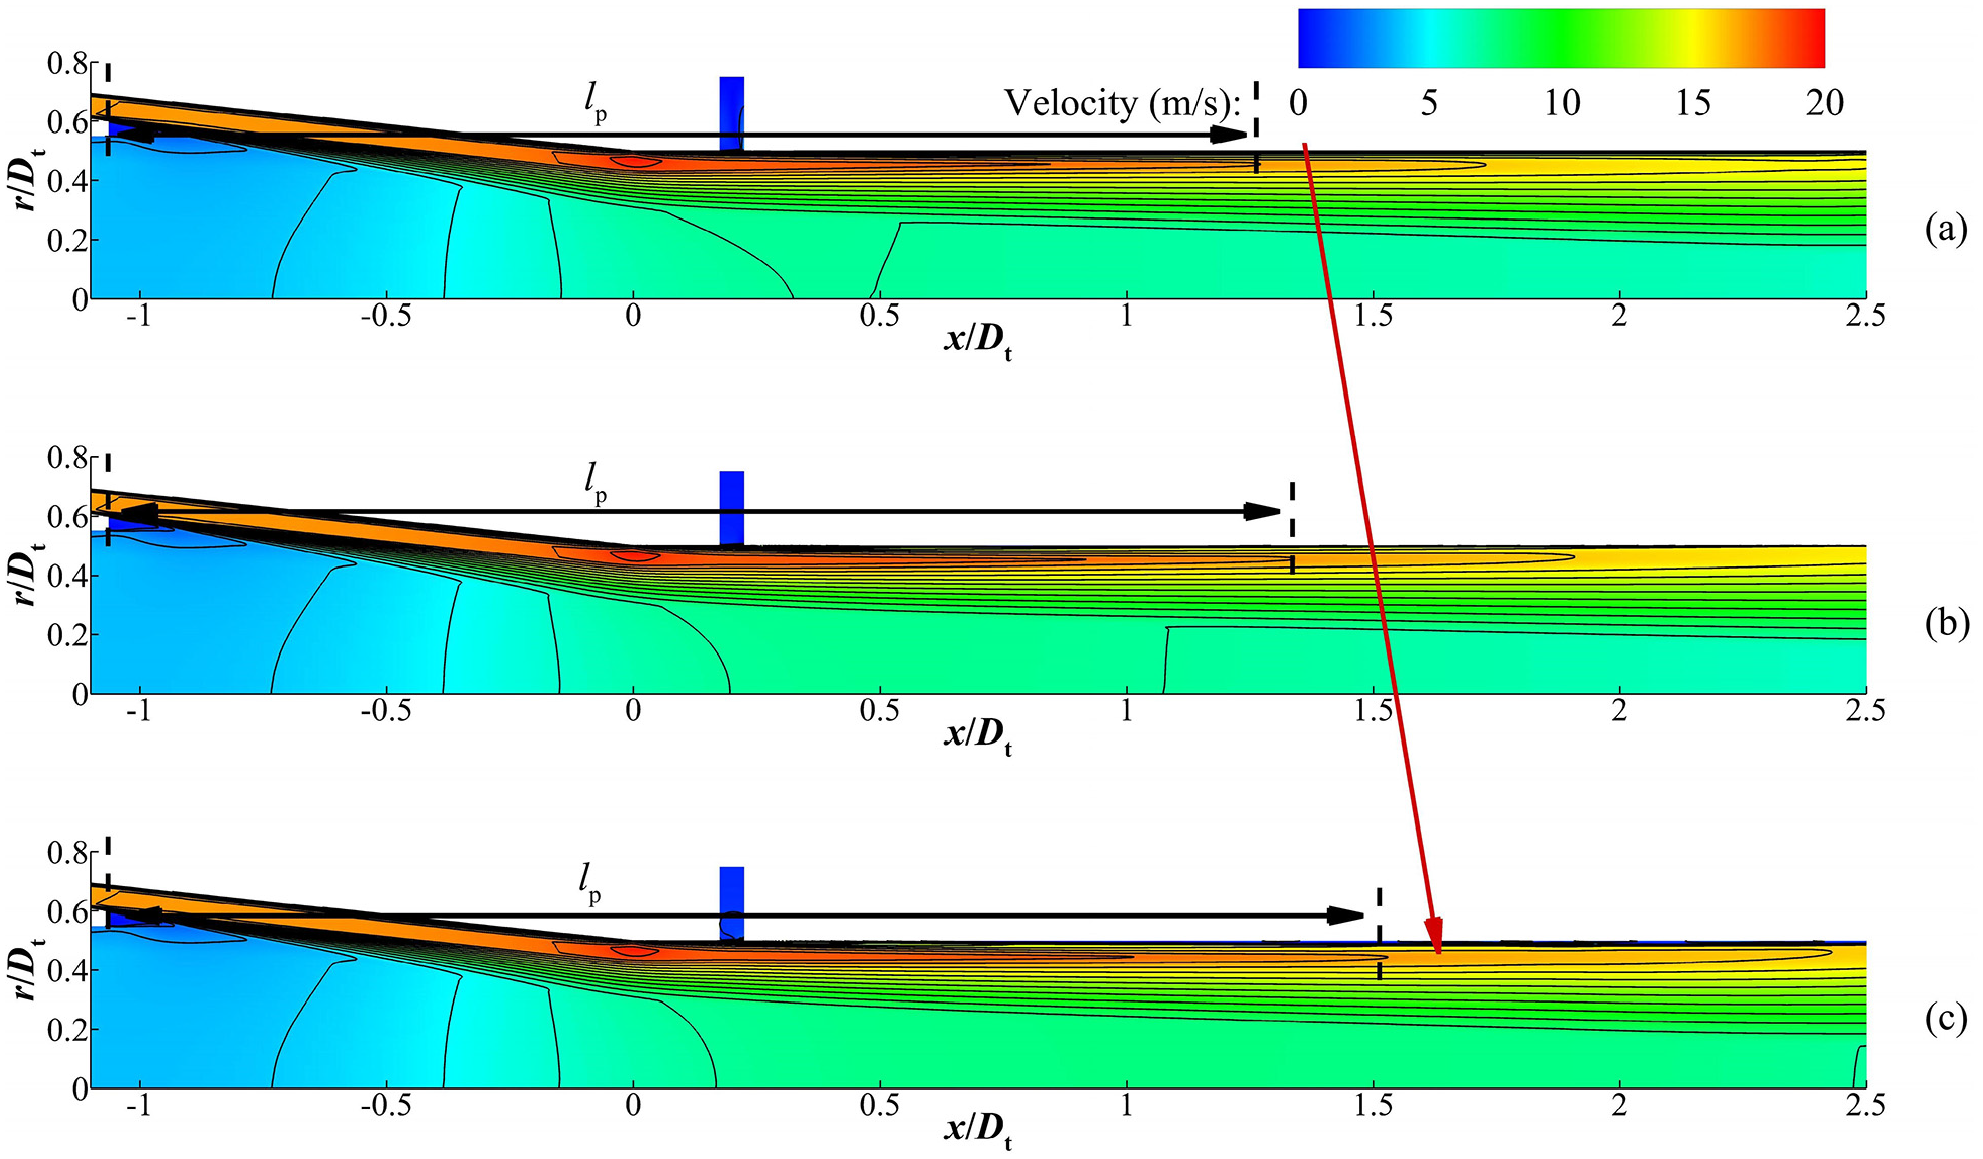
The length of primary flow potential core at different aeration rate (q = 0.6).
Figure 9 compare the velocity vectors and air phase distributions after aeration. In Figure 9(a) and (b), the water-air cushion layer forms at the wall of the jet pump after throat aeration,which is similar to other’s previous research. 8 And the black box indicates that the velocity magnitude near the throat wall decrease after aeration. These phenomena show that a reduction in frictional loss at the wall.

Comparison of velocity vector and air phase distribution after aeration (q = 0.7): (a) C = 0% and (b) C = 2%.
Wall shear stress
One of the main sources of energy loss of AJP at the throat and diffusion is the friction loss of the wall. The wall shear stress is an important indicator of the level of wall friction loss. After throat aeration, it formed a “film” on the wall surface, resulting in drag reduction and improved efficiency of AJP. Figure 10 illustrates the time-averaged wall shear stress distribution after aeration at different q. At C = 0%, the wall shear stress at the throat is high and that at the diffuser shows a downward trend along the flow direction.
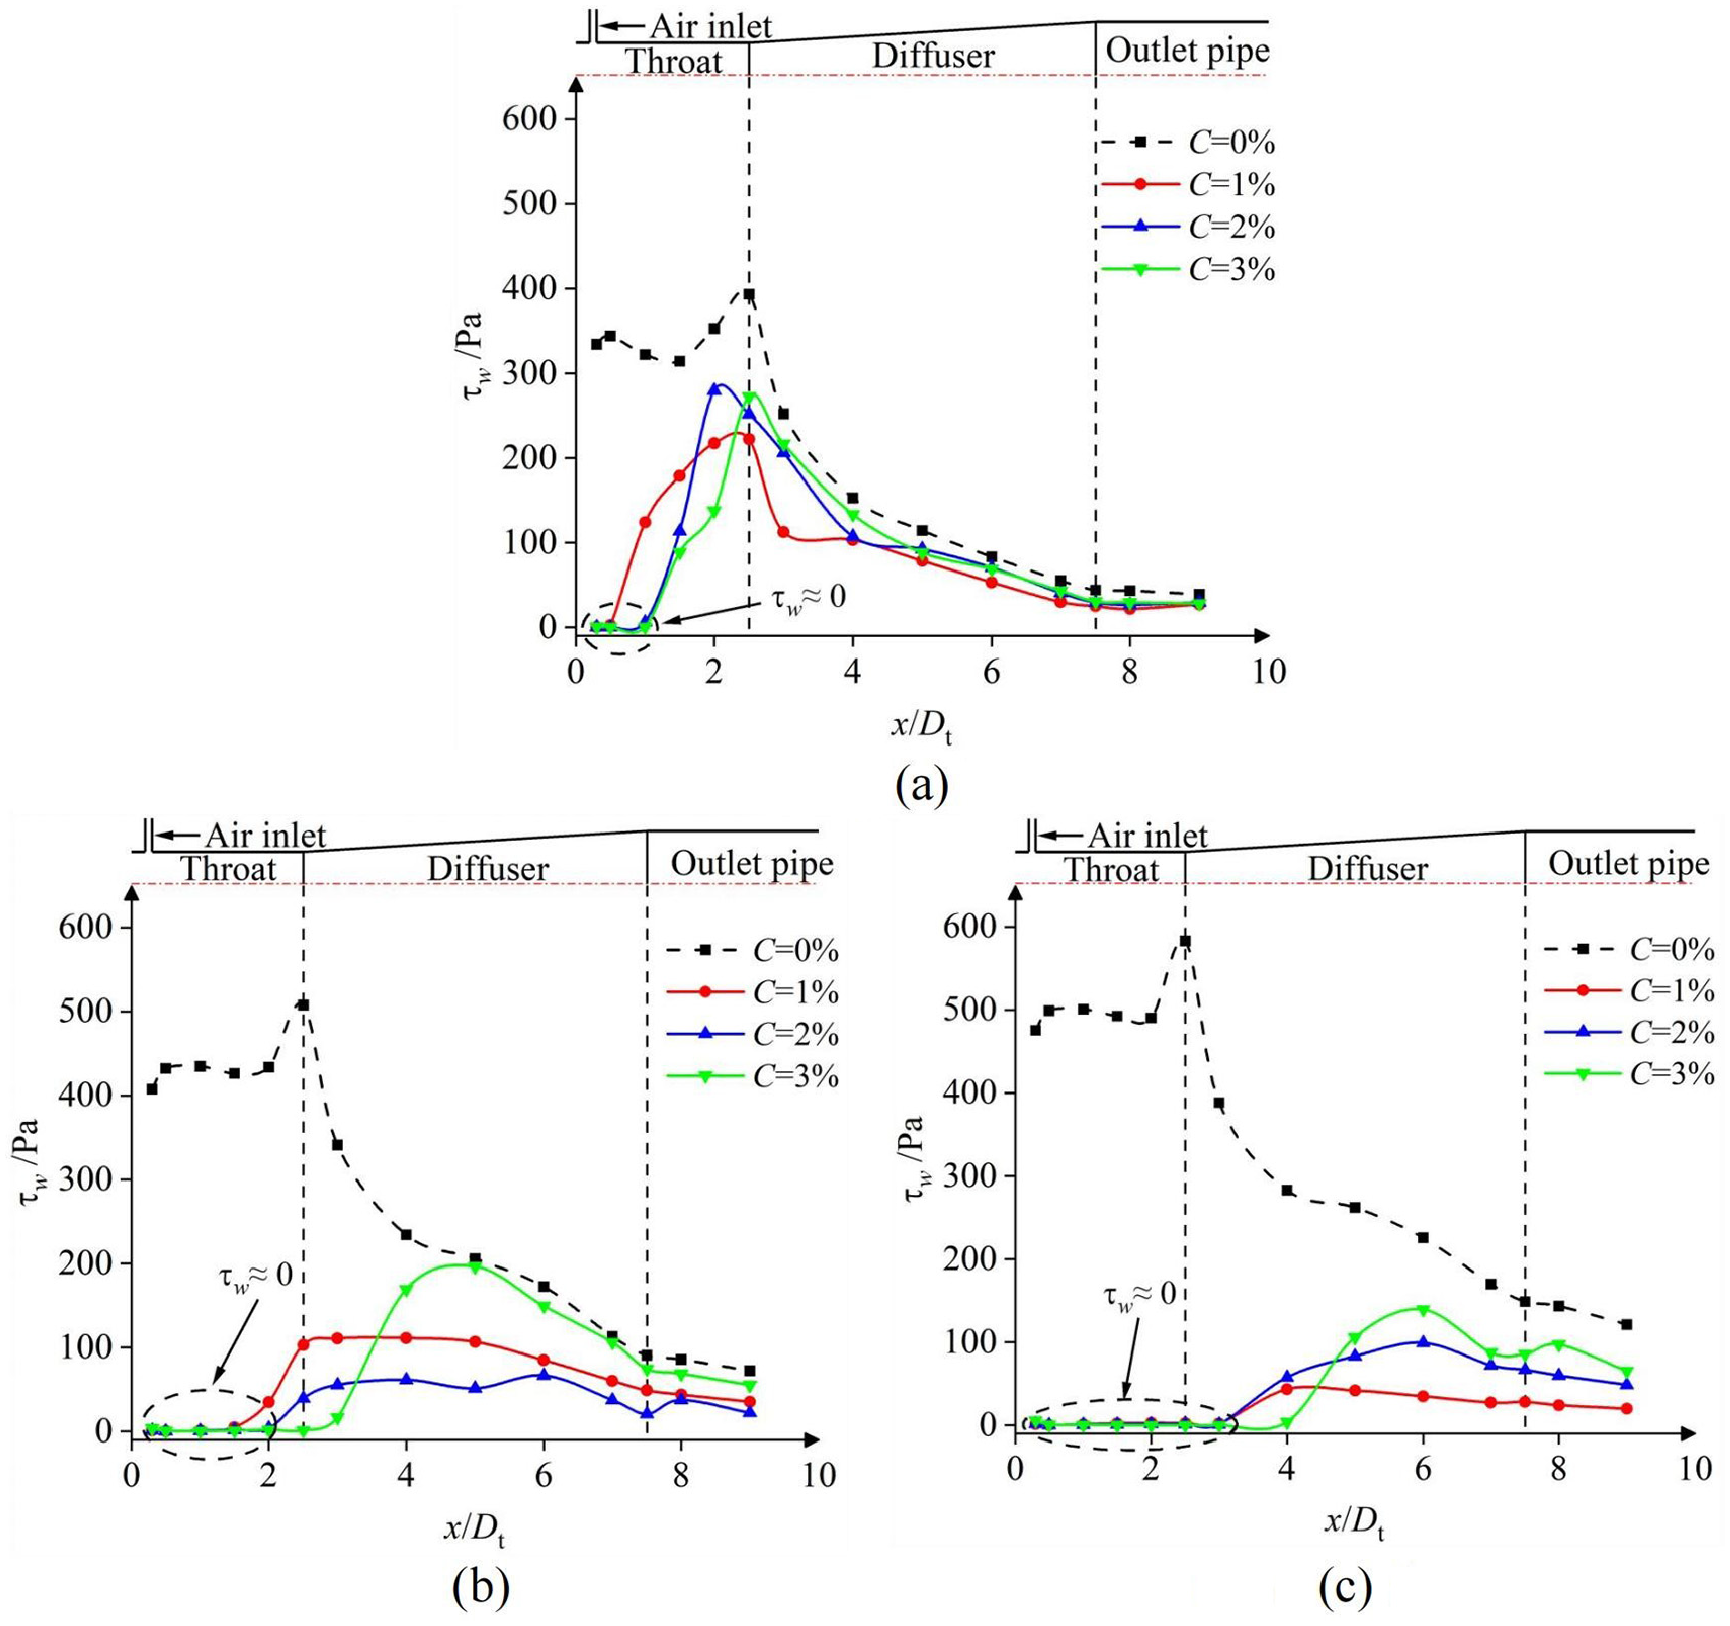
Time-averaged wall shear stress distribution under different flow rate ratios: (a) q = 0.2, (b) q = 0.5, and (c) q = 0.76.
As shown in Figure 10(a), at a low q (0.2), the wall shear stress at the throat does not decrease significantly when C = 1%. As the aeration rate is increased, the region in which the wall shear stress at the throat approaches zero expands. Under this condition, there are only sparse bubbles at the wall surface when the aeration rate is low, resulting in a weak effect on reducing wall shear stress. Nevertheless, as the aeration rate heightened, the airflow rate ratio in the throat also increases, leading to the formation of a stable air layer near the wall surface, thus enhancing the effect of reducing the wall shear stress.
As shown in Figure 10(b), at a medium q (0.5), the wall shear stress at the throat decreases obviously after aeration. However, when the aeration rate is low, the region in which the wall shear stress approaches zero still does not cover the entire section of the throat. Meanwhile, at the diffuser, the wall shear stress decreases at C = 1%, while it is still larger than that of C = 2%. Further increasing the aeration rate leads to a large region where the wall shear stress nears zero at the throat, while the wall shear stress at the diffuser grows larger.
As depicted in Figure 10(c), at a critical q (0.76), the wall shear stress at the throat is essentially nil after aeration. At the diffuser, as the C increases to 1%, the wall shear stress decreases. Furthermore, when the C goes up to 2%, the wall shear stress is slightly greater than that at 1%. As the aeration rate continues to increase, the region where the wall shear stress in the throat and diffuser inlet approaches zero expands. However, the wall shear stress at downstream of the diffuser increases. It can be illustrated that under critical working conditions, the flow velocity magnitude at the throat is exceedingly high, which leads to an extended primary flow potential core. As a result, the air can establish a stable air layer on the throat wall, thereby achieving drag reduction. However, at the entry of the diffuser, abrupt structural changes cause the air to separate from the wall due to inertial forces, producing an irregular air layer on the diffuser wall surface. The higher the aeration rate, the more uneven this air layer becomes. When C = 3%, the flow at the diffuser wall becomes disordered, creating a local high velocity gradient region. Consequently, wall shear stress increases.
In order to study the regions of high-efficiency drag reduction more clearly, the concept of drag reduction rate is introduced, which is defined as 26 :

where τw is the wall shear stress of AJP with aeration, τwo is the wall shear stress of AJP without aeration.
Table 1 shows the drag reduction rate at different positions for different flow rate ratios after aeration. According to the research of Elbing et al., 27 the regions where the drag reduction rate exceeds 80% are defined as high-efficiency drag reduction regions.
Drag reduction rate at different positions for different flow rate ratios after aeration.


From the yellow zone in Table 1, it is evident that when C = 1%, and the flow rate ratio is low (q = 0.2), the high-efficiency drag reduction region is small, distributed near the air inlet. As the flow rate ratio increases to a medium value (q = 0.5), the high-efficiency drag reduction region becomes more uniform, concentrated in the air inlet and the downstream of throat, covering a larger area. At the critical flow rate ratio (q = 0.76), the high-efficiency drag reduction region shows maximum coverage, encompassing not only the whole throat section but almost the entire diffuser. When C = 2% ∼ 3%, the high-efficiency drag reduction region with a low flow rate ratio (q = 0.2) is uniformly distributed, primarily at a range of one time Dt behind the air inlet. Under the medium flow rate ratio (q = 0.5) and critical flow rate ratio (q = 0.76), the range of the high-efficiency drag reduction region is expanded, mainly in the whole throat section and the front of the diffuser. Compared with the blue zone in Table 1, when q ≥ 0.5, the drag reduction rate in the middle and rear sections of the diffuser with C = 3% is lower than that of C = 2%, which indicates that when aeration rate is high, the air in the middle and rear sections of the diffuser is disordered, and the high-efficiency drag reduction region cannot be formed.
Pressure distribution
Figure 11 displays the pressure distribution in the AJP after throat aeration. When the flow rate ratio is low (q = 0.3), aeration causes changes in the pressure distribution of the AJP’s throat and diffuser. At x/Dt = 1.0, close to the throat inlet, the pressure near the wall of the AJP slightly decreases, while the pressure at downstream of the throat increases (cf. Figure 11(a) black box). As the flow rate ratio increases, particularly at q = 0.6, the pressure in the diffuser rises after aeration, as shown in Figure 11(b) (black box).

Contours of pressure in the AJP after throat aeration: (a) q = 0.3 and (b) q = 0.6.
Figure 12 illustrates the distribution of the wall pressure coefficient at various aeration rate. The pressure coefficient is defined as follows:

where p is the static pressure, p0 is the reference pressure. vj is the average flow velocity at the nozzle exit.

The pressure coefficient along the inner wall under different flow rate ratios: (a) q = 0.2, (b) q = 0.5, and (c) q = 0.76.
As shown in Figure 12(a), it can be observed that at a small flow rate ratio (q = 0.2), when C = 1%, there is a slight reduction in wall pressure at the throat compared to the non-aerated condition. Moreover, the Cp curve at the junction of the throat and the diffuser shows a gentle slope, without any abrupt drops in pressure. In addition, there is an increase in wall pressure at the diffuser and outlet pipe. When C = 2%, the wall pressure at the diffuser becomes higher than that of the non-aerated condition. Finally, when the aeration rate reaches 3%, the pressure at the diffuser decreases in comparison to the non-aerated condition (as indicated by the red box in Figure 12(a)).
Figure 12(b) shows that at a medium flow rate ratio (q = 0.5), as the aeration rate increases, the region where the wall pressure at the throat remains constant extends downstream of the throat. In addition, the wall pressure at the diffuser is higher than that of the non-aerated condition. When C = 2%, the wall pressure of the diffuser increases more compared to other aeration rates.
As shown in Figure 12(c), under the critical flow rate ratio (q = 0.76), when C = 1%, the local low pressure region at the outlet of the throat is eliminated, and there is an increase in wall pressure at the diffuser. When C = 2%, the throat experiences a decrease in wall pressure, while the diffuser sees a slight increase, which is lower than that of C = 1%. When C = 3%, the region where the wall pressure at the throat remains constant extends to the diffuser, resulting in a significant reduction in wall pressure at the diffuser.
The analysis shows that the air is separated from the wall at the junction of the throat and the diffuser due to the folding of the tube wall. As a result, a uniform and stable air layer is not formed near the inlet of the diffuser, leading to wall pressure fluctuation within this range. Subsequently, the air and water blend together, and the wall pressure gradually stabilizes after passing through the diffuser.
Figure 13 shows the distribution of the axial pressure coefficient at different aeration rate. When the flow rate ratio is low (q = 0.2), the Cp of the throat decreases with an increase in aeration rate, while the Cp of the diffuser initially increases and then decreases. The highest Cp of the diffuser is obtained at C = 2%, as demonstrated by the red box in Figure 13(a). Under the condition of a medium flow rate ratio (q = 0.5), the Cp increases almost throughout the AJP when C = 1%. When C = 2%–3%, the Cp of the throat decreases, while the Cp of the diffuser increases. At the critical flow rate ratio (q = 0.76), the Cp in the diffuser slightly increases at C = 1%. However, at C = 2%, the Cp decreases in the entire section of the throat and the upstream of the diffuser, while the downstream of the diffuser and the outlet observe increases. At C = 3%, the Cp sharply decreases throughout the entire AJP section.

The pressure coefficient along the axis under different flow rate ratios: (a) q = 0.2, (b) q = 0.5, and (c) q = 0.76.
Conclusion
In AJP, inner wall friction loss is high because the high-speed primary flow normally travels along the suction chamber and throat’s inner wall. Aeration has a drag reduction effect, so the method of throat aeration is proposed to reduce friction losses and improve the efficiency of AJP. The research findings can be applied across the AJP of various fields such as chemical engineering, hydraulics an so on. In this study, the numerical simulation of throat aeration in an AJP was carried out by using the Realizable k-ε model combined with the VOF model. The results are as follows:
(1) The appropriate aeration rate can improve the energy transfer efficiency of the AJP, with the optimal aeration rate falling between 1% and 2%. The high flow rate ratio condition experiences greater efficiency and pressure ratio improvement under the optimal aeration rate. When q = 0.7 and C = 1%, the h increases the most, from 0.323 to 0.367 and the maximum efficiency improvement value is 7.32%.
(2) At the low flow rate ratio, throat aeration can narrow or even eliminate the recirculation region. Meanwhile, it can optimize the jet flow field of the AJP and increase the entrainment of primary flow on the entrained flow.
(3) The wall resistance to the jet is reduced after throat aeration, reducing the rate of jet attenuation so that the length of the primary flow potential core is increased. Under the condition of q = 0.3, the length of the primary flow potential core is increased from x/Dt = 0.596 to 0.767. Meanwhile, under q = 0.6, the length of the primary flow potential core is increased from x/Dt = 1.273 to 1.537. As the flow rate ratio increases, the increase in the length of the primary core is high.
(4) After throat aeration in AJP, there are differences in the high-efficiency drag reduction region which has a drag reduction rate of over 80%. When the flow rate ratio is low, some parts of the throat are in the high-efficiency drag reduction region. Under a high flow rate ratio, the high-efficiency drag reduction region further extends toward the diffuser.
(5) When the flow rate ratio is less than the critical flow rate ratio, with the increase of the aeration rate, the wall pressure of the diffuser shows a trend of increasing first and then decreasing. At the critical flow rate ratio, throat aeration can improve the pressure distribution near the wall and axis, reduce cavitation, and increase the pressure ratio. Meanwhile, there is no sharp decrease in the pressure ratio.
Footnotes
Handling Editor: Sharmili Pandian
Declaration of conflicting interests
The author(s) declared no potential conflicts of interest with respect to the research, authorship, and/or publication of this article.
Funding
The author(s) disclosed receipt of the following financial support for the research, authorship, and/or publication of this article: This research was supported by the National Natural Science Foundation of China [grant number 51879179].