
Abstract
The desalination of salty water has become a necessary industrial process to overcome the next global shortage in freshwater. In this study, adding a Reheat Solar Collector Cycle (RSCC) to a multi-stage flash plant is used to increase the optimization of the desalination process, improving efficiencies, reducing energy, and increasing the production of freshwater demands to overcome the global crisis of shortage in freshwater. Two projects employ this numerical technique. The first project is conducted in the Al-Khafji multi-stage flash plant in Saudi Arabia with an input mass flow rate of 1 Mkg/h (277.78 kg/s), TDS of 35,000 ppm, and wind velocity of 1 m/s. The second project is conducted in the Gulf of Aqaba in Jordan with an input mass flow rate of 1 Mkg/h (277.78 kg/s), TDS of 40,000 ppm, and wind velocity of 1 m/s. The module of the LS-2 Parabolic Trough Collector (PTC) is used to gain the required energy to heat seawater. The results show that in the Al-Khafji project, an increase of 7.1% in the plant capacity per day and an increase in efficiency from 7.8 to 8.4 were observed. While, in the Gulf of Aqaba, an increase of 7.7% in the plant capacity per day and an increase in efficiency from 7.8 to 8.4 are observed.
Introduction
Globally, there is a water crisis due to the increasing demand for water, the reduction of water resources, and the increasing pollution of water. Jordan is considered the second poorest country in the world in terms of water resources, with less than 100 m3 per capita which is much less than the global per capita, share of 500 m3. 1 So, the major environmental challenge facing Jordan is water scarcity. A high rate of natural population growth accompanied by the massive growth in refugee flows to an imbalance between population and water. Water resources are limited to support the population sustainably. To make the situation worse, Jordan shares most of its surface water resources with its neighboring countries, as shown in Figure 1. Table 1 shows Jordan’s needs for water annually according to the Water Authority of Jordan (WAJ).2,3 Jordan faces a serious water crisis because the percentage of freshwater is low. Desalination of water is gradually emerging as a viable option for supplying drinking water in many nations throughout the world. 4 One of the most modern and environmentally friendly alternatives to freshwater resources is the desalination of saltwater. 5 The desalination of seawater is reserved to reduce this risk because seawater is the largest source of water. Where seawater desalination technology is applied to provide fresh water for drinking, industrial, agricultural, and other sectors. Seawater desalination is not modern technology, but it is one of the oldest techniques used to make water drinkable. As the population increases and agricultural and industrial activities increase, the demand for freshwater increases. For instance, Figure 2 shows the relationship between the increase in demand for freshwater over time in the world and the Gulf Cooperation Council (GCC) countries, and Figure 3 exhibits the energy consumption in desalination plants.6,9
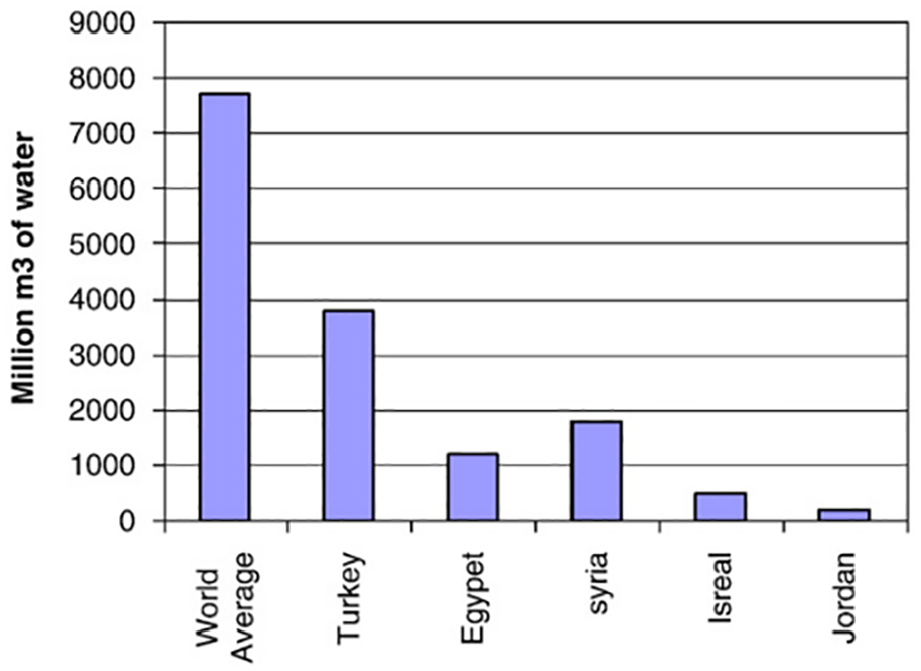
The water annual share for Jordan and its neighbors. 2
The water demand in Jordan per annum (Mm3). 2


Global and GCC desalination plants production (Million m3/day). 6

Energy consumption in desalination plants (GWh). 6
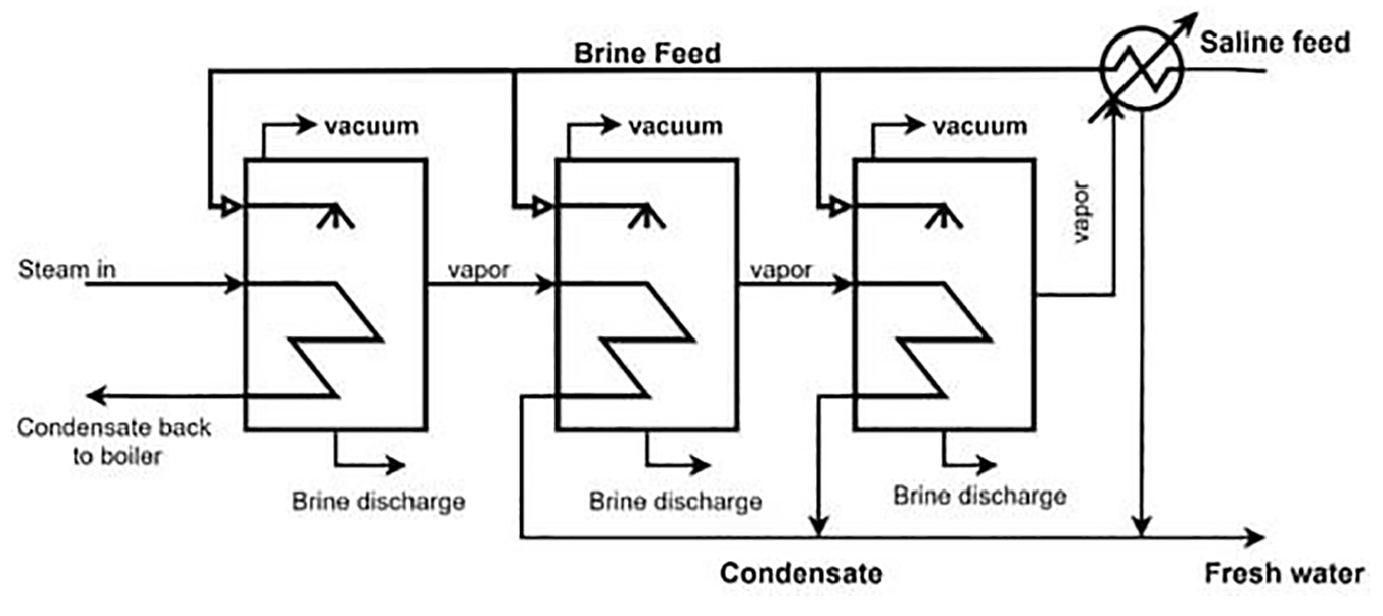
There are two main technologies used in seawater desalination: thermal desalination (distillation) and membrane desalination. 7 Salts and other non-volatile materials are left behind when the feed water is heated in the thermal process to a specified operating pressure and temperature at which the vapor condenses as pure water. Compared to membrane processes, this one uses more heat and mechanical energy to function. As a result, the heat is recycled during the operation’s phases using evaporation and condensation. This technique makes use of the following technologies: multi-effect distillation (MED), thermal vapor compression (TVC), multi-stage flash distillation (MSF), and mechanical vapor compression (MVC). Figure 4 shows the theoretical operation of the MED and MSF techniques. On the other hand, the membrane process is the non-phase-changed procedure where the water remains in the liquid phase, and separates from the feed water via the membranes. Technologies included are nanofiltration (NF), microfiltration (MF), membrane bioreactors (MBs), ultrafiltration (UF), membrane distillation (MD), forward osmosis (FO), electrodialysis (ED), and reverse osmosis (RO). The major advantage is that a large amount of pure water is recovered, seawater is used, and not just salt but other dangerous elements are filtered out. Fouling, membrane scaling, and the need for external pressure application are the drawbacks nevertheless. Figure 5 illustrates how RO functions theoretically. Details of both technologies are shown in Do Thi et al. 8
Schematic diagram of MED. 8
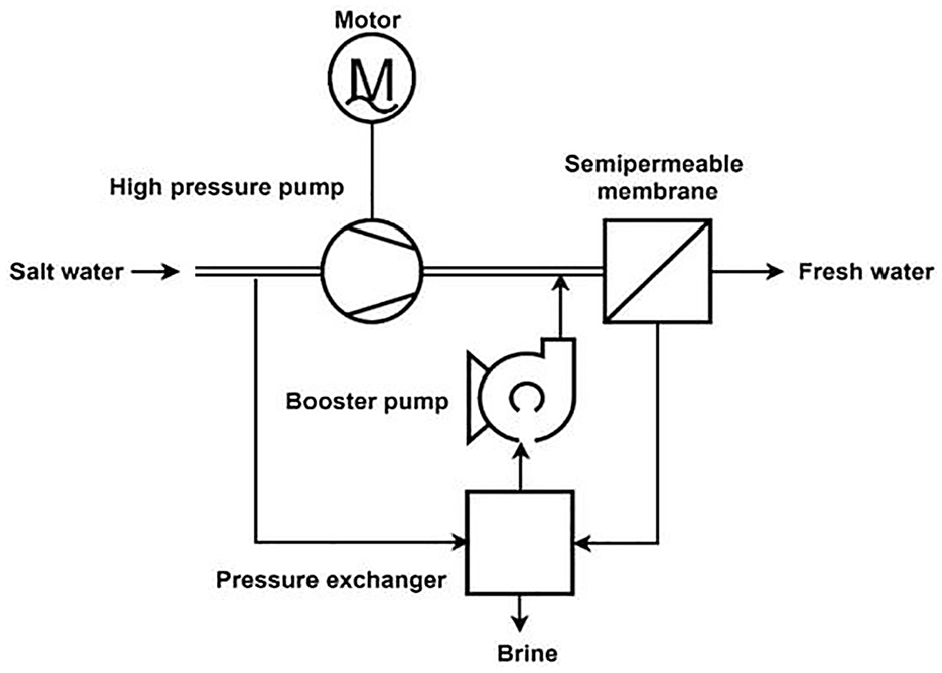
Diagram showing the energy recovery system and RO desalination unit in a schematic format. 8
The thermal process is the oldest but the most productive, where its principle is to apply heat to seawater to evaporate it, after that, it is condensed and collected in tanks. The membrane process is the newest way, but less productive than thermal desalination. Thermal desalination processes have a higher capacity than the membrane process, but the main problem is the high power consumption to produce fresh water. This high energy demand is due to the low efficiencies of conventional cycles. Another problem for thermal desalination is environmental impact.9,10 Since the issues for thermal desalination are identified, solar energy is considered to increase its efficiency and to produce more water from the same amount of seawater. 11 The Middle East and Gulf region, where large-scale conventional heat and power facilities are erected, accounts for 57% of the population. They are, however, growing more expensive to run since they use fossil fuels, and the pollution and greenhouse gas emissions they emit are becoming more widely acknowledged as being bad for the environment. Furthermore, even in coastal areas with plenty of seawater, such plants are not economically feasible in isolated locations. Fossil fuels are frequently in short supply, and the electricity supply is insufficient and unstable in many places.12,13 Reducing greenhouse gas emissions, setting targets for using renewable energy, and raising the cost of conventional systems all make it more feasible to integrate renewable energy resources into desalination and water purification processes.
Solar energy may offer a viable alternative for powering desalination facilities, particularly in nations that are located within the sunbelt, such as China, India, the Middle East, and Africa. The focus will be on solar power parabolic solar collectors that are used to collect sun rays to heat seawater. The potential for solar radiation in the Middle East, Arabia, and the Gulf states is extremely strong, particularly for direct solar radiation or direct normal incidence. The portion of solar energy that reaches the Earth’s surface as a parallel beam and is not distorted by clouds, gases, or dust in the atmosphere.3,14–16 For example, Jordan has more than 300 sunny days a year, providing a sunshine duration of about 3125 h per year. Because of this the Middle East is one of the best regions around the world to exploit solar energy projects. Scientists searched to develop a technology for solar desalination plants to make plants more efficient and faster than conventional ones. The studies that were conducted aim to increase the efficiency of the desalination process by using techniques that improve the performance of reverse osmosis (RO) and new technology such as graphene and forward osmosis (FO) units and the factors affecting them.14,15,17,18
Lately, a group of scientists from the Manchester Sciences Institute of Science and Technology worked on graphene and graphene oxide for distillate seawater. They found that a typical graphene membrane can remove 90%–95% of salt, whereas a graphene oxide-based membrane can remove up to 97% of salt. A graphene oxide membrane due to its high tensile strength and higher affinity to water is a perfect candidate for desalination. In reverse osmosis plants, it is required to reverse naturally occurring processes using external energy; therefore, electrical energy required for pumps accounts for approximately 44% of Ro plants’ total cost, the graphene oxide method on the other hand, is a naturally occurring filtration process.19–22 Feria-Díaz et al. 23 presented a review on the development of the three commercially used technologies: Multi-effect distillation (MED), Multi-stage flash (MSF), and vapor compression (VC) distillation. They displayed the level of water stress experienced by areas with limited access to freshwater as well as the state of desalination technology that might be used as a backup. The most recent research on desalination process optimization, efficiency improvements, and energy consumption reductions published for each commercial thermal method is showcased. Subsequently, a synopsis of the application of renewable energy is presented, along with its potential for integration into desalination systems that are both commercial and non-commercial.
Lastly, research trends and their focus on technology hybridization and renewable energy utilization are explored as viable solutions to the present brackish water desalination issues. Since recent advancements and trends in thermal desalination are illustrated, this thoughtful and updated study will assist researchers in having a complete state of the art of the field as well as a starting point for their research.24,25. Francis and Pashley 26 make a big effort by using an uncommon property of seawater, which is its ability to inhibit air bubble coalescence, which has been used in water desalination as a new method in this field. This method captures the vapor and moves it using a bubble column operated at temperatures lower than the boiling point. The inhibition of bubble adhesion in salt solutions. The bubble column was made with a high-volume fraction of small air bubbles; by this technique, it will be able to produce uniform and efficient water vapor in the bubbles, and then we condensed the water vapor to produce pure water. 27
The current study established a simulation program has been established and validated as shown in the next paragraphs that can be used to assess the influence of any parameter of the plant on its performance, by which time, effort, and money are saved. It is used to optimize the existing desalination process, improving efficiencies, reducing energy, and of existing multi-stage flash plants to increase the production of freshwater demands by adding a Reheat Solar Collector Cycle (RSCC) to multi-stage flash plants. The technique is used in two projects in different locations. El-Ghonemy 17 carried out an excellent study regarding Al-Khafji multi-stage flash plant in Saudi Arabia, in comparison with his research study, according to the current study and by using solar collectors to heat brine water and recirculate it in flash vessels, the efficiency of the plant increased by 7%. By developing these cycles and increasing the inlet temperature, we raise the efficiency by 18.6%.
Modeling and simulation
Developing a model to simulate a thermal desalination plant is very important since this simulation program can be used to predict the map of the part load operation of the overall plant. The map can then be used to determine the best control strategy that must be followed to optimize the performance of the plant during the off-design operation. Also, the simulation program can be used to assess the effect of any variable without the need for expensive prototype plants and experimentation. That saves money, time, and effort. An additional advantage of the simulation program is that it can be used as a troubleshooter to confine the defective area.
Mathematical model
The Reheat Solar Collector Cycle (RSCC) happens as follows: the brine water is taken from the last stage of distillation, then it is pumped to solar collectors. Solar collectors will raise the temperature of brine water to the flush point, and then the hot brine will enter flash stages. The hot brine water will evaporate instantly due to the pressure drop in the vessel, the steam produced will heat exchange with the seawater, so the steam condenses and then collects in the freshwater tank. To test the efficiency of RSCC, a study on the Al-Khafji MSF desalination plant, located in Saudi Arabia (KSA), was conducted. The plant contains 20 stages at the capacity of 600,000 gallons per day (2271.25 m3 per day). 17 Data from the Al-Khafji MSF desalination plant is shown in Table 2. Gain Output Ratio (GOR) is used to compute energy efficiency for MSF plants. The higher the GOR value is the better the performance plant.
Data of Al-Khafji MSF desalination plant.

The modeling is built according to the following assumptions:
a. The liquid and vapor in the evaporator are in thermal equilibrium.
b. The steam consistently condenses entirely.
c. Vapor leaks and air entrainment into or out of the system are absent.
d. The flow of non-condensable is negligible.
e. At the temperature of saturation, the condensate is removed.
f. Rather than the static hydraulic head, the boiling point rise is a chemical feature of the solution.
g. The vapor and brine streams leaving an effect have equal pressures.
h. The product vapor is salt-free
The following parameters were assumed:
a. Mass flow rate enters RSCC = 1 Mkg/h (277.78 kg/s).
b. Wind velocity = 1 m/s.
c. Heat transfer coefficient hout = 10 W/m2K.
d. Heat loss in pipes is negligible.
e. Pressure difference between each stage 1.5 bar.
f. The salinity field in which it operates has no influence on the flow and boiling temperature. 20
The energy balance equation based on the first law of thermodynamics needs to raise the brine temperature from 41°C to 110°C28,29:

In this study, the module of the LS-2 Parabolic Trough Collector (PTC) is used to gain the required energy to heat brine water. 30 It is illustrated in Figure 6. The dimensions of the collector.
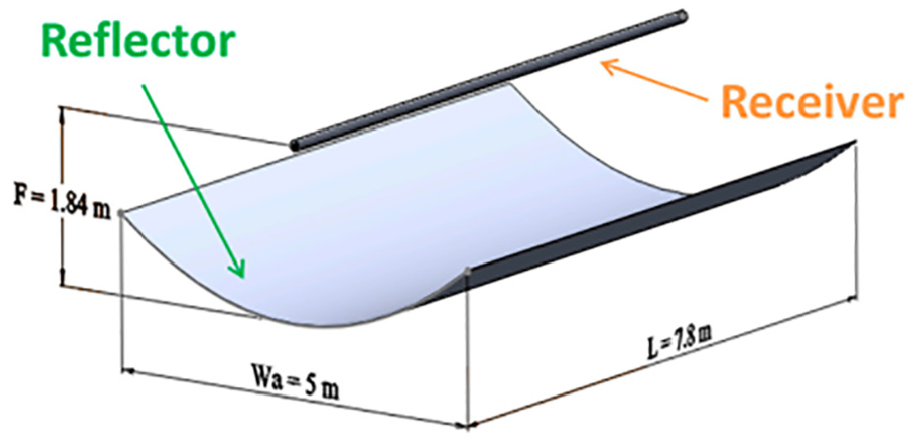
The examined module of the present project. 30
Assume the losses factor = 1.0985 for any losses that didn’t count. So, the total energy is 28 :

Regarding the irradiation value, it has been taken as a sample to get the minimum area required of the plant in Aqaba. To calculate the amount of solar energy from the sun impacting the collector use the relation below 31 :

The absorber’s heat losses (Qloss) to the cover are28,29:

Where Tsky calculated from equations below.28,32
Regarding the sky temperature, it has been calculated using equation (5) below, taking into consideration that the average ambient temperature in Aqaba around the year is 25°C and average wind speed is 1 m/s:

To calculate the heat transfer coefficient hout over the glass envelope the following formula has been used. 32

Choosing a typical wind speed (V w ) of 1 m/s will result in hout ≈ 10 W/m2K. 33 The vacuum between the absorber and cover allows us to ignore the traditional heat losses in our system, which is examined under steady-state circumstances. Additionally, in the steady state of the system, the thermal losses from the absorber to the cover equal the losses from the cover to the surrounding air. Our energy needs can be met by the following number of parabolic trough solar collectors, as indicated by Okonkwo et al. 31 :

So, we need 3604 LS-2 PTC. The thermal efficiency for solar collectors (ηcol) is given below29,31:

Note that the thermal efficiency was found ηcol ≈ 0.72 according to the dataset for the approximation studies. 32 The total required area for the PTSC is given by:

Now, the hot brine water is ready to enter the flash vessels. The required calculations of each stage for flash vessels are showing below using the date in Table 3 for the physical properties of all stages.
Physical properties of brine water at all stages. 34
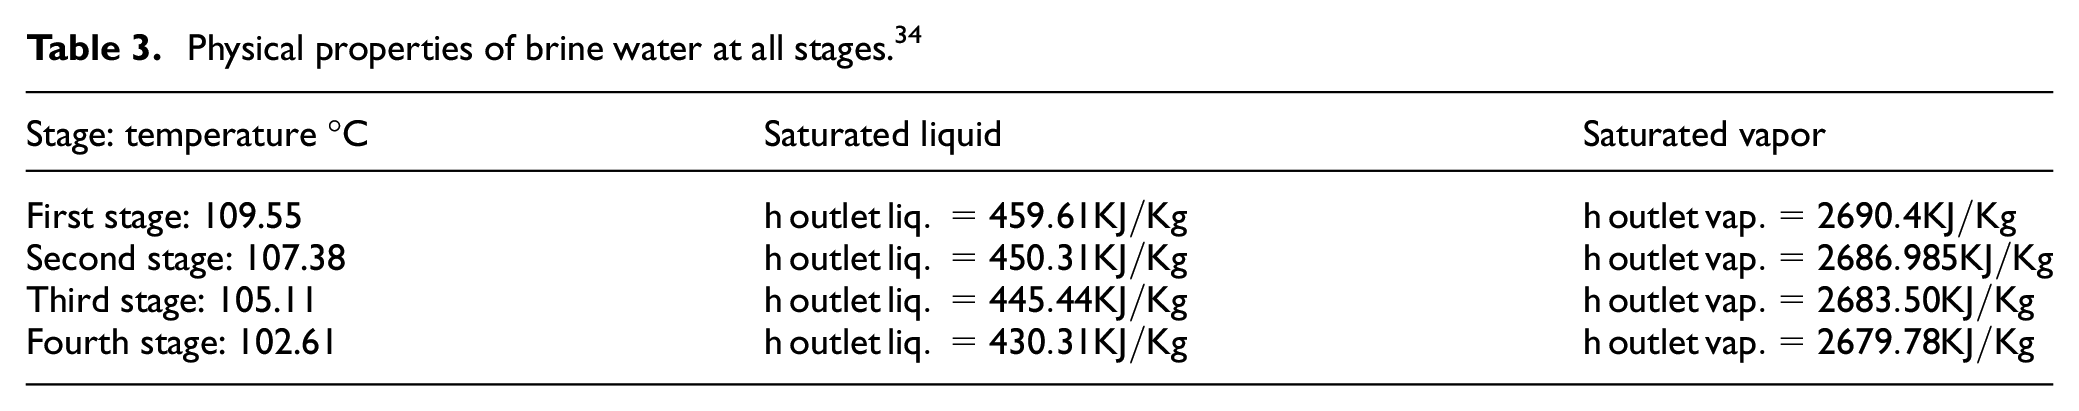
For the given data T = 110°C, P = 1.5 bar, Specific enthalpy (hinlet) = 461.47 kJ/kg from steam table
35
and for a given data P = 0.4 bar, saturated properties from Table 3. Mass flow rate (


The same calculations were carried out for other stations, and the results are shown in Figure 7 below:
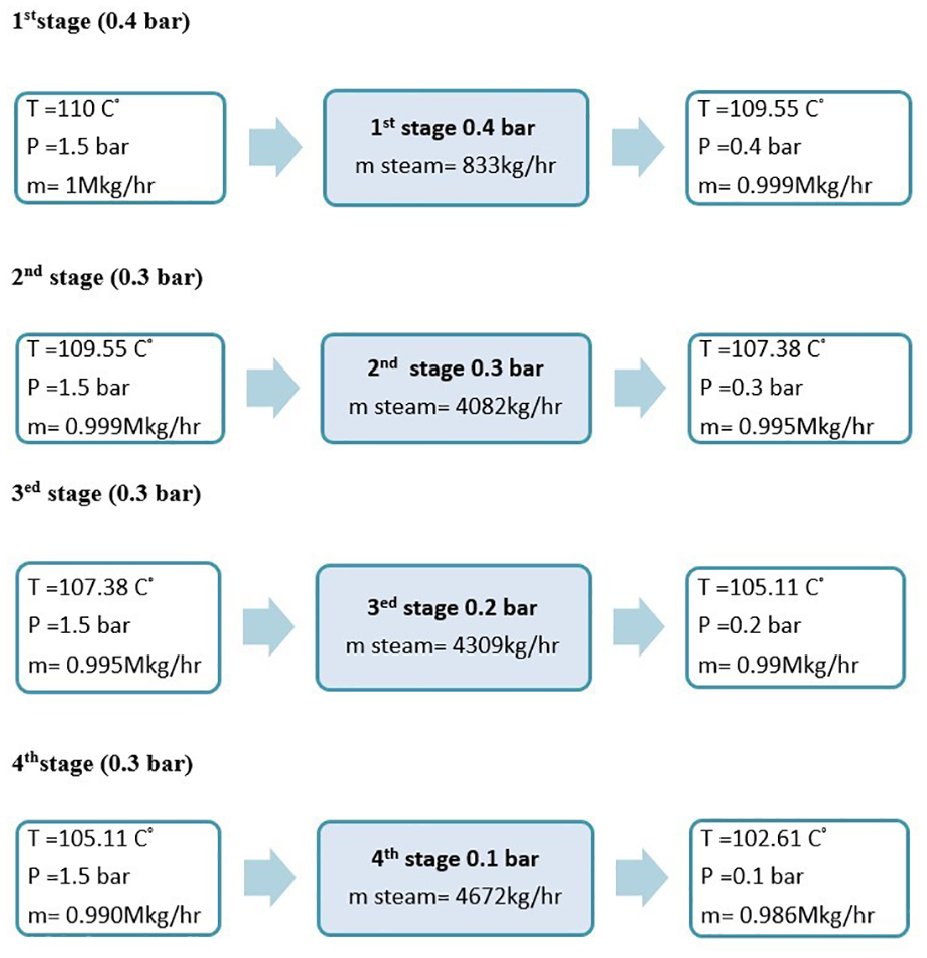
Data for all stages of RSCC of the Al-Khafji plant.
The total mass flow rate (∑

The Gain output ratio of the distillate water is given by the equation below 36 :

Design plant
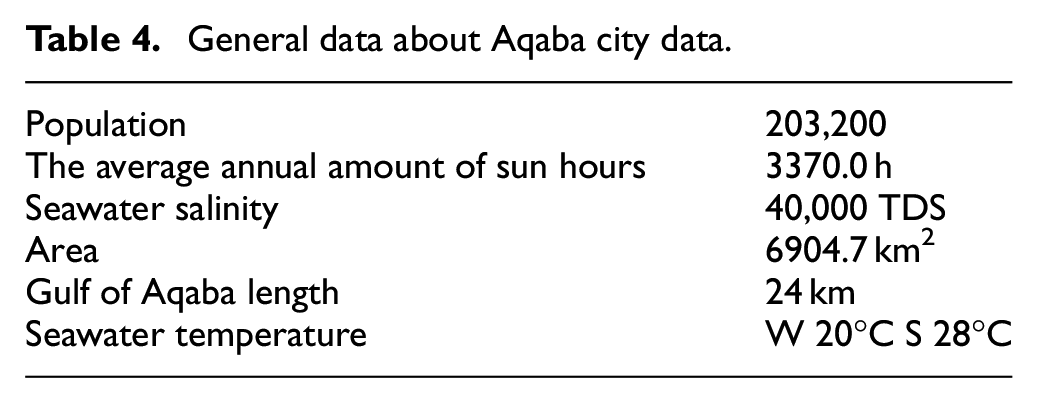
In RSCC, solar collectors were used to improve the efficiency of desalination plants that already exist. So RSCC is the first step to designing a solar desalination plant (SDP). In this part, the thermal desalination plant based on solar energy will be designed. First of all, a suitable location for a desalination plant has to be specified. So, in Jordan, Aqaba is the only coastal city, and Tables 4 and 5 exhibit the general data about Aqaba city. The water will be pumped from the Red Sea in two ways mainly; the first way is using beach wells which are constructed on the beachside in the form of vertical boreholes and the sandy soil is used as natural pre-filtration and thus a better feed water quality is obtained. The second way is using submersible pumps. Similarly, the parabolic solar collectors are used to raise seawater temperature from 20°C to 110°C as shown in Figure 8. The flash vessel is used to create a sudden low-pressure area. In the case of sudden evaporation of hot seawater because of the sudden pressure drop. The vacuum in the flash vessel is achieved by a steam ejector driven by high-pressure steam by a mechanical vacuum pump or by an orifice plate. Steam is packed in pipes, then the hot steam is condensed by heat exchange with cold seawater and collected in freshwater tanks. Based on the results obtained from the existing plant, a separate study will be conducted on the city of Aqaba. Data on the Red Sea were collected through studies conducted for 30 points in the waters of the Sea, Gulf of Aqaba, Jordan. The following parameters were assumed: the mass flow rate entering the plant = 1 Mkg/h (277.78 kg/s); wind velocity = 1 m/s; heat transfer coefficient hout = 10 W/m2K, heat loss in pipes is negligible, the pressure difference between each stage 3 bar, and the salinity field in which it operates does not influence the flow and boiling temperature.
General data about Aqaba city data.
Data for Al-Aqaba SD plant.

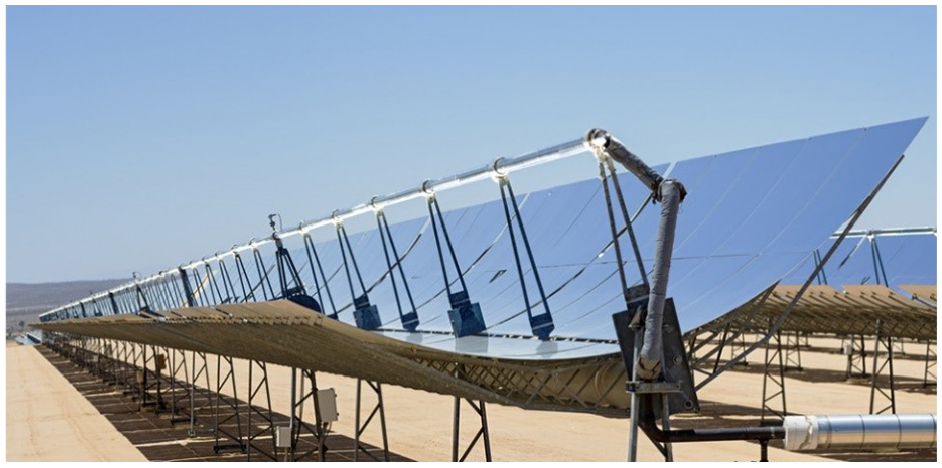
Parabolic solar collectors (PSC).
To compute the total area required to build the desalination plant using (LS-2 PTC) collectors in Aqaba: Based on the first law of thermodynamics, the total heat

The solar energy generated in each collector can be found by this relation.

The number of parabolic trough solar collectors that we need for our energy requirement is given by:

So, we need 4505 LS-2 PTC. The total required area for the Parabolic Trough Solar Collector (PTSC) is given by:

The same calculations as shown above in Figure 9, are conducted. The total mass flow rate (∑

Data for all stages of RSCC of Aqaba SD plant.
Reheat Solar Collector Cycle (RSCC) for the Aqaba plant
In this project, seawater from Aqaba is used to produce fresh water by distillate it. Seawater from Aqaba comes with 20°C in winter and 28°C in summer with 40,000 TDS (40 g/L). The solar collectors were used to raise the temperature from 20°C to 110°C. 100 MW with 100 Hectare and flush vessels are required (four flush vessels with pressure 0.4/0.3/0.2/0.1). The produced mass flow rate is approximately 15,000 kg/h and the water exits from the four stages at 102°C and 40,570 TDS (41 g/L).
Simulation and feasibility study
The water desalination plant means using large areas and a lot of money that cannot be risked. Therefore, a simulation model is imperative to be created for the practical study of what will happen in the station and to know the feasibility. After studying the project specifications, quantities, and the local availability of the materials and their prices, it was found that the implementation of a model for this project is not possible for the following reasons:
a. The significant cost of the intended equipment, as indicated in the purchasing list.
b. The main parts are not available locally and need a long time for external shipping, with a minimum of 4 months to arrive, due to the Corona pandemic.
c. Safety issues while operating the model.
This means that the application of the project practically is useless at the moment. So, it is better to go to a simulation program. In these simulations, LabVIEW was used as the main simulation software. LabVIEW is systems engineering software for applications that require testing, measurement, and control with rapid access to hardware and data insights. According to the modeling of the plant, a block diagram is written as shown in Figure 10.

Block diagram for simulation.
Simulation program using LabVIEW package
Simulation is converting the model into a computer program using any package of languages. This simulation program has been developed as realistically (by using the steam tables according to state conditions at any point) as possible, but it has to be validated by making a test rig and by comparing the real plant results with the simulation results. The program can easily be modified and corrected if it appears necessary. The data that has been used in the program, whether it was for the working fluid (water) or the component’s characteristics, has been taken to be based on practical work (actual data using the steam tables).
LabVIEW consists of two windows:
a. Front panel: The user interface is displayed in the front panel window (Figure 11). The interactive input and output terminals are represented by the controls and indicators on the front panel, respectively. The block diagram automatically displays the controls and indicators that are located on the front panel. For additional details on block diagram terminals, see the “Block Diagram” instruction.
b. Block diagram: The LabVIEW program’s graphical source code is included in the block diagram (Figure 12). The purpose of the block diagram is to logically and simply divide the graphical source code from the user interface. On the block diagram, front panel objects are represented as terminals. Changes made to matching front panel objects are reflected in the block diagram’s terminals, and vice versa (Figure 13).

Front panel window of LabVIEW.

Block diagram in LabVIEW.
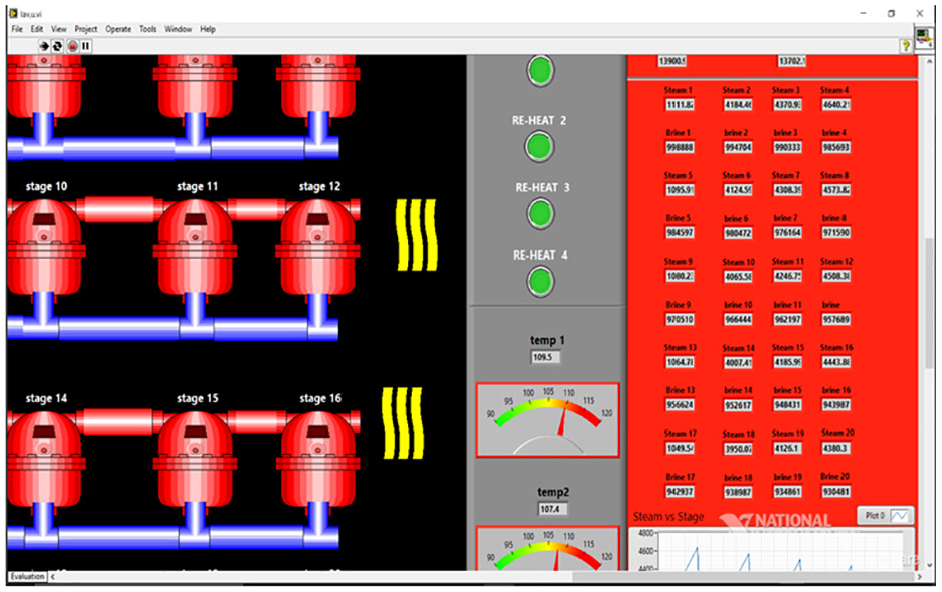
Front panel after completing the simulation program on LabVIEW Validation of the simulation program.
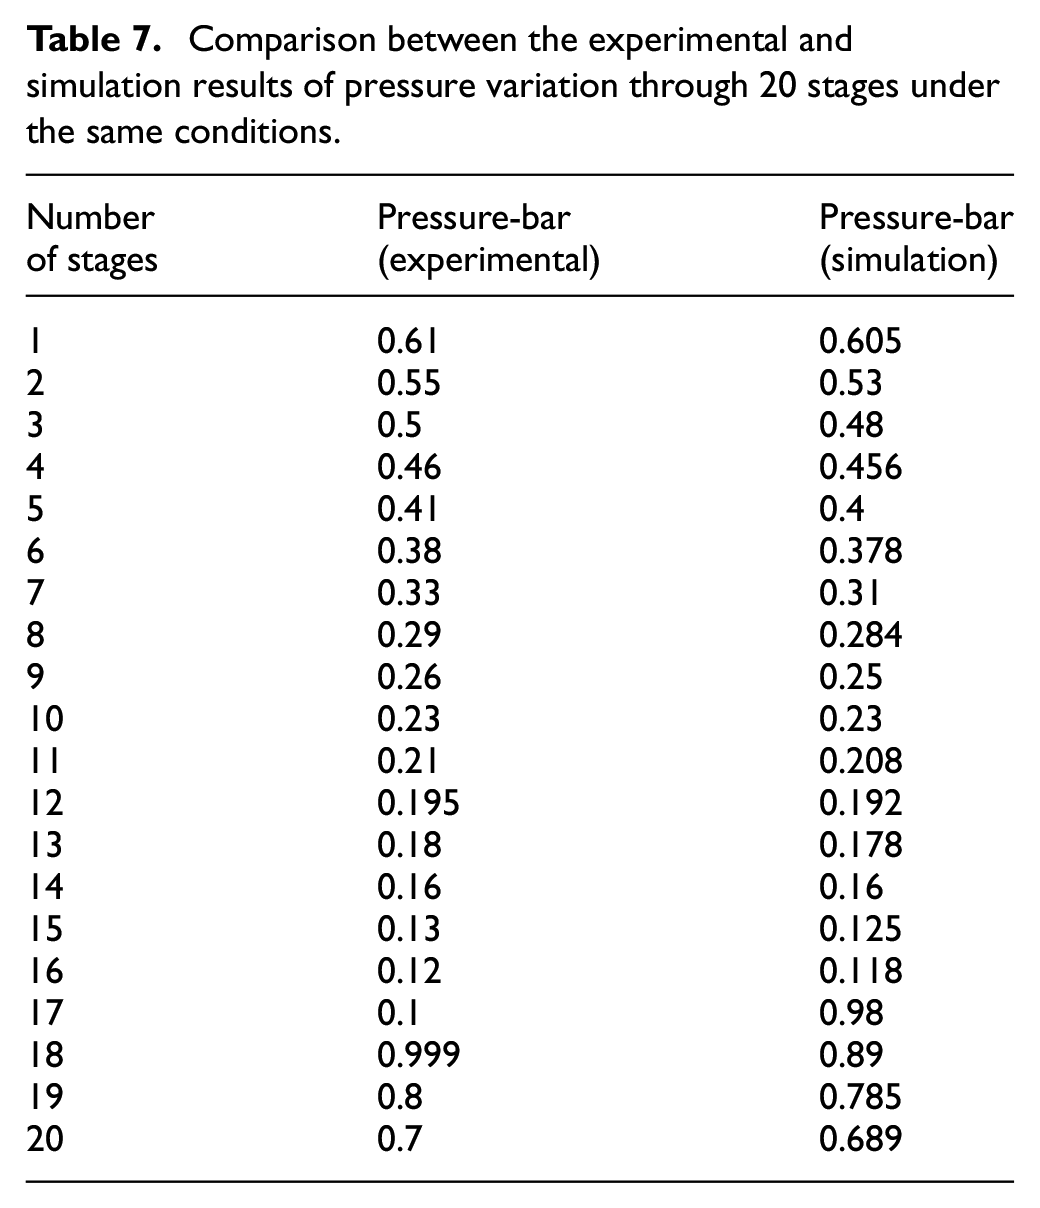
The simulation program has been validated by comparing the results from El-Ghonemy. 17 The results show very close matching between them as shown in Tables 6 and 7 below:
Comparison between the experimental and simulation results of brine concentration TDS.ppm through 20 stages under the same conditions.

Comparison between the experimental and simulation results of pressure variation through 20 stages under the same conditions.
Results and discussion
Result of RSCC
By using RSCC we get the following results:
Increase the steam gained from the same amount of seawater entering the process (from 184,000 to 198,000 kg/h) by around 7.7%, this increase by using just four stages.
Increasing the plant capacity per day (from 2271.25 to 2430 m3/day) by about 7.1%.
Increasing GOR from 7.8 to 8.4 (efficiency increased).
Lower GHG emissions, that’s due to we get more freshwater by using solar power.
More freshwater without thermal or electrical power added.
Decrease the cost of distillation, that’s due to decreased operational costs for the plant.
Get freshwater faster than the conventional method.
Lower energy consumption.
Can be used for any thermal desalination process (MSF, MED, VC).
The performance of the modified (RSCC) MSF plant can be shown in Figures 14 to 18 below:

Inlet mass flow rate for the four stage.

Steam mass flow rate for the four stage.

Inlet water temperature for the four-stage.

GOR for the original plant and modified after using RSCC.
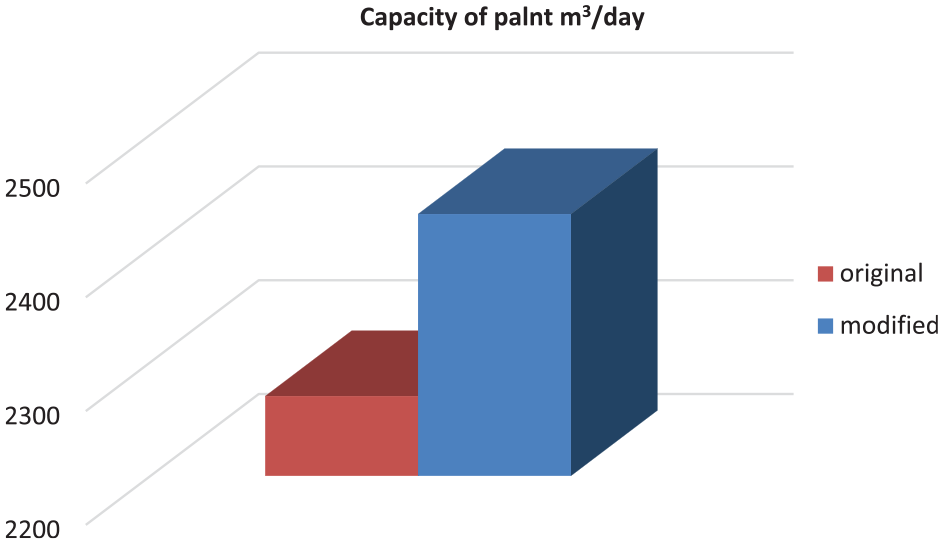
Capacity for the original plant and modified.
Figure 14 shows the inlet mass flow for each stage and Figure 15 shows the steam mass flow for each stage also. As the inlet mass increases the steam mass decreases. Figure 15 also exhibits the production of fresh water in each state. The difference is due to the difference in pressure for each stage where it is from 1.5 to 0.4 bars, for the second stage it is from 1.5 to 0.3 bars, for stage 3 it is from 1.5 to 0.2 bars, and for the fourth stage it is from 1.5 to 0.1 bars. Figure 16 shows the water temperature at each stage. The temperature decreases when entering a new stage. The gain output ratio (GOR) is much larger for the modified state than the original state. The ratio increased from 7.75 to 8.45.
The result of Aqaba SDP
a. Aqaba SDP generates 72,500 kg/h steam at 10 bar and 69,000 kg/h at 3 bar.
b. The efficiency of Aqaba SDP is 7.3%.
c. The generation of solar power from solar collectors and reheat cycles 128 MW.
The performance of the SDP plant for different pressure values is shown in Figure 19. The Total steam mass increases with the pressure of the plant.

Total steam for deferent pressure values of the Aqaba SD plant.
Discussion
Part 1: From the case study that was done on the Al-Khafji plant, it produces 184,000 kg/h from 2.5 Million kg/h that enters the plant and consumes 23,000 kg of steam to produce it, with 20 stages. In our project, we produce 14,000 kg/h from 1 million kg/h that enter the flush vessels without consuming any quantity of power and with just four stages. Increasing the pressure of water that enters flash vessels from 1.5 to 3 bar as shown in Figure 20 was discussed. For example, we find that the mass flow rate of vapor in the first stage is 900 kg/h, and when the pressure is 1.5 bar, the mass flow rate of vapor is 833 kg/h. From this result, we deduce that increasing the pressure of the water that enters the flush tank does not have a Satisfactory effect.
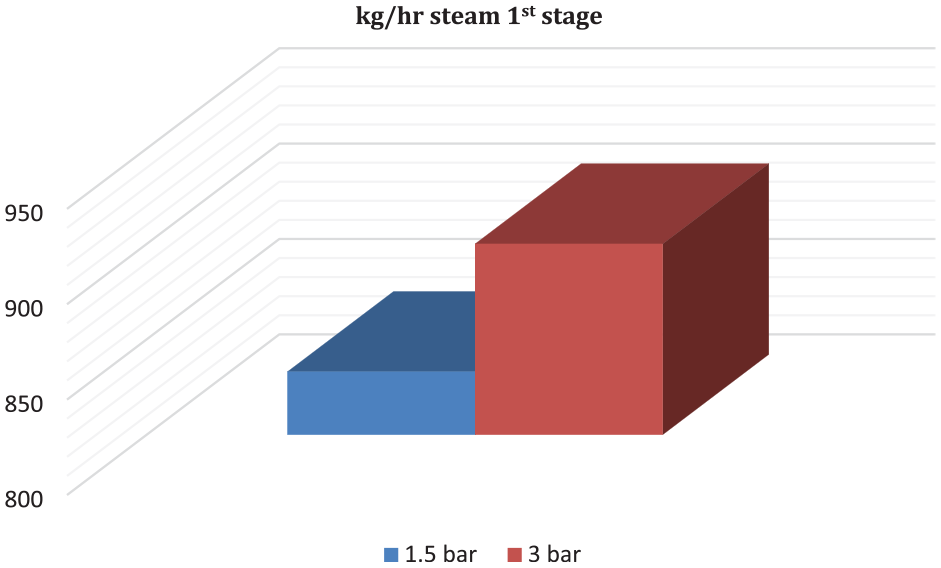
Effect of increase the pressure of the first stage RSCC.
The mass flow rate vapor in the first flush vessel increases to 19,000 kg/h when the temperature is 110°C, whereas when the temperature is 110°C the mass flow rate vapor is 833 kg/h as shown in Figure 21. However, the heat rate increases from 80 to 90 MW, which will increase the number of solar collectors and the area for the solar collector, which will increase the cost in comparison to 110°C enter.

Effect of increased temperature of the first stage RSCC.
According to the results from the simulation program, Al-Khafji desalination plant can be developed as follows:
a. Start the first stage at 0.6 bar instead of 0.4 bar.
b. Increase the inlet temperature from 110°C to 120°C
c. Increase the number of stages from four to seven stages.
d. The pressure of the last stage equals 0.05 bar instead of 0.1 bar.
For the Al-Khafji plant, The RSCC plant developed as follows: see Table 8 and Figures 22 to 24.
Results of the development plant at RSCC Al-Khafji plant.

Summation of steam flow rate = 34,162 kg/h.
GOR = 9.25 → increased by 18.6%.
Capacity = 2676 m3/day.

Comparison between original, RSCC, DEV RSCC at Al-Khafji plant.

GOR for original, RSCC, DEV RSCC at Al-Khafji plant.

TDS per cycle at Al-Khafji plant.
In this research, the solar collector is used, not a solar tower, because according to the solar power plant (PS20) that is located in Spain, Seville, it has a capacity of 20 MW by using 1255 mirrors, which requires 15 hectares, 37 and a Khi Solar One (KSO) solar tower plant located in the Northern Cape Region of South Africa has a 100 MW capacity by using 4120 mirrors, which requires 57 hectares. 27 The current project uses a solar collector with a capacity of 80 MW and 2041 mirrors, which requires just 8 hectares.
Part 2: Noticing that the water exiting the four-stage process has approximately the same salinity as the water entering, we suggest doing another cycle with the same number of stages, and we need 0.7 hectares to raise the temperature from 102°C to 110°C. We have two ways to do the second cycle: the first is to re-enter in the same solar collector and flush vessel, and the second is to use other solar collectors and flush vessels as shown in Figure 25. The second way is preferred because the two ways have the same productivity as shown in Figure 26 and need the same power, but the second way is faster than the first way because you do not need to wait for the first cycle to end before entering the other solar collector.

Power needed for first cycle and reheat cycle.

Productivity of first cycle and reheat cycle.
Conclusion and recommendations
Conclusion
Fresh water in the world is scarce, and methods of desalinating saline water are costly and waste energy, and have implications for the environment. This is an indication of the necessity of researches and developments for new methods to increase their efficiency. Through this project, we conducted a study on the Al-Khafji MSF plant, and we found a method to increase its efficiency depending on solar power. By using solar collectors to heat brine water and recirculate it in flash vessels, the efficiency of the plant increased by 7%. And by developing these cycles and increasing the inlet temperature, we raise the efficiency by 18.6%. Jordan is the second most water-scarce country in the world. Jordan’s annual renewable water resources are less than 100 m3 per person, significantly below the threshold of 500 m3 per person which defines severe water scarcity. To solve these problems, we designed a full solar desalination plant in Aqaba city. These plants produced 72,500 kg/h of freshwater by desalinating water from the Red sea. These two ways offer solutions for plants that already exist and plants that will be established in the future. By using RSCC, the following results are obtained:
Increase the steam gained from the same amount of seawater entering the process (from 184,000 to 198,000 kg/h) by around 7.7%, this increase by using just four stages.
Increasing the plant capacity per day (from 2271.25 to 2430 m3/day) by about 7.1%.
Increasing GOR from 7.8 to 8.4 (efficiency increased).
Lower GHG emissions, that’s due to getting more freshwater by using solar power.
More freshwater without thermal or electrical power added.
Decrease the cost of distillation, that’s due to decreased operational costs for the plant.
Get freshwater faster than the conventional method.
Lower energy consumption, and it can be used for any thermal desalination process (MSF, MED, VC).
Recommendations and future works
Solar radiation potential, especially for direct solar radiation or direct normal irradiance (DNI), and because of that we recommended using the SD plant as the main source of freshwater. DSP has one critical problem; high salinity seawater causes quick corrosion in plant pipelines. In future work, our target is to solve this problem.
Footnotes
Appendix
Handling Editor: Aarthy Esakkiappan
Declaration of conflicting interests
The author(s) declared no potential conflicts of interest with respect to the research, authorship, and/or publication of this article.
Funding
The author(s) received no financial support for the research, authorship, and/or publication of this article.
Consent for publication
All participants gave their consent for their data to be published in the journal article.
Data availability
Data available on request.