
Abstract
This study analyzes the technical and economic feasibility of hybrid photovoltaic/thermal (PVT) solar energy systems, comparing them with independent flat plate solar thermal collectors (FP) and photovoltaic (PV) modules. Using TRNSYS software, different configurations were simulated under the climatic conditions of Mexicali, Baja California, Mexico. The results indicate that, although independent FP and PV systems exhibit better energy performance in terms of energy production and solar fraction, PVT collectors offer higher specific global energy production (electrical + thermal). However, the economic feasibility of PVT systems is limited due to high investment and maintenance costs, coupled with the low cost of thermal and electrical energy in the study region. Independent FP and PV collectors also face similar economic challenges, with return on investment extending beyond the 20-year lifespan of the project. Additionally, the low thermal energy demand for domestic hot water in the studied region negatively impacts the efficient utilization of these systems. This analysis suggests that in contexts where available installation space is limited, PVT systems can be an efficient solution. However, in scenarios with sufficient space and high energy costs, energy generation with separate equipment remains more viable. Moreover, climatic conditions and DHW demand affect the efficiency of the systems. The discrepancy between solar energy generation and hourly DHW demand necessitates the implementation of TEST, which significantly increases costs and impacts the economic viability of the project.
Introduction
In the current context, energy consumption continues to increase at an alarming rate. In 2022, global energy consumption reached 442 EJ, accompanied by the emission of 36,930 million tons of CO2e (International Energy Agency, 2023). Of the total energy consumed, 30% was attributed to the building sector, equivalent to 133 EJ. Additionally, 10% of the world's energy consumption was allocated to electricity use in buildings, representing 8% of global CO2e emissions (International Energy Agency, 2023). This situation is alarming because the continuous increase in energy consumption exacerbates environmental pollution, especially since most of this energy comes from fossil fuels. This creates a vicious cycle where the increase in energy demand leads to higher levels of pollution, intensifying the negative effects of climate change. Therefore, it is crucial for governments, businesses, and citizens to collaborate in adopting measures that promote more efficient and responsible energy use, ensuring a more sustainable and healthier future for all (Aguilar-Jiménez et al., 2018). The implementation of advanced technologies and sustainable practices can significantly reduce the carbon footprint (Nesmachnow and Risso, 2024; Velázquez-Limón et al., 2020).
The hybrid photovoltaic/thermal (PVT) solar collector technology has been proven to be a technically and, in some scenarios, economically viable option for the simultaneous generation of electrical and thermal energy (Kramer et al., 2023). This technology offers several technical advantages compared to other systems, such as better energy utilization of the installation area (Shirinbakhsh and Harvey, 2024), reduced installation time and costs compared to technologies that provide the same services independently (Kazem et al., 2024), and increased photovoltaic efficiency in certain scenarios (Chavarría-Domínguez et al., 2024). These reasons have led to a notable growth in recent years in the multidisciplinary research interest in this technology, revealing a broad and innovative field of application in the energy sector and in reducing pollutant emissions. Due to the great versatility offered by the integration of photovoltaic and thermal solar technology, numerous PVT hybridization options have been proposed, with different geometries, sizes, energy integration methods, applications, and efficiencies, among others (Ahmed et al., 2024). Among the various applications of these technologies are the generation of electrical and thermal energy in the domestic (Ben Seddik et al., 2022), commercial, and industrial sectors (Kramer et al., 2023; Oh et al., 2023), seawater desalination (Anand et al., 2021), cooling (Hamzat et al., 2021), heating (You et al., 2021), hydrogen production (Salari et al., 2022) and food dehydration (Tiwari et al., 2021). However, this technology still faces technological and economic challenges that need to be addressed to accelerate its implementation (Hamid et al., 2023).
The technical aspect of PVT solar collector technology can be considered mature, as there are companies that have been marketing PVT collectors for some time with overall efficiencies (electrical and thermal) of up to 89% (Abora Solar, n.d.). One of the main areas of opportunity for PVT collectors is their economic viability, as their investment costs are usually high (Mostakim and Hasanuzzaman, 2022). Factors such as high costs of electrical and thermal energy, as well as good solar resources at the installation site, can make this technology more economically attractive (Acosta-Pazmiño et al., 2022).
Seddik et al. (Ben Seddik et al., 2023) evaluated the performance of a hybrid PVT system in two climatic zones of Morocco, Errachidia and Tangier, compared to a parallel installation of PV and flat plate (FP) modules. Using simulation models in TRNSYS18, dynamic electrical and thermal yields were estimated, and energy, economic, and environmental analyses were performed. The results show that the PV/FP system outperforms the PVT system in all aspects in both climatic zones. However, the PVT system remains an important renewable alternative for projects with limited space and the need for thermal and electrical energy, especially in the construction sector in Morocco.
On the other hand, Odeh and Aden (Odeh and Aden, 2025) evaluated the performance of PVT systems in the residential sector of Sydney, focusing on a PVT collector with heat pipe technology. The results reveal that the overall energy efficiency of the proposed PVT panel, on a typical day, is approximately 45%, significantly outperforming traditional PV panels by more than double. Furthermore, the payback period for a typical residential PVT system, providing both hot water and electricity, is substantially shorter than that of installing separate PV and solar hot water systems, highlighting the economic and environmental benefits of the proposed hybrid system.
Pino et al. (Pino et al., 2024) evaluated the energy output and economic viability of PV and PVT systems for a microbrewery. Simulations using TRNSYS and real load profiles from a Spanish microbrewery show that in a hot coastal Mediterranean location, a PVT system can cover up to 26.4% of electricity and 47.6% of heat demand. These figures vary by location, with a central European site covering 27.6% of electricity and 35.7% of heat. PVT systems outperform PV in total energy yield by up to 67% due to the inclusion of useful heat. However, the economic effectiveness of PVT is lower, with a payback period over 12 years, suggesting the need for improved manufacturing techniques to reduce costs.
Aguilar-Jiménez et al. (Aguilar-Jiménez et al., 2020) studied the performance and economic viability of hybrid PVT systems for simultaneous electricity and heat production under different climates and energy tariffs. Using TRNSYS, a simulator was validated to compare energy production across five cities: Mexicali, Soria, Bigene, Fresno, and Madison. Results indicate Mexicali achieves the highest energy output, with an 80% solar thermal fraction achievable using three modules. However, Soria offers the most attractive investment returns and monetary savings. Subsidy scenarios show a payback period of 1.8 years with a 75% subsidy. The study highlights how climate conditions, such as solar radiation and ambient temperature, influence PVT system performance, aiding in decision-making and financial planning for support programs.
Previous studies agree that PVT technology is energetically efficient and can significantly contribute to the electrical and thermal energy demands of a wide range of applications. However, the authors also concur that one of the main challenges of these collectors lies in their economic feasibility. This article presents an operational study of a system for generating electrical and thermal energy using PVT collectors, compared to flat plate solar thermal and photovoltaic collectors operating simultaneously, applied to the domestic sector in the city of Mexicali, Baja California, Mexico, known for its low winter temperatures and high summer temperatures. Additionally, the economic feasibility is analyzed, considering the initial investment costs and the local prices of electrical and thermal energy.
System description
The system considered in this study is illustrated in the schematic diagram in Figure 1. The solar circuit pump draws water from the bottom of the thermal energy storage tank (TEST) and transports it to the PVT or flat plate (FP) collector, depending on the type of collector being studied. In the collector, solar radiation is converted into thermal energy, which is transferred to the heat transfer fluid from the TEST. The fluid, which in this study is water, returns at a higher temperature to the top of the TEST.

Schematic diagram of the solar heating and electric generation system using PVT, FP and PV modules.
The hot water used for the domestic hot water system (DHW) and to meet the thermal demand is taken from the top of the TEST. Depending on the temperature of the water and the temperature required by the user, it can be further heated by an auxiliary heater. If the heat transfer fluid at the outlet of the TEST is at a higher temperature than required by the demand, its mass flow will be reduced and mixed with tap water to lower its temperature, using a mixing valve. The DHW flow is used by the user, so the same amount of water extracted to meet the demand is replenished to the TEST with tap water, whose temperature depends on the locality and climatic conditions. The electrical energy generated by the PVT and PV collectors is delivered entirely to the demand and analyzed separately.
To control the operation of the PVT and FP collector systems, a series of equipment and accessories are considered, such as differential temperature controllers, pumps, and mixing valves. For both the PVT solar collector scenario and the FP scenario, the solar circuit pump is used to operate the solar heating circuit. This pump turns on or off based on the temperature differential between the collector's outlet and inlet. If the outlet temperature of the solar collector is higher than the inlet temperature, the differential temperature controller sends a signal to turn on the solar circuit pump, initiating the heating of the fluid in the TEST. Conversely, if the outlet temperature is lower than or equal to the inlet temperature, the controller sends a signal to turn off the solar circuit pump to prevent thermal energy loss.
The controller also has a minimum upper temperature differential (hysteresis) that the outlet temperature must exceed relative to the inlet temperature to trigger the pump to turn on (in our case, 2 °C) to avoid frequent on/off cycling in response to the presence or absence of solar radiation, a common practice in real solar installations.
Equipment characteristics
For the study of the energy system, commercially available PVT, FP, and PV technologies were considered, as detailed in Table 1. The selected PVT collector is the aH72 model from Abora Solar (Abora Solar, n.d.), which has overall efficiencies (thermal and electrical) of up to 87%, making it one of the most efficient commercially available hybrid solar collectors. This collector has a capture area of 1.88 m2 and, under standard operating conditions, can produce an electrical output of 350 W. The FP collector considered is the Maxol MS2.5 model from Modulo Solar (Módulo Solar, n.d.), with a capture area of 2.32 m2 and the capability to produce a thermal output of up to 1.8 kW under standard conditions. The PV module used is from JA Solar, with a peak power of 350 W and an area of 1.95 m2 (JA Solar, n.d.). The complete characteristics of the equipment can be found in the technical data sheets from each referenced company.
Characteristics of the collectors and modules used in the study.
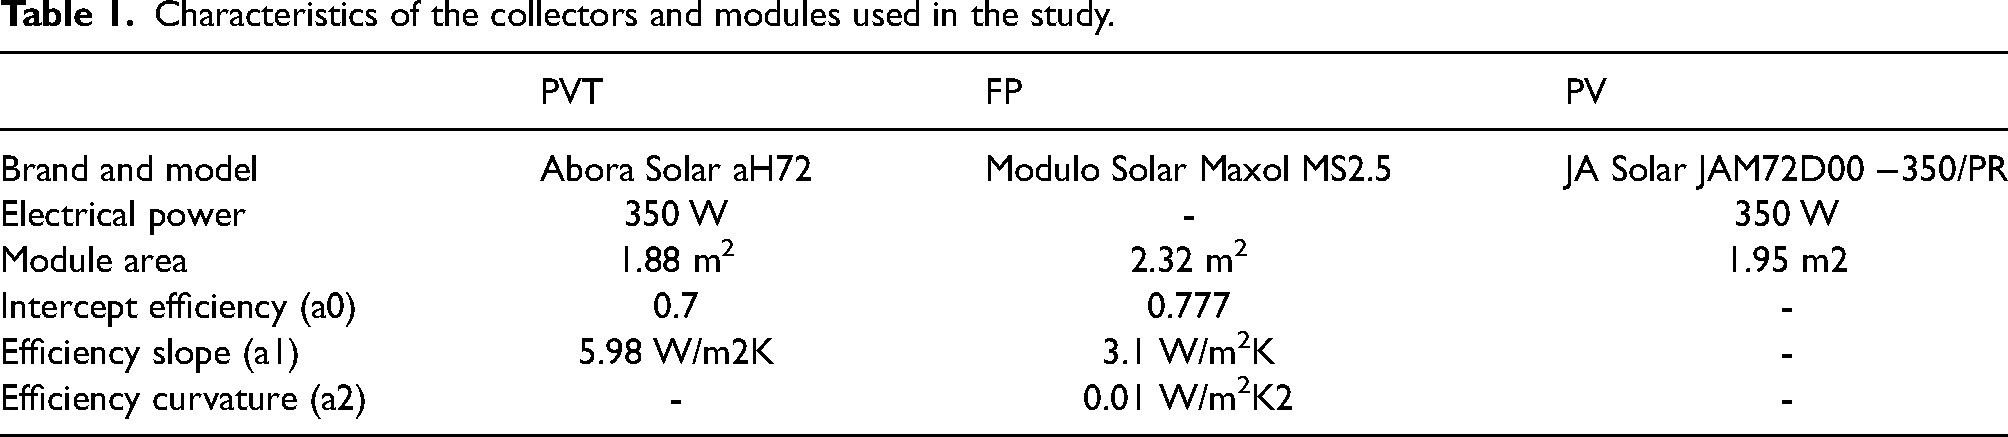
Characteristics of the collectors and modules used in the study.
Case study: SDHW in Mexicali, Mexico
Solar heating and photovoltaic generation technologies were studied under the climatic conditions of Mexicali, Baja California, Mexico (32°35'35.6"N 115°26'08.7"W), due to the extreme climate conditions present in this city. Mexicali is characterized by its low annual precipitation and has a hot desert climate (BWh), according to the Köppen climate classification. Its winters rarely have ambient temperatures below 0 °C, while summers often experience temperatures above 45 °C, with highs reaching up to 50 °C. This results in lower annual domestic hot water needs compared to other regions with colder climates.
Figure 2 shows the ambient temperature, tap water temperature, and global horizontal solar radiation for Mexicali, information obtained from PVGIS (JRC Photovoltaic Geographical Information System (PVGIS) - European Commission, n.d.). The tap water temperature is an important variable in the study, as its variation will influence the operating conditions of the solar heating system when entering the TEST and mixing with the hot water.

Climatological information for the city of Mexicali, showing ambient temperature, tap water temperature and global horizontal solar radiation, obtained from PVGIS (JRC Photovoltaic Geographical Information System (PVGIS) - European Commission, n.d.).
In this study, the Tapping program No. 3 of the EN 15316-3-1 standard (BS EN 15316-3-1:2007 - Heating systems in buildings, n.d.), or the Load profile L of the EN 13203-2 standard, was employed. This particular profile, which corresponds to a daily hot water consumption of approximately 200 L, represents the needs of a single-family household. It was consistently used across all case studies to establish a comparable benchmark for hot water supply requirements. The graphical representation of this profile can be observed in Figure 3.

DHW profile based on Tapping program No. 3 of the EN 15316-3-1 standard (BS EN 15316-3-1:2007 - Heating systems in buildings, n.d.).
To quantify the energy generation of the different technologies and perform a technical and economic comparison, indicators of energy generation and loss, auxiliary energy needs, and solar energy contribution to the demand were used, based on the number and area of PVT collectors, flat plate solar thermal collectors, and photovoltaic modules.
Solar fraction
Depending on the scenario, it may happen that not all the solar thermal energy produced by the solar collectors is utilized by the demand or user, as the period when solar energy is generated does not always coincide with the heat demand. This can result in solar thermal energy losses.
The solar fraction, also known as the coverage ratio or solar contribution, is an indicator used in solar thermal energy systems to measure the proportion of the total energy demand that is met by solar energy. Specifically, the solar fraction indicates how much of the energy demand for a specific service (such as domestic hot water, heating, etc.) is directly covered by solar energy instead of conventional energy sources, such as electricity or fossil fuels. A value of 1 indicates that the entire heat demand for water heating was supplied with solar energy, while values less than 1 denote a contribution from another heat source, usually the auxiliary heating system. The solar fraction is calculated according to Eq. 1 (Gagliano et al., 2019a; Nualboonrueng et al., 2013):
In the event that there is insufficient solar energy capture and/or not enough energy stored in the TEST, the hot water supply to the demand must be ensured by an auxiliary heater, providing the required quantity and temperature level. To calculate the thermal energy required by the mass flow of the heat transfer fluid to reach the user-defined temperature, in this case the set-point temperature for the DHW, Eq. 2 is used:
The annual auxiliary heat is calculated as shown in Eq. 3:
To compare the economic viability of the different solar heating and electrical generation systems studied, a detailed economic assessment was conducted. This assessment accounted for the prices of both electrical and thermal energy, as well as the projected savings over the system's expected lifespan of 20 years. The goal was to evaluate the return on investment for the PVT, FP, and PV solar collectors.
The justification for this economic analysis lies in its ability to provide a comprehensive understanding of the financial feasibility of deploying solar energy systems in residential settings. By incorporating key factors such as energy prices, installation costs, and system efficiency over a significant timeframe (20 years), the analysis ensures that the economic performance of each technology is thoroughly evaluated. This approach aligns with established practices in the field, allowing for meaningful comparisons with similar studies and providing valuable insights for stakeholders considering the adoption of solar energy technologies. The focus on long-term economic benefits, despite the high initial investment costs, is essential for assessing the sustainability and practicality of these systems in real-world applications.
The annual monetary savings, 
To determine the total monetary savings over the project's lifespan, the discounted sum (RRR) was calculated using Eq. 5 (Gagliano et al., 2019a):
Cost of equipment and energy considered in this study.

In addition to these costs, the study considered two different capacities for the TEST (200 L and 300 L) across the various solar heating systems. This was done to evaluate the impact of increased hot water storage capacity on economic indicators such as energy savings, solar fraction, and overall system efficiency.
To analyze the operational behavior of the different solar heating and electricity generation technologies, the TRNSYS software (Klein, 2015) was used to simulate the energy system under the selected site's transient climatic conditions. TRNSYS is widely used in the development and study of energy systems, as it features an extensive library of models for energy generation equipment and processes in general, allowing for the creation of new models that can be incorporated into the simulation study. Since TRNSYS includes models for processing typical meteorological year (TMY) datasets, the proposed systems can be studied under expected operational conditions at the site where the energy system is intended to be developed, providing accurate and representative results.
For the simulation of the energy systems considered in this study, models of flat plate solar heating equipment (type1), crystalline photovoltaic modules (type103), pumps (type114), TEST (type158), auxiliary heaters (type122), mixing valves (type11 h), and differential controller with hysteresis (type165) were used. The PVT solar module was simulated following the methodology used in previous works (Aguilar-Jiménez et al., 2020; Gagliano et al., 2019a), combining a photovoltaic module model (type103) and a flat plate collector (type1), mutually feeding back to calculate both electrical and thermal production. The validation of this methodology can be verified in those works. The solar FP heating system and the photovoltaic system, operating independently, were developed considering the characteristics of the equipment presented in Table 1 and their technical datasheets. The mathematical models used to develop the different types employed in this simulation can be verified in the TRNSYS mathematical references (Klein et al., 2014). The explanation of the operation of the FP solar collector and the PV module are presented below.
FP solar collector (type1)
This component models the thermal performance of an FP solar collector using a standard quadratic (or linear) efficiency equation, which is presented in Eq. 6:
For the mathematical representation of the PV module, the type103 uses an empirical equivalent circuit model to predict the current-voltage characteristics of a module. The strength of the current source is dependent on solar radiation and the current-voltage characteristics of the diode are temperature-dependent. The results for a single module equivalent circuit are extrapolated to predict the performance of a multi-module array (Klein et al., 2014). The model takes into consideration the solar radiation incident on the PV module, the operating temperature and the IAM to calculate the power delivered by the PV module or array. For a detailed description of the electrical, thermal and optical model, we suggest reviewing the TRNSYS mathematical references (Klein et al., 2014).
Results
This section presents the comparative energy analysis between PVT and FP collectors, based on the solar capture area and the volume of the TEST. For the analysis, the total solar capture area was considered, as the area of the FP collector is 23% larger than that of the PVT collector. Since the variation in the volume of the TEST affects solar utilization, two storage tanks were considered for comparison: one with 200 L, which is the typical commercially available TEST volume for solar DHW, and the other with 300 L to observe the effect of increased volume on the indicators.
Thermal energy production
In Figure 4, the annual thermal energy production for PVT and FP collectors is presented as a function of the total capture area and TEST volume. When considering one collector for both technologies, it was found that the FP can generate up to 39% more thermal energy per year compared to the PVT. This is primarily due to the larger solar capture area and higher solar thermal efficiency of the FP. When comparing thermal energy production based on the capture area, an FP collector produces 12% more energy per year than the PVT, with 937.6 kWh/m2, while the latter produces 834.1 kWh/m2.

Annual thermal energy production as a function of collector area and TEST volume.
Increasing from one to two collectors for each technology (PVT and FP) and considering a 200 L TEST, the increases in thermal energy production are 48% and 47%, respectively. As the solar capture area increases and the TEST volume remains constant, the increase in thermal energy production is not linear. Increasing from two to three collectors (a 50% larger capture area), the annual thermal energy increase is 12% and 17% for FP and PVT collectors, respectively, while increasing from four to five collectors results in increases of only 2% and 6%, respectively.
Increasing the TEST volume from 200 L to 300 L benefits the thermal energy production for both types of collectors. This is because having a larger mass of water available for heat storage allows for a greater amount of solar thermal energy to be supplied to the demand, resulting in a lower operating temperature of the solar circuit and improving solar-thermal conversion efficiency. However, the benefit of increasing the TEST volume from 200 L to 300 L is only significant for capture areas greater than 5.5 m2 for PVT collectors and 7 m2 for FP collectors, as heat losses occur with a 200 L volume, which can be stored with the 300 L TEST.
To meet the thermal energy demand of the case study, 1641 kWh per year are required, as mentioned earlier. Considering the thermal energy production from Figure 4, it can be seen that the annual heat demand is exceeded by 33% with a single FP collector, and only 4.4% of heat would be missing with a single PVT collector. However, due to the nature of solar thermal energy and hot water consumption patterns, there are times when hot water demands do not coincide with solar heating. In our case study, the highest demands occur in the mornings and evenings, which do not align with the necessary generation of solar thermal energy. Therefore, it is essential to use TEST to store thermal energy when the solar resource is available, so it can be used during times when demand is present but solar contribution is absent. However, this process results in heat losses because storing hot water leads to heat transfer to the environment due to the temperature difference, which represents a loss of solar energy. The amount of energy lost depends on the number of collectors, the volume of the TEST, climatic conditions, and the DHW profile.
To contextualize the thermal energy production of both technologies and their contribution to the DHW demand, Figure 5 shows the solar fraction. It can be seen that, despite a single FP collector producing 33% more than the annual energy required for DHW, the resulting solar fraction is 0.81, necessitating the auxiliary system to supply the remaining 19% of the energy. Similarly, a single PVT collector achieves a solar fraction of 0.62, despite producing 95.6% of the heat demand.

Solar fraction as a function of collector area and TEST volume.
When the solar capture area is doubled, there are increases in the solar fraction to 0.96 and 0.84, equivalent to percentage increases of 17.3% and 34.6% for FP and PVT collectors, respectively. Further increases in the solar capture area for the FP technology are not significant in improving the solar fraction, as nearly the entire heat demand for DHW (96%) is met by two FP collectors. However, to achieve the same solar fraction with PVT collectors, more than double the solar capture area and a 300 L TEST are required. The analysis of the solar fraction helps quantify the actual solar energy contribution from the solar collectors. However, the final number of collectors to be used should be based on a technical and economic analysis.
In Figure 6, the auxiliary energy requirements to meet the DHW demand are presented as a function of the solar capture area and the TEST volume. Notably, when using a PVT and an FP collector, the PVT requires 103% more auxiliary thermal energy than the FP, regardless of the TEST volume. This difference in auxiliary heat requirement tends to decrease as the number of collectors increases, with a reduction of 57% and 76% in auxiliary energy when increasing from one to two PVT and FP collectors, respectively, considering a 200 L TEST.
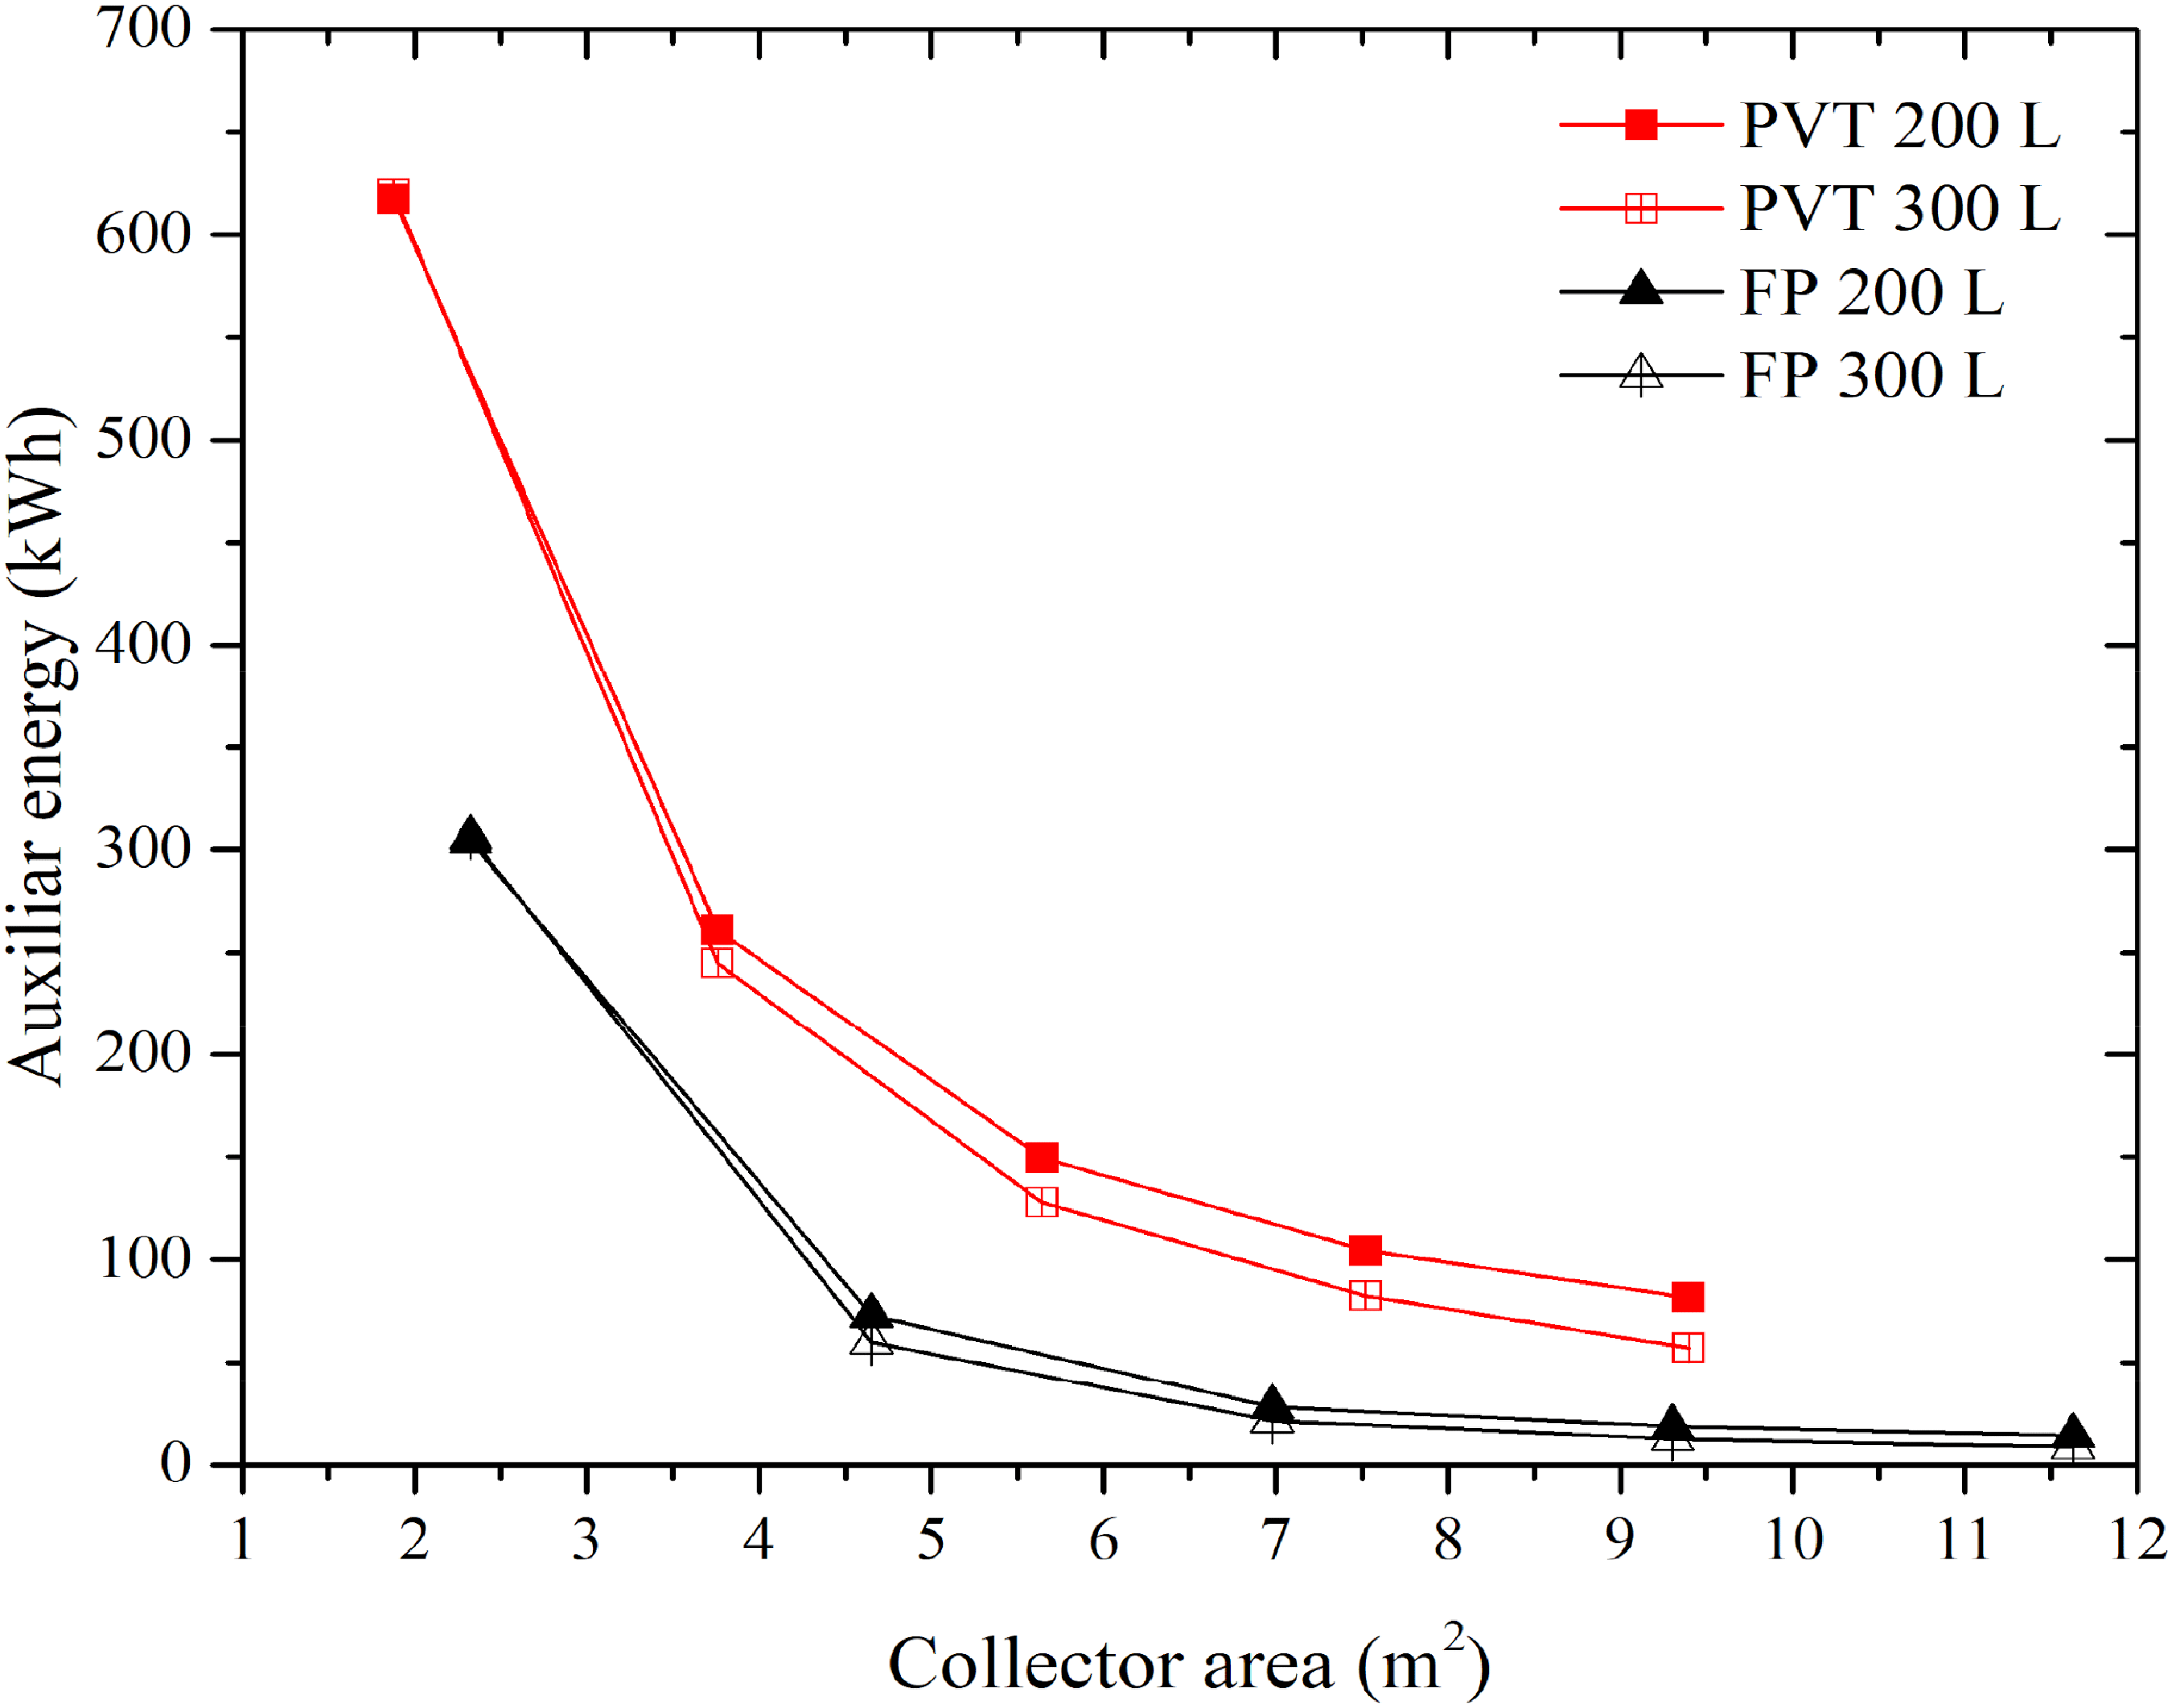
Auxiliary energy requirements to meet DHW demand, based on solar collector area and TEST volume.
Increasing the TEST volume tends to reduce the auxiliary energy requirement with the use of two or more collectors for both technologies, with a greater reduction for the PVT. This is because, with a single collector, most of the generated heat is used to meet the demand, leaving no energy for storage. When the number of collectors increases, excess heat is generated, which can be stored in a larger TEST to be used during periods of low or no solar radiation. However, the reduction in auxiliary energy when increasing the TEST volume to 300 L shows maximum values of 25 kWh, equivalent to 1.5% of the total DHW demand (1641 kWh), when using five PVT collectors. The percentage reduction is even smaller for FP collectors, with a maximum reduction of 13 kWh when using two collectors, equivalent to 0.8% of the total DHW demand.
A comparison was made of the annual PV electrical energy production by PVT collectors with different TEST volumes and PV modules, based on the photovoltaic capture area. This can be visualized in Figure 7. Photovoltaic conversion efficiency tends to decrease as the operating temperature of the PV cell increases. This is the main factor why PVT technology tends to generate less electrical energy based on the capture area as the number of collectors increases.

Comparison of annual PV electrical energy production as a function of the catchment area for PVT collectors and PV modules separately.
When the capture area of PVT collectors increases, the operating temperature of the solar heating circuit also increases, resulting in a higher operating temperature of the cell in this technology compared to PV modules operating independently, leading to lower electrical production. A PV module produces 9.7% more electrical energy than a PVT collector. As the capture area increases, PV modules produce up to 350 kWh/m2, while PVTs produce a maximum of 287 kWh/m2, 22% more annual energy per square meter.
It is noteworthy that the TEST volume does not have a significant impact on the electrical energy production of PVT collectors, with maximum increases of 0.77% when having a 300 L tank compared to a 200 L tank. This is because a larger tank volume slightly reduces the operating temperature of the water heating system, increasing conversion efficiency, but not significantly.
In Figure 8, the global specific energy production (thermal and electrical) per square meter of capture area is shown as a function of the number of PVT and FP collectors with PV, with TEST volumes of 200 and 300 L. This comparison allows for analyzing the combined thermal and electrical production per square meter of installed solar capture area, unlike the previous results that discussed thermal and electrical energy separately.
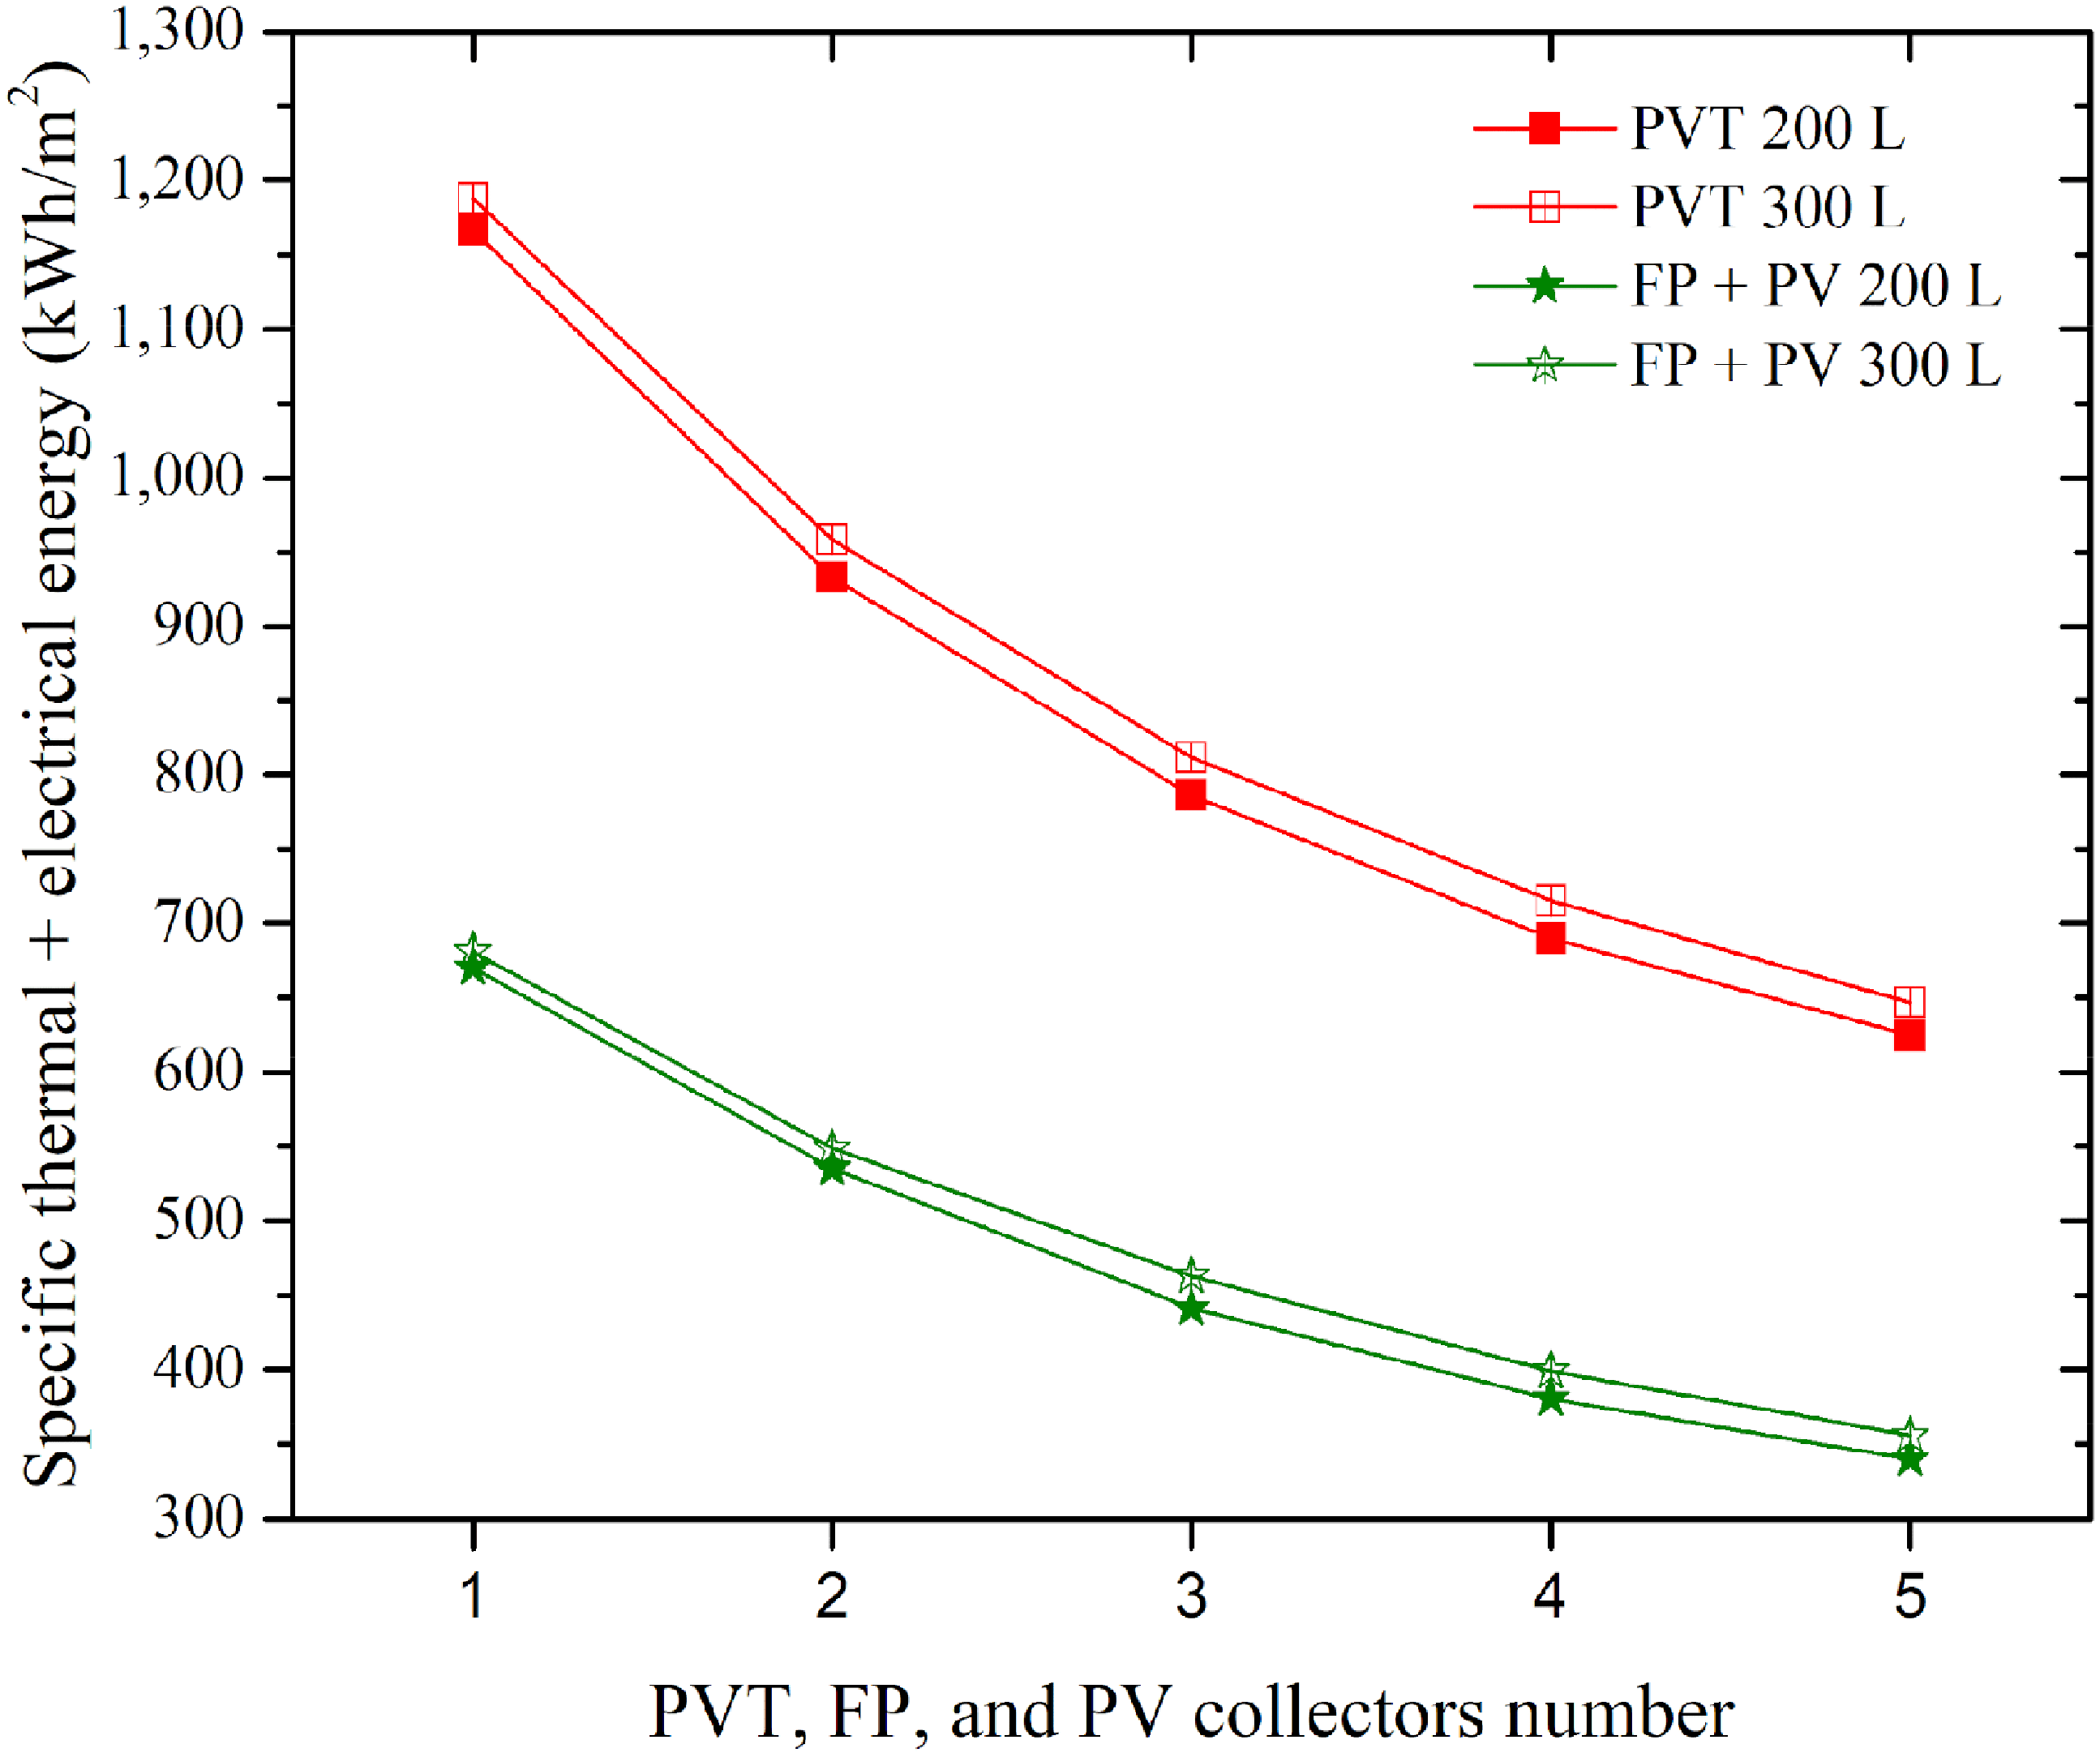
Overall annual specific energy production (thermal and electrical) per square meter of collector as a function of the number of PVT and FP collectors with PV, considering TEST of 200 and 300 L.
It can be seen that the PVT technology, when using one collector and a 200 L TEST, presents an annual global specific energy production of 1166 kWh/m2 (approximately 60% thermal energy), 74% more global energy per square meter than a system with one FP collector and one PV module. As the number of collectors increases, the global energy production per square meter tends to decrease for all technologies. For PVT and FP technology, this is due to the impact on thermal and electrical energy production caused by the increase in the system's operating temperature, while PV modules are not affected.
When considering a 300 L TEST, an increase in global specific production is observed for both comparisons. For the PVT system, average increases of 3% are seen depending on the number of collectors, while for the FP and PV combination, average increases of 3.7% are observed.
To compare the economic feasibility of the different systems studied, Table 3 shows the investment costs and economic recovery of PVT, FP, and FP + PV technologies, with TEST volumes of 200 and 300 L. The comparison considers the equipment and energy costs presented in Table 2, as well as a system lifespan of 20 years, so the revenue is the total over that period.
Comparison of investment costs and economic recovery over the life of the project in USD.

Comparison of investment costs and economic recovery over the life of the project in USD.
Notably, with PVT technology, both with 200 L and 300 L TEST, the revenue never exceeds the investment costs. The low cost of thermal and electrical energy is one of the main factors why there is no return on investment. Additionally, the high cost of the hydraulic and electrical installation of PVT systems further increases the investment cost. Another factor impacting the return on investment is the low thermal energy demand for DHW, which prevents nominal use of the solar installation for much of the year.
From an economic perspective, the high initial costs of PVT and FP technologies, along with the associated installation and maintenance costs, represent a significant challenge. Although these systems can offer economic benefits in regions with high thermal and electrical energy costs, the case study demonstrates that no significant economic benefit is achieved during the project's lifetime. For the PVT technology, over the 20-year lifespan considered in this study, the returns on initial investment reach up to 79% and 75% in the best-case scenario, with TEST volumes of 200 L and 300 L, respectively. When services are provided separately using FP and PV technologies, returns of up to 121% and 115% of the initial investment are achieved with TEST volumes of 200 L and 300 L, respectively. For the FP technology alone, returns of up to 26% and 22% of the initial investment are achieved with TEST volumes of 200 L and 300 L, respectively.
Similarly, for the FP + PV combination, although there is a return on investment from a system with 3 FP collectors and 3 PV modules, both for 200 L and 300 L TEST, this return occurs after 18 and 20 years of operation, respectively, which is not economically attractive. The same factors affecting PVT systems contribute to this result. For standalone FP collectors, the high initial investment costs combined with the low cost of thermal energy in the case study prevent economic recovery.
The obtained results indicate that when analyzing energy production, solar fraction, and auxiliary energy requirements, the thermal and electrical generation systems using separate collectors and modules perform better compared to hybrid PVT collector systems. However, when comparing these technologies in terms of specific global energy efficiency, PVT collectors prove to be competitive against energy generation with separate equipment. This is mainly due to the utilization of the capture area; using the same surface area for simultaneous thermal and electrical energy generation achieves up to 74% more energy utilization per square meter of installation.
In the domestic sector context, where available space for such installations may be very limited, PVT technology offers an efficient solution for generating both types of energy. However, in scenarios where area availability is not an issue, energy generation using separate equipment remains the most attractive option.
Incorporating the economic analysis significantly changes the perspective on technical feasibility. Currently, the costs associated with PVT technologies and FP collectors, along with installation and maintenance costs, represent significant challenges. The initial investments for such projects are high compared to their economic benefits. Unlike the installation costs of PV systems, solar heating systems tend to be more expensive due to the complexity of the hydraulic installation, increasing the total project cost.
In scenarios where thermal and electrical energy costs in the domestic sector are high, the economic viability of these projects improves, partially offsetting the high initial investment cost. However, in the case study, with thermal and electrical energy costs of $0.0191 and $0.1 USD/kWh, respectively, an economic benefit is not achieved during the project's lifespan.
The ambient temperature conditions in the case study region result in a low amount of thermal energy required to meet the DHW demand. This leads to achieving solar fractions of 0.62 and 0.81 with a single PVT collector and an FP collector, respectively. A higher DHW demand would improve the utilization of the solar energy installation. However, it is important to highlight that a PVT collector generates 95.6% of the energy required for DHW in the case study, while an FP collector exceeds the 1641 kWh needed annually by 33%. The main issue is that the hourly DHW demand does not coincide with solar generation, necessitating the use of a TEST to store the excess heat. Nevertheless, the cost of the TEST is one of the main expenses in such projects, significantly impacting their economic viability.
When comparing the results of this study with those from other research, it is consistent that the greatest economic benefit is achieved when the photovoltaic system operates independently, due to the lower installation costs compared to PVT technology (Gagliano et al., 2019a). Similarly, the findings of this study, as well as those of other authors, indicate that the negative economic outcomes of PVT technologies in the domestic sector are primarily due to low energy costs (Gagliano et al., 2019a), which prevent the recovery of the initial investment within a reasonable timeframe.
Conclusion
This study evaluated the technical and economic viability of PVT collector systems compared to separate thermal and electrical generation systems. The results indicate that although separate systems offer better performance in terms of energy production, solar fraction, and auxiliary energy requirements, PVT collectors are a competitive option in terms of overall specific energy efficiency, particularly in applications where available space is limited.
The efficiency of PVT systems is highlighted by their ability to maximize the utilization of the capture area, achieving up to 74% more energy utilization per square meter compared to separate systems. This makes them an attractive solution for the domestic sector, where space is often a significant constraint. However, in scenarios where the availability of area is not an issue, separate energy generation remains the most efficient option. Using a single PVT collector achieves a solar fraction of 0.62, while an FP collector reaches 0.81. When two collectors are considered, the solar fractions increase to 0.96 and 0.84, corresponding to percentage increases of 17.3% and 34.6% for FP and PVT collectors, respectively. The solar fraction analysis indicates that a small number of collectors is sufficient to meet the DHW demand, suggesting that the available installation area would not be a primary factor in choosing this technology under these conditions.
From an economic perspective, the high initial costs of PVT and FP technologies, along with the associated installation and maintenance costs, represent a significant challenge. Although these systems can offer economic benefits in regions and sectors with high thermal and electrical energy costs, as the commercial and industrial sector with the highest possible thermal energy demand during the longest possible time of the year. The case study demonstrates that no significant economic benefit is achieved during the project's lifetime in this scenario in DHW. In the best scenarios, the returns on initial investment during the project's lifespan are 79%, 121%, and 26% for PVT, FP + PV, and FP technologies, respectively, considering a 200 L TEST volume. It was identified that reducing installation expenses is a critical factor for the economic feasibility of PVT technology. Therefore, efforts should focus on reducing material costs and developing accessories that facilitate rapid installation, thereby reducing the time required for specialized labor.
Additionally, climatic conditions and DHW demand affect the efficiency of the systems. The discrepancy between solar energy generation and hourly DHW demand necessitates the implementation of TEST, which significantly increases costs and impacts the economic viability of the project. Opportunities to improve the technical and economic feasibility of these technologies are directed towards their adaptability in extreme climates and low thermal energy demands, as presented in the case study. While PVT systems offer an innovative and efficient solution for the simultaneous generation of thermal and electrical energy, their large-scale adoption is conditioned by space availability and economic considerations. Future research and technological developments that reduce installation costs and improve thermal storage efficiency could enhance the viability of PVT systems, making this technology an even more competitive option in the renewable energy field.
Footnotes
Declaration of conflicting interests
The authors declared no potential conflicts of interest with respect to the research, authorship, and/or publication of this article.
Funding
The authors received no financial support for the research, authorship, and/or publication of this article.