
Abstract
The health condition monitoring of harmonic drives plays an important role in ensuring the rotational motion accuracy of robot or manipulator joints. Capitalizing on the periodic and repetitive nature of manipulator tasks, a novel on-line data-driven evaluation method is developed in this paper, which employs a One-Dimensional Convolutional Neural Network (1D-CNN) and Hidden Markov Model (HMM) to classify static transmission errors of harmonic drives based on the current and torque data of their driving motors. The 1D-CNN encodes multiple dimensional data including numerical features, Wavelet Packet Energy Entropy (WPEE) values, and marginal spectrums of the current and torque data. Then, based on these features, the HMMs under different transmission error levels are trained. In order to demonstrate this method, a test rig is developed, in which the load moves in a reciprocating motion as an inverted pendulum. The load is driven by the servo motor and the harmonic drive. The experimental results show that the proposed evaluation method can identify six distinct levels of static transmission errors in harmonic drives with an accuracy greater than 91% in this study. The presented research holds potential for the development of a Prognostics and Health Management (PHM) system for robots.
Keywords
Introduction
In recent decades, there has been a significant increase in the use of industrial robots or manipulators, leading to a rise in the automation levels of manufacturing industries in several countries. This trend has resulted in improved labor productivity and product quality. Among the most critical components of manipulators are joint reducers. Currently, the most commonly used joint reducers for industrial robots are harmonic drives and Rotary Vector (RV) reducers. Compared with other types of reducers, harmonic drives and RV reducers have several advantages, including high load-carrying capacity, high transmission accuracy, smooth operation, light weight, and easy installation. These features make them suitable for multi-axis manipulators that require high precision movements or positioning. The proper functioning of reducers is crucial for performance of manipulators. Mechanical failures of joint reducers can result in longer repair times of manipulators compared with electrical failures, and may even cause forced outages and significant losses. The harmonic drive, invented in the late 1950s, 1 has proved successful in several fields such as robotics, aviation, aerospace, bionic machinery, and precision machines.
In most of industrial robots or manipulators, robot joints usually adopt a semi-closed loop control mode, and the harmonic drive of each joint is connected with the output shaft of the driving motor. The output angle of the harmonic drive is not measured directly. The joint is typically composed of the driving motor, the reducer, and the joint arm. Despite their popularity, harmonic drives suffer from two primary operational drawbacks: high friction and low stiffness. 2 The transmission error of the joint harmonic drive is a nonlinear factor that affects the motion control accuracy of the robot end effector.3–5 Liu et al. 6 found that the transmission error of the robot joint harmonic drive is mainly affected by the dimensional error of the internal transmission parts and the clearance between these parts. Dong et al. 7 developed an equivalent mechanism in kinematics of harmonic drives in order to find the transmission error effects on the kinematic accuracy of harmonic drives. Gravagno et al. 8 evaluated the pure kinematic error of harmonic drives quantitatively for the different working modes, which may be useful for the designing of conjugate profile teeth. Hu et al. 9 developed a model including static transmission errors and dynamic transmission errors of a harmonic drive. They also proposed an interval method to represent uncertain dynamic parameters of the harmonic drive. On the other hand, the structure optimization of harmonic drives is also discussed in the literature in order to reduce the effect of tooth surface wear on the accuracy and efficiency of the gearing. Bo 10 analyzed the deformation and force of the flexible wheel by the empirical formula of harmonic transmission, and developed a model of the meshing and the wear between the flexible wheel teeth and the rigid wheel teeth of the harmonic gear according to the theory of boundary elements. Based on the calculation results of the established wear model, he found that the top of the teeth of the harmonic gear is the most severely worn part. Wang et al. 11 considered that the wear is a random process, and they established the reliability model of the harmonic drive by using the transmission error and the backlash as the failure criterion. Li and Hao 12 developed an accurate mathematical model of harmonic drive backlash, and calculate the sensitivities of different influencing parameters based on the model. The study of Chen et al. 13 showed that the cyclic deformation of the flex wheel has an effect on the side clearance of the flex wheel, and the meshing of the flex wheel with the rigid wheel may cause interference phenomena. Li et al. 14 focused on a performance margin modeling and reliability analysis of harmonic drives with the consideration of the multi-source uncertainties and wear. Kayabasi and Erzincanli 15 analyzed the flexspline teeth of the harmonic drive by the simulation based on the finite element modeling method. According to the deformation and stress analysis results of the flexspline teeth, they optimized the shape of the flexspline teeth. Xin 16 developed a double-arc tooth-shaped harmonic gear based on an elliptical cam, in which the contact force of the flexspline teeth can be optimized and the torsional rigidity of the flexible wheel have also been improved. Additionally, the lubrication effect on the health of harmonic drives has also been explored in the literature. Li 17 analyzed the transmission performance of the harmonic drive with solid lubrication and grease lubrication based on the range calculation method of the orthogonal experiment. The results show that the transmission performance of the solid lubrication is better. Xia et al. 18 and Li et al. 19 analyzed the failure mechanism of harmonic drives, and found that there is a relationship between lubrication conditions and their performance. Yamamoto et al. 20 developed a novel modeling and compensation method for the transmission error in harmonic drives. In their modeling, physical phenomena of the transmission error due to nonlinear elastic deformations in micro-displacement region and the synchronous component are included.
As shown above, almost all of the existing research results on transmission errors of harmonic drives focus on the analysis and modeling of dynamic and static transmission errors, and the reduction of their transmission errors by structural optimization. It is also important to analyze the health condition of harmonic drives based on on-line monitored data. Thus, the reliability and accuracy of precision equipment using harmonic drives could be ensured. In the literature, few fault diagnosis methods of harmonic drives were developed by monitoring their vibration. For example, it is found in the studies21–23 that the fault diagnosis of input shaft eccentricity could be done according to the frequency analysis of vibration signals of harmonic drives. Kuo et al. 24 proposed an anomaly detection model in order to detect the gear-failure problem of a harmonic drive based on the sound recorded by a microphone. In their study, the sound samples are de-noised by the multi-layer discrete wavelet transform, and the Log Mel spectrogram and the EfficientNetV2 network were used for feature extraction and feature classification, respectively. Zhao et al. 25 developed a harmonic reducer performance prediction algorithm based on the Multivariate State Estimation Technique (MSET) and the LargeVis dimensionality reduction method. And its strong ability to predict the degradation trend of the harmonic reducer was demonstrated by an experiment. These studies may be useful references for developing new fault diagnosis methods of harmonic drives.
Research on fault diagnosis methods for other systems has obtained a large number of results, and a number of review or regular papers have been published. Safaeipour et al. 26 presented a review about data-driven and model-based fault diagnosis approaches for nonlinear closed-loop and open-loop systems. Lei et al. 27 published a survey that systematically covers Intelligent Fault Diagnosis (IFD) based on traditional machine learning methods and deep learning methods, and they also offered the roadmap and the future perspective of this topic in the study. Zhang et al. 28 reviewed the results on IFD with small and imbalanced data, also discussing some future perspectives of this area. In their paper, the IFD methods are classified into three categories: the data augmentation-based, the feature learning-based, and the classifier design-based. Currently, fault diagnosis methods based on machine learning and deep learning have become a hot spot in this research area. Park et al. 29 proposed an Instantaneous current residual map (ICRM) for CNN-based fault diagnosis, and this ICRM effectiveness is validated based on the fault diagnosis of a PMSM in their study. Zuo et al. 30 developed a multi-layer Spiking Neural Network (SNN) for bearing fault diagnosis based on the Probabilistic Spiking Response Model (PSRM), which is biologically transparent for the fault patterns. In order to reduce untrustworthy of fault diagnosis caused by domain shift, Zhou et al. 31 developed a novel uncertainty-aware machine fault diagnosis method based on a probabilistic Bayesian deep learning framework. By aligning both marginal and class-conditional distributions for adaptability, Lee et al. 32 described a new unsupervised domain adaptation based fault diagnosis method. Obviously, research on fault diagnosis methods has obtained great achievement in the past decades. However, there is limited research on fault diagnosis of harmonic drives. Yang et al. 33 proposed an intelligent approach for identifying different health conditions of harmonic drives, in which the multiscale Convolutional Neural Network (CNN) is used for implementing feature extraction and classification of the harmonic drive vibration signal. The conditions of harmonic drives includes only two types: normal and abnormal in Yang et al. 33 Aiming to identify the fault type of the harmonic drive under different working conditions, Zhi et al. 34 proposed the Convolutional Neural Network-Long Short Term Memory (CNN-LSTM) fault detection method in order to identify the fault types of harmonic drives under different working conditions. However, on-line data-driven transmission error evaluation methods of harmonic drives are not reported in the literature.
As addressed above, the existing research results about harmonic drives are limited to transmission error resources and modeling,3–9 failure analysis and structure optimization,10–19 and very few research papers33,34 on the fault diagnosis of harmonic drives are presented although a large number of fault diagnosis methods have been reported for other systems or machines.26–32 By monitoring the conditions of harmonic drives during their use, it is possible to evaluate their health or deterioration levels. Thus, the reliability levels of the robots or other systems including the monitored harmonic drives can be improved, and the forced outage of the robots may be avoided. According to the periodicity and repeatability of robot tasks, the authors in this paper developed a on-line data-driven evaluation method of the static transmission ratio error based on One-dimensional Convolutional Neural Network (1D-CNN) and Hidden Markov Model (HMM) for harmonic drives, in which the monitored data of current and torque of the diving motors are utilized.
The rest of this paper is described as follows. The structure of harmonic drive and the issue of transmission errors are given in Section “Materials and methods”. In this section, the designed on-line data-driven evaluation method of the static transmission error of harmonic drives is also introduced in detail. The results and discussions are given in Section “Materials and methods”, and conclusion finally.
Materials and methods
Structure analysis of harmonic drives
Harmonic drives are often used in the joints of various robots, particularly in the industrial robot joints with small loads. The typical structure of a harmonic drive is consists of a wave generator, a flex spline (a flexible wheel) and a circular spline (a rigid wheel). 21 Undoubtedly, the wear of the flexible wheel teeth affects the harmonic drive transmission performance.
Harmonic drives have different mechanical interfaces with driving motors and loads. The fully enclosed harmonic drive with an output shaft is designed with internal support bearings, making it easy to install for timing belt drives. The flexible wheel of the harmonic drive with the standard type has a cup-shaped cylinder structure, and the input shaft of the drive motor fits directly into the wave generator bore through a flat key. For the standard type of the harmonic drive, the rigid wheel is fixed and the flexible wheel is used as the output end. The harmonic drive with a hollow output shaft has a more compact structure with a large-diameter and hollow wave generator. The crossed roller bearing is used in such a harmonic drive, and this allows larger radial and axial forces when it works.
The working of harmonic drives is based on the elastic deformation of the flexible wheel. The wave generator that is usually attached to the input shaft is a type of a thin-raced bearing fitted onto an elliptical cam. The bearing inner ring is fixed around the cam. Thus, the outer ring can rotate with the same elliptical shape. As a result, the flexible wheel is forced into an elliptical shape by the wave generator. This makes the teeth of the flexible wheel engage with the tooth profile of the rigid wheel along the major axis of the ellipse. Because the flexible wheel has fewer teeth than the rigid wheel, the harmonic drive can obtain a large transmission ratio.
The harmonic drive is a highly precise transmission system. The main causes of its failure include fatigue fracture of the flexible wheel, damage to the bearing of the input shaft, wear of the tooth surface of both the rigid and flexible wheels, and teeth slipping. Among them, tooth wear can reduce the transmission accuracy and accelerate the deterioration of the harmonic drive. One of the main consequences of a reduction in transmission accuracy is a change in the transmission ratio. When manufacturing a harmonic drive, a qualified range of transmission ratio errors is given. If the transmission ratio error is too large and exceeds the limit, the harmonic drive can be considered to have failed. Therefore, the authors propose an on-line data-driven method based on 1D-CNN and HMM to evaluate the static transmission error levels of harmonic drives by utilizing current and torque data from their driving motors.
Design of static transmission error evaluation method of harmonic drive
Currently, industrial robots or manipulators are primarily used for simple tasks such as welding, handling, loading and unloading, and painting, which are accomplished through programming by teaching. These tasks are repetitive and periodic, leading to the repetitive and periodic movement of joint reducers and current/torque signals of driving motors. Based on these characteristics of repetitiveness and periodicity, this study proposes an on-line data-driven method for evaluating static transmission errors of harmonic drives, by using the 1D-CNN and the HMM. The static transmission error is incurred by manufacturing errors, assembly errors, and wear of the components of harmonic drives, leading to deviation of the actual meshing engagement point from the theoretical engagement point. 9 While the dynamic transmission error is essentially the dynamic response of the dynamic model of a harmonic drive. The following section outlines the proposed method for evaluating static transmission errors in harmonic drives.
Evaluation steps of transmission error of harmonic drive
By utilizing monitored data of current and torque of diving motors, the proposed data-driven transmission ratio evaluation method of harmonic drives based on 1D-CNN and HMM includes the following steps, which is summarized as Figure 1:
(1) Data denoising and preprocessing. During data acquisition, noise may be coupled during sampling and transmission. Therefore, the wavelet threshold denoising and filtering method is used for the obtained monitoring data. The ratio data of the current of the driving motor to the motor output torque is filtered in this step. Then, the statistical features (including the Root Mean Square (RMS) value, the mean value, the kurtosis, and the skewness), the Wavelet Packet Energy Entropy (WPEE) values, and the marginal spectrum of the motor current are calculated for the data of each motion period.
(2) Training of fusion coding model. For the different types of monitored data of the driving motor, including the current and torque signals and their statistical features, the fusion coding is implemented by the 1D-CNN model. However, the 1D-CNN model should be firstly optimized as addressed in this section.
(3) HMM training. The fusion coding results are used as the input of the HMM, and the HMM is trained and the state transmission matrix is derived. The HMM with the most probable observation sequence is finally determined by the cross-validation of the samples.
(4) Result output. Based on the trained 1D-CNN model and the trained HMM, the fusion coding results of the driving motor monitoring data are used as the input of the HMM, and the logarithmic probability values are calculated by the HMM of each transmission error level. Then, the transmission error level of the harmonic drive is obtained according to the obtained logarithmic probabilities, and the classification of the transmission error level of the robot harmonic drive is obtained.

Steps of transmission ratio evaluation of harmonic drives based on 1D-CNN and HMM.
In Step (1) above, the used numerical features of the data can characterize the data. The skewness index of the data shows the direction of data skewness, which is a good representation of the symmetry degree of the data distribution; the kurtosis index of the data is a dimensionless parameter, which is sensitive to shocks in the data. Additionally, the WPEE can reflect the equipment condition change during its operation, and the wavelet packet energy changes in different frequency bands can characterize the different operating states of the equipment. 35 Therefore, the WPEE is also selected for feature extraction of monitored data in terms of driving motors of harmonic drives, and in this study the designed computation steps of the WPEE are as follows:
(a) Based on the frequency range of the monitored data, the basic functions are selected for the three-layer wavelet packet decomposition, and different eight frequency bands are obtained.
(b) The energies of the monitored signals are calculated by reconstructing their single-wavelet signals for the eight different frequency bands mentioned above, separately. The energy Ej of the j-th frequency band is given as follows:

where xj, k is the wavelet coefficient of the j-th frequency band of the k-th layer wavelet decomposition, j = 0, 1, … , 7, and k = 0, 1, 2. Wavelet decomposition breaks down the monitored signal into different frequency bands, applying a series of high-pass and low-pass filters to the signal and decomposing it into various layers of frequency components. Each layer of decomposition corresponds to a specific frequency band, capturing different details of the current/torque signal. These coefficients xj, k capture the amplitude of the signal components within the specific frequency band and layer.
(c) The obtained energy of each frequency band Ej is normalized according to the following equation to obtain the normalized WPEE vector [

where pi is the i-th normalized WPEE value, and i = 0, 1, 2, … , 7.
(d) Calculate eight WPEEs Qi (i = 0, 1, … , 7) from low to high frequency bands according to the following equation, and derive the WPEE vector [

Multi-scale analysis of signals could be performed by the WPEE method based on the Wavelet Transform theory, and the WPEE vector is useful for identifying equipment conditions. Therefore, the WPEE method is used as one of the methods of calculating the features of the monitored data in this study.
In Steps (2) and (3) above, the training of the 1D-CNN model and the HMMs is only implemented during model training. After training, the 1D-CNN model and the HMMs are used for fusion coding and feature classification, respectively.
One-dimensional Convolutional Neural Network model for monitoring data of driving motors
In this study, the obtained multiple-dimensional features including the statistical features, the WPEE, and the marginal spectrum of current and torque signals of the driving motor, are input into the 1D-CNN for fusion coding and reducing dimensions in order to implement on-line evaluation of transmission errors of harmonic drives. The WPEE is described as the last subsection.
The 1D-CNN model used in the proposed evaluation method of static transmission error of harmonic drives is shown in Figure 2. The training scheme of the 1D-CNN feature extraction model contains two parts: encoding and decoding, shown in Figure 3.

Structure of 1D-CNN feature extraction model.

Training scheme of 1D-CNN feature extraction model.
The encoding based on 1D-CNN is a kind of auto-encoding processes. The encoder is mainly composed of two one-dimensional convolution layers and two full connection layers. The pooling layer between convolution layers reduces the dimensionality of the output features.
The structure of the decoder is basically symmetrical with that of the encoder. The decoding is realized by two full connection layers and two convolution layers of the decoder. Among them, the convolution layer uses the upper sampling layer to supplement the dimensionality reduction features after pooling during the coding process. After the encoder reduces the dimensionality of the high-dimensional features of the input, the decoder reversely encodes the extracted low-dimensional feature vector and restores it to the original high-dimensional features. Therefore, the performance of the 1D-CNN encoder could be evaluated based on the similarity between the original features and the re-encoder features, and the encoder could be obtained. For example, the third layer of the encoder model is the first convolutional layer during the encoding. After the sampling of the former layer, the convolution of this third layer input and the convolution kernel is implemented based on the same padding mode. Then, after adding the biases, the convolution result is input into the Tanh activation function. In this study, the Tanh activation function is added to the convolution layer in the feature extraction 1D-CNN model.
Thus, the whole data set are encoded by the data fusion coding of 1D-CNN model, and each group of high-dimensional data is compressed into a low-dimensional feature vector. Then, the low-dimensional feature vector can be input into the HMM in order to classify the transmission error of the harmonic drive.
Hidden Markov Model
In this paper, an HMM is used for classifying the transmission error of the harmonic drive after the low-dimensional feature vector is derived based on the 1D-CNN above. It is introduced briefly as follows.
Markov Process is one of the most famous random processes, which could be represented as {

Then,


where
The Hidden Markov Model (HMM) is an extension of the Markov Chain. It contains the random process of state transition among internal hidden states, as well as the corresponding probability relationship between observation sequence and hidden states. The observation sequence reflects the hidden states with certain probabilities, and there is a Markov Process among hidden states.
As shown Figure 4, an HMM could be expressed as follows:

where:
N is the set number of hidden states
M is the set number of observed states
A is the transition probability matrix of hidden states
B is the observation likelihood matrix

A typical structure of Hidden Markov Model.
When applying the HMM, the involved three problems including the computation of observation likelihood, the model decoding, and the identification of model parameters, are shown as follows:
(1) Computation of observation likelihood. Given an HMM
(2) Model decoding. If the model parameters of the HMM
(3) Identification of model parameters. Given the observation sequence
For the second problem above, that is, the model decoding, the most common algorithms are the Viterbi algorithm 36 and the Baum–Welch algorithm. 37 In this paper, the Baum–Welch algorithm as a special Expectation Maximization (EM) algorithm is selected for the HMM decoding, described as follows.
For an HMM of equipment deterioration, the evaluation of the unknown model parameters is the key to solve the modeling or classification problem. The Baum–Welch algorithm is an algorithm for optimizing the likelihood function, evaluating the model parameters of HMM based on the known observation sequence. In the Baum–Welch algorithm, starting with some random guess
The Baum-Welch algorithm makes use of the forward-backward method to calculate the probability

Then, calculate the probability of observing the state

After inputting the random guess


where
Performance evaluation of data-driven transmission ratio evaluation method
In this study, the Macro-averaging, the Kappa coefficient, the Hamming loss are used for evaluating the performance of the proposed data-driven transmission ratio evaluation method. The Macro-averaging can calculate the average of the precision rate and the recall rate of the evaluation method on different transmission error levels. The Kappa coefficient indicates the consistency between the identified category and the real one. The closer the Macro averaging result and the Kappa coefficient are to 1, the better the result is. The Hamming loss is the fraction of the incorrect labels to the total number of labels, focusing on the misclassified data. The smaller the Hamming loss, the better the evaluation result. Their calculations are given as follows.
Macro-averaging:

where n is the classification number of transmission errors, Pi is the i-th classification of precision ratios, and Ri is the i-th classification of recall ratios.
Kappa coefficient:

where po is the observed level of agreement, pe is the expected level of agreement.
Hamming loss:

where xi and yi are the derived label and the real label (i = 1, 2, … , D), D is the total sample number, L is the number of transmission ratio levels, and XOR is the Boolean exclusive or operator.
Besides the three coefficients above, the accuracy is also used as a performance metric in this study, which is defined as the ratio of the number of correctly classified samples to the total number of samples.
Results and discussion
Measurement of static transmission errors of harmonic drives
There are 10 used harmonic drives with the same type available in this study. Before the model training based on the 1D-CNN and the HMM, the transmission errors of these harmonic drives should be measured firstly. Considering the high transmission accuracy of harmonic drives, a Coordinate Measuring Machine (CMM) is used for measuring the position and the pose of the rod fixed with the output shaft of the harmonic drive. Three standard spheres with the diameter 12 mm are fixed to the rod. Thus, the position and the pose of the rod can be calculated by measuring the center positions of the three spheres with the application of the CMM. The measuring scheme is shown in Figure 5, in which the harmonic drives are fixed to the table of the CMM.
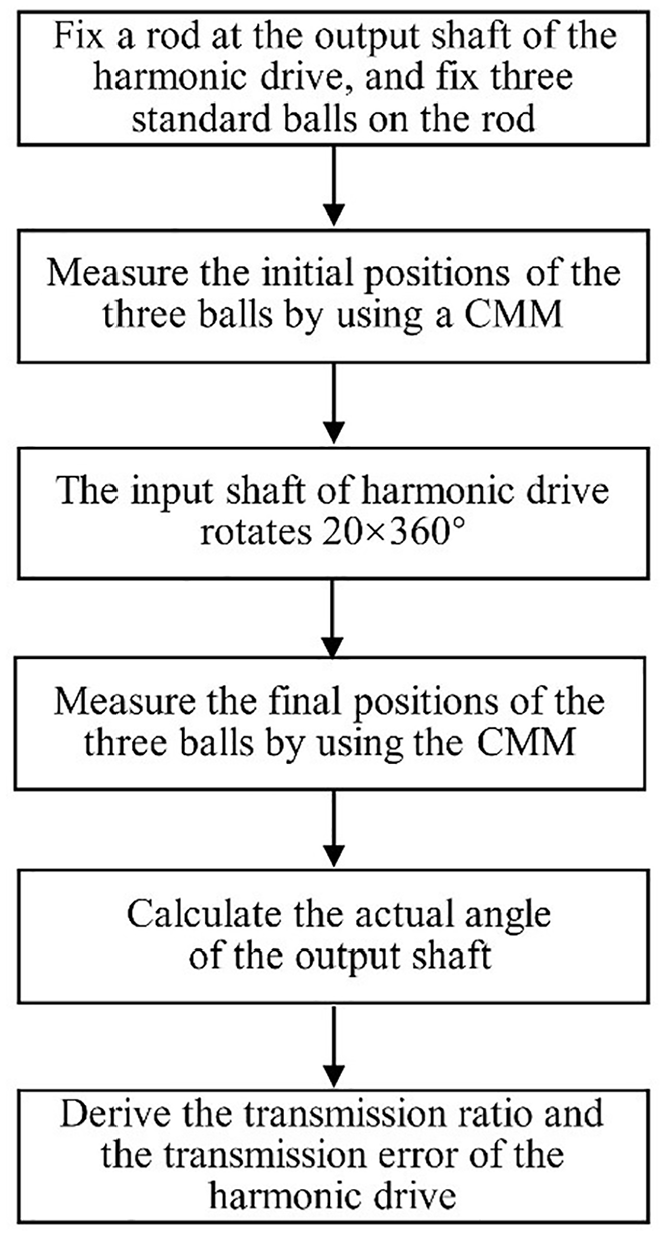
Measurement steps of static transmission errors of harmonic drives.
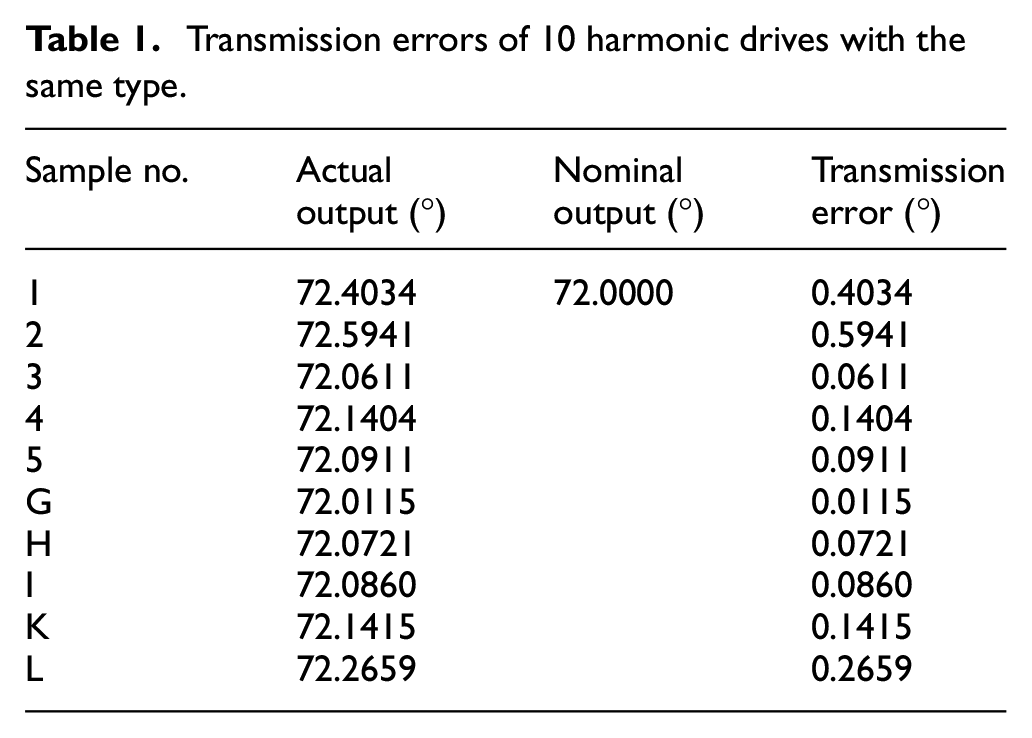
In the measurement, the input of the harmonic drives is 20 × 360°, and their theoretical output should be 72° due to the nominal transmission ratio 100. The actual output angles of the output shaft are calculated according to the center positions of the three standard balls, and the average values are obtained as the results after several times of measuring and calculating the transmission ratios. As a result, the static transmission errors of the 10 harmonic drives are calculated based on the rotation matrix about an arbitrary axis (the Goldman matrix), 38 as shown in Table 1.
Transmission errors of 10 harmonic drives with the same type.
Test rig of data-driven transmission ratio evaluation of harmonic drive
The hardware organization of the test rig for the data-driven transmission ratio evaluation of the harmonic drive is shown in Figure 6. This test rig is composed of the base, the servo motor, the motor driver, the controller, the harmonic drive, the current sensor, the load, the data acquisition card, the computer, the DC power supply, and the limit switch in Figure 6(a). In this experiment, the controller let the load move in a reciprocating motion as an inverted pendulum, driven by the servo motor and the harmonic drive. The signal of the limit switch is input into the controller, indicating the start of the reciprocating motion. By the acquisition card, the output torque and the rotation speed of the servo motor can be read by the computer. Based on the current sensor, the motor current data can be sampled by the computer, too. Consequently, the data of the torque, the current, and the rotation speed of the servo motor can be read and stored by the computer.

Test rig for transmission ratio evaluation of harmonic drives: (a) block diagram of test rig and (b) picture of mechanical part of test rig.
In order to reduce the electromagnetic interference to the motor itself, the wired Hall sensor is selected as the current sensor, and its measurement range is ±10 A. The data acquisition program is developed based on the LabVIEW, and the data above is collected and stored on line. The data could be further processed and modeled in the next step.
In this experiment, the sampling frequency is determined to be 1 kHz based on the characteristics of the motion and monitoring data, and each load motion cycle is saved as a set of the sample data. The above experiment is performed sequentially on the 10 harmonic drives shown in Table 1, in which each harmonic drive is subjected to the same reciprocating motion several hundred times under the same load. The motor current data, the motor output torque data, and the motor speed data are collected and saved.
The transmission error of the harmonic drive is the difference between the theoretical output angle and the actual output angle. The upper limit standard of the transmission error about the type of the harmonic drives used in the experiment is Δδ = 0.025° according to the product manual of the harmonic drive. Based on the results of transmission error measurement on the 10 harmonic drives and the harmonic drive standard, 39 the transmission error of the harmonic drives is divided into six levels, as shown in Table 2. As shown in Table 2, four samples (“3,”“H,”“I,” and “5”) of harmonic drives are included in Level 1 of the static transmission error, and the samples “4” and “K” belong to Level 2.
Classification of transmission error levels of harmonic drives (Δδ = 0.025°).

In this experiment, since the motor speed data are identical, they are not used. By the experiment, a total of 3000 groups of motor torque and current sample data corresponding to six levels of transmission errors are collected, and 500 groups are selected for each transmission error level. After the sample data is filtered and preprocessed, a 2500-dimensional data vector is obtained that includes the statistical features calculated from the motor torque and current data, the WPEE value, and the marginal spectrum data of the motor current, as addressed in the next subsection. After these high-dimensional data are input into the ID-CNN, the 10-dimensional feature code can be output by the data fusion encoding.
Result analysis
After the filtering of the motor monitoring data based on the wavelet threshold method, the statistical features are calculated. The statistical feature examples of the motor current data are shown in Table 3, and the ones of the motor torque are shown in Table 4. Furthermore, the WPEE examples of 600 groups of the motor current or torque signals are shown in Figures 7 and 8. For each group of the samples, the WPEE is given for eight frequency bands, and the width of each frequency band is 62.5 Hz. As a result, the frequency range of each sample group is set from 0 to 500 Hz considering the sampling frequency is 1000 Hz.
Statistical feature examples of motor current data.

Numerical statistics examples of motor torque data.


Examples of Wavelet Packet Energy Entropies corresponding to 600 groups of motor current signals: (a) frequency band 1, (b) frequency band 2, (c) frequency band 3, (d) frequency band 4, (e) frequency band 5, (f) frequency band 6, (g) frequency band 7, and (h) frequency band 8.

Examples of Wavelet Packet Energy Entropies corresponding to 600 groups of motor torque data: (a) frequency band 1, (b) frequency band 2, (c) frequency band 3, (d) frequency band 4, (e) frequency band 5, (f) frequency band 6, (g) frequency band 7, and (h) frequency band 8.
After filtering and denoising the current data of the driving motor of the harmonic drive, the feature extraction is further implemented based on the Hilbert marginal spectrum analysis. In this study, for the Hilbert marginal spectrum analysis results of the driving motor current, the part with larger amplitude (greater than 10−4) is cropped when the corresponding frequency is within 120 Hz, as shown in Figure 9. In Figure 9, the results of the Hilbert marginal spectrum with a frequency within 30 Hz are enlarged. The result shows that the increase of the transmission error of the harmonic drive has an impact on the current of the driving motor. When the transmission error of the harmonic drives increases, the amplitude of the Hilbert marginal spectrum of the driving motor current within the frequency of 20 Hz also gradually increases. Therefore, in this study, from the Hilbert marginal spectrum of the driving motor current, the data sequence with an amplitude of 10−3 is cropped as the marginal spectrum feature for the following analysis.
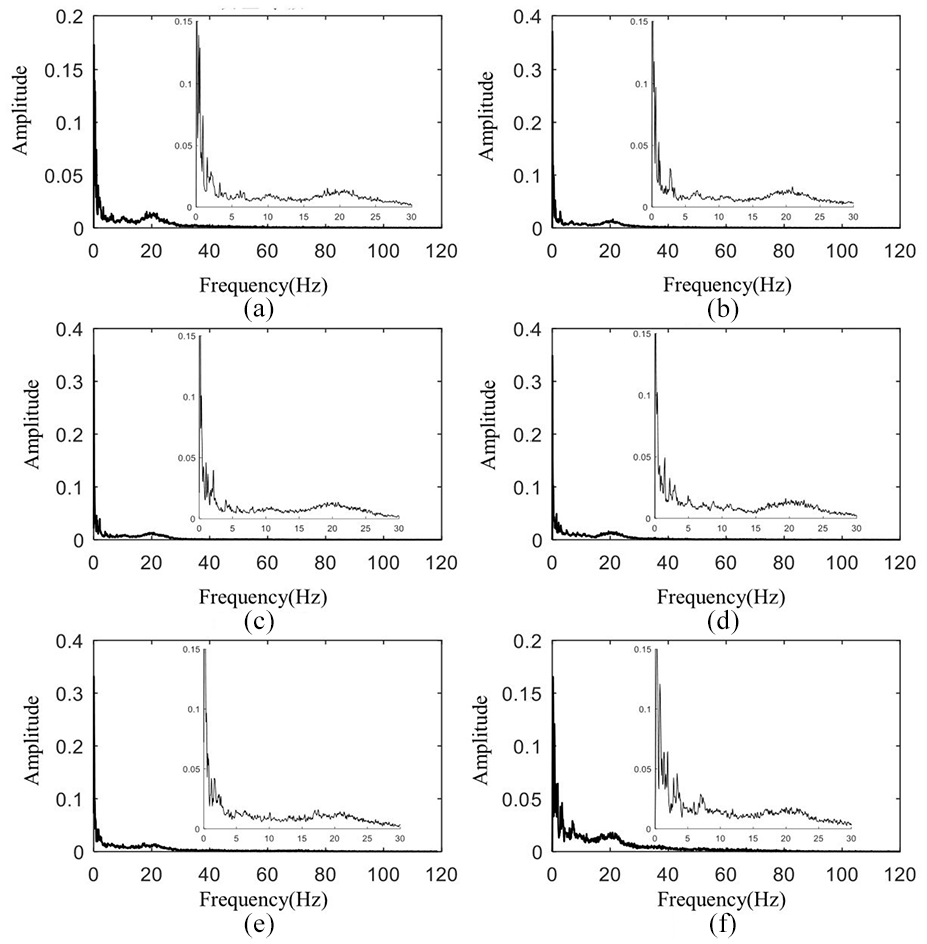
Hilbert marginal spectra of the driving motor current data for the harmonic drives with different levels of transmission errors and their partial enlargement: (a) level 1, (b) level 2, (c) level 3, (d) level 4, (e) level 5, and (f) level 6.
The trend of the 10-dimensional fusion encoding results under different transmission error levels is shown in Figure 10, which gives the averaged values of the 10-dimensional fusion encoding. In addition, for the fusion coding results in all samples, 50 groups of data are randomly selected corresponding to each transmission error level. The t-distributed Stochastic Neighbor Embedding (t-SNE) method is applied to compress these encoded feature data into two dimensions for visualization, and their results are shown in Figure 11. In Figure 11, the boundaries among the results of the different transmission error levels are clear except that the ones of Level 2 and Level 3 overlap partially.
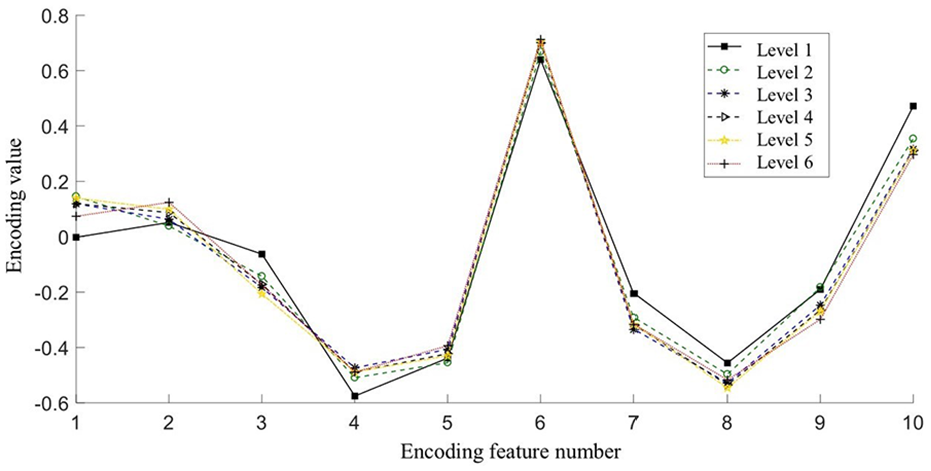
Ten-dimensional fusion encoding results under different transmission ratios.

Visualization of feature downscaling after feature extraction based on 1D-CNN.
In order to improve the performance of the transmission error evaluation model and avoid its over-fitting, the cross-validation method is used to train the HMMs. The basic idea of cross-validation is to divide the sample data into two parts: the training set and the test set. After the model training is completed by using the training set, the classification and recognition performance of the model is evaluated through the test results based on the test set. In this study, the K-fold cross-validation method is applied, in which the data set is divided into K subsets. One of the subsets is randomly selected as the test set, and the remaining K−1 subsets are used as the training set. In the K-fold cross-validation process, each subset will be verified once as a test set. The operation that each sample set is used for training and verification can improve the generalization ability of the model.
The training process of the HMM is shown in Figure 12. The sample set is the 10-dimensional results of fusion coding corresponding to six levels of the transmission error, which are output by the 1D-CNN. The sample sets are equally divided into three groups for the training and the test. Based on the monitored data, the number N of hidden states of the HMM is set 3 for each transmission error level, and the dimensionality M of the observations in each hidden state is 10 considering the output of the 1D-CNN. Assume that the initial state is π = [1, 0, 0], that is, the initial state of each transmission error level is supposed to be the optimal state for that group of transmission levels; the initial state transition probability matrix A and the initial observation probability matrix B of the HMM for each transmission error level are selected randomly. Then, the Baum–Welch algorithm is used to train the model. After updating the model parameters, three different HMMs are finally obtained. The HMM with the best performance is selected as the final model. According to the model performance index formulas of equations (11)–(14), the performance comparison of the three HMM-based identification models for the transmission error levels of the harmonic drive is shown in Table 5. Based on Table 5, Model 2 has a better classification result for the transmission error levels, by which the accuracy of identifying the six levels of transmission errors of harmonic drives is greater than 91%. Model 2 is selected in the following.

Flowchart of training HMMs based on cross-validation.
Performance comparison of different HMMs by cross-validation.

As shown in Figure 13, the log likelihood probabilities of the selected Model 2 after six steps of training is almost unchanged. The model is converged, meeting the convergence error requirement. The calculation results of the six state transition matrices


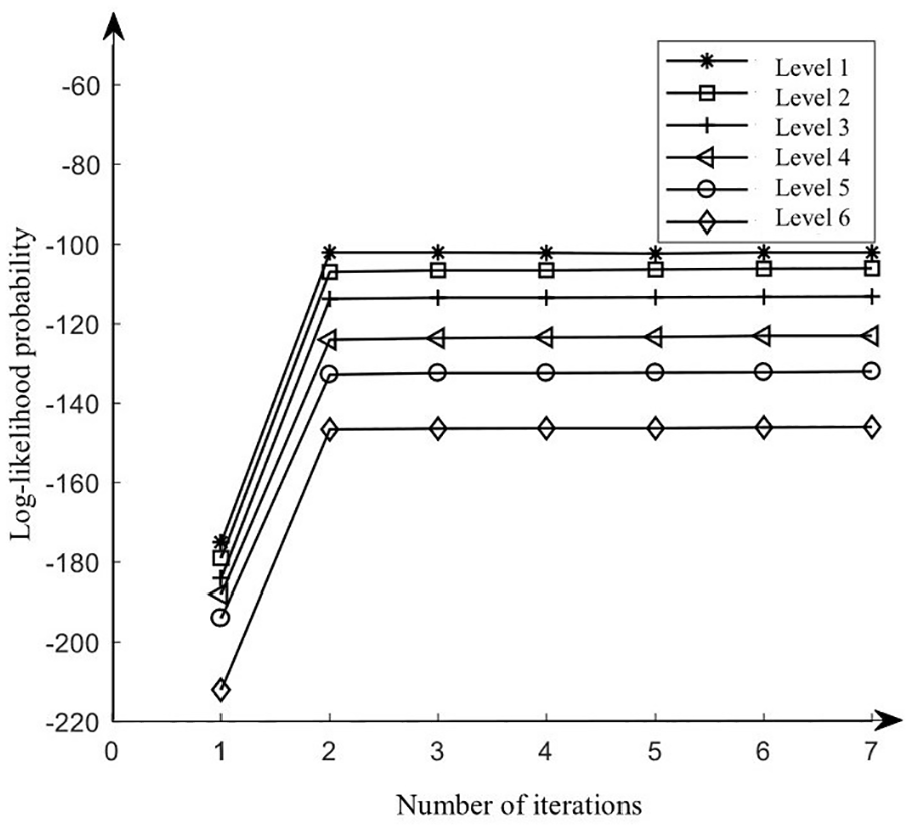
Iteration results of model training.
Based on the samples, the identification results of the six transmission error levels are shown in Table 6. The output of each HMM is the log-likelihood values. The smaller the absolutes of the log-likelihood, the higher the similarity between the models. Using the six HMMs, each HMM corresponds to a transmission error level. By inputting the fusion code of the driving motor monitoring data into the six HMMs, the identified is the transmission error level corresponding to the HMM with the smallest absolute of the log-likelihood values.
Log-likelihood and identified results of the transmission error levels based on 1D-CNN and HMMs.


Note. The shaded value in each line represents the maximum log-likelihood for that line.
Based on the fusion encoding data output from the 1D-CNN, this study also further analyzes the application of the K-means method to evaluate the transmission error levels of the harmonic drive. The K-means clustering method is an unsupervised learning method to cluster and classify the sample data by using the calculated value of Euclidean distance as the similarity index. 40 The K-means method initially selects the clustering centers of K categories, and then updates the clustering centers according to the Euclidean distance by iterative computation. Finally, the classification is realized. The detailed description of the K-means clustering method can be found in the reference of Yiakopoulos et al. 40
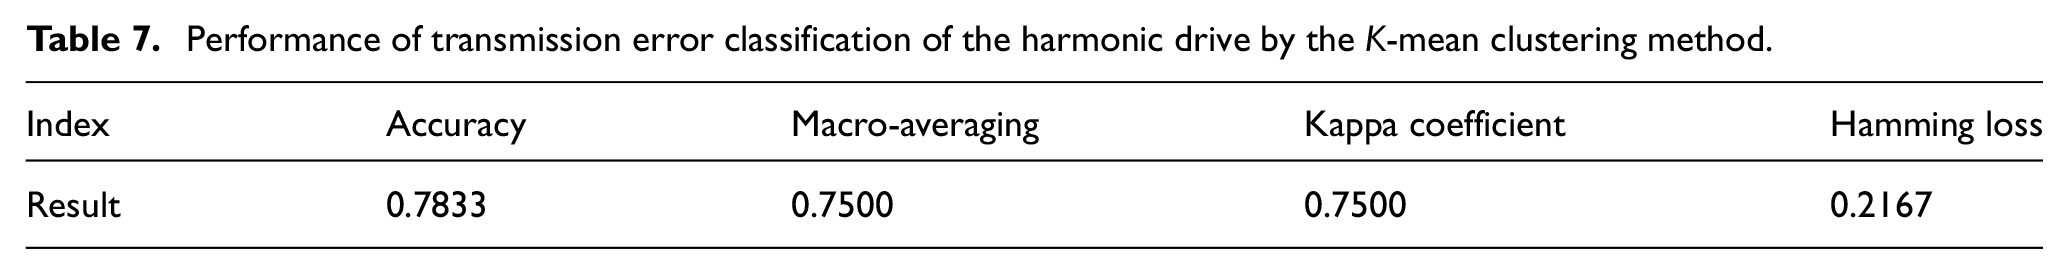
However, some of the clustering centers in this study are too close to each other. It is difficult to isolate the samples with Level 2 and Level 3 of the transmission error (as in Figure 11), and there is also misidentification for the samples of Level 1, too. The performance of transmission error classification of the harmonic drive by the K-mean clustering method is shown in Table 7. It can be seen that the K-mean method is not as effective as the proposed data-driven transmission ratio evaluation method based on the 1D-CNN and HMM in this paper shown in Table 5.
Performance of transmission error classification of the harmonic drive by the K-mean clustering method.
Conclusion
In order to evaluate transmission errors of harmonic drives, which are used in many industrial robots and lots of precision motion equipment, a novel on-line data-driven evaluation method based on the current and torque data of the driving motor is proposed in this paper. The fusion encoding result of the monitored data of the driving motor based on the 1D-CNN is used as the features. Then, based on these features, the HMMs under different transmission error levels are trained by the cross-validation procedure. Thus, the transmission errors of the harmonic drives can be evaluated based on the 1D-CNN method and the HMM. The experimental results in this paper show that the transmission error levels of the harmonic drives can be classified based on the current and torque signals of the driving servo motor. The proposed on-line evaluation method can identify six distinct levels of static transmission errors in harmonic drives with an accuracy greater than 91% in this paper.
Although this paper only provides a preliminary verification of the correlation between the drive servo motor’s current and torque signals and the health status of the harmonic drives, it also provides a new direction for Prognostics and Health Management of industrial robots. In this study, the transmission error identification method is developed based on the experiment of the one-axis arm. Actually, an industrial robot has usually six reducers and six driving motors. The developed on-line data-driven transmission ratio evaluation method may be extended to the six-axis serial industrial robot based on controlling joint movements of joint-by-joint. For example, in the context of health monitoring for harmonic drives, specific programming is implemented to achieve the individual movement of each joint of a six-axis serial industrial robot, while simultaneously monitoring the corresponding servo motor’s current and torque signals. For different reducers and industrial robots, the model parameters in this method need to be retrained, and the feature extraction and feature classification methods may also need to be redesigned. Additionally, it may be interesting to prove in the future that current and torque signals of driving motors are sufficient for evaluating transmission errors in harmonic drives based on mathematical analysis or simulation.
Footnotes
Handling Editor: Aarthy Esakkiappan
Declaration of conflicting interests
The author(s) declared no potential conflicts of interest with respect to the research, authorship, and/or publication of this article.
Funding
The author(s) disclosed receipt of the following financial support for the research, authorship, and/or publication of this article: This work has been partially supported by the Huzhou Key Research and Development Project of Zhejiang Province (2023ZD2006) and the National Natural Science Foundation of China under Grant 62373339.