
Abstract
This study aims to numerically investigate the conjugate heat transfer (CHT) and the changes in the hydraulic and thermal terms of laminar flow (300 ≤ Re ≤ 800) in a 3-D wavy microchannel heat sink (MCHS). The obtained results from different nanofluid flow simulated models will be compared. The numerical simulation approaches used include single-phase, mixture, Eulerian, DPM, and DDPM. The effect of adding 1%, 3%, and 6% concentration of CuO nanoparticles (100 nm) in deionized water as the base fluid is examined on various parameters such as local and axial temperature, heat transfer convective coefficient, friction factor, Nusselt number (Nu), velocity distribution, and thermal and hydraulic boundary layer parameters. The substrate surface, due to its larger area surface and the amplitude of the sinusoidal wave, has a greater impact on the nanofluid flow as a channel bottom conjugate surface compared to others. The results obtained from the different models show close agreement with each other for various cases. For example, at Re = 304, the average Nu and friction factor for pure water are approximately 10.43 and 0.0260, respectively. For water with 0.01 concentration of CuO nanoparticles, Nu is found to be in the range of 10.43–10.78, and the friction factor ranges from 0.260 to 0.290, depending on the approach used for simulation. This shows a 2% increase in Nusselt number compared to a 0.05% increase in the friction factor. Moreover, these values increase by approximately 5.7% and 11.3% on average with an increase in CuO nanoparticle concentration to 0.06. Additionally, the DPM and DDPM models show a 15% difference in the scattering of CuO nanoparticles compared to the Eulerian-Eulerian models. The single-phase model presented in this study yields similar results to the multiphase approaches. Furthermore, the PEC parameter increases by about 1.9% with the addition of CuO nanoparticles at a concentration of 0.06.
Keywords
Introduction
The heat transfer enhancement issue has received basic attention in thermal applications. Several approaches have been examined to enhance heat transfer and get more efficient/effective heat exchanger devices in different engineering applications in recent years. The active and the passive methods in heating and especially in cooling are two common methods of heat exchange. 1 In the active method, the heat transfer system uses the energy, whereas the no energy is used in passive method. Various passive methods have been suggested in the literature to increase the performance of the heat transfer mechanism, for example using extensive surfaces, channels with non-circular cross-sections, vortex generators, surface materials, microchannels, additives in liquids, etc.2,3 Because of the more conductive heat transfer coefficient of metals, adding their particles to the base fluid has increased the thermal conductivity of the fluid. Furthermore, one of the attractive means for thermal control and convective heat transfer is the microchannel. 4 Also, using wavy surfaces in the microchannels as a passive method has been used to enhance the heat transfer mechanism in several studies.5,6 As the scale of the devices becomes smaller, more investigations need to study the various aspects of the heat and flow distribution of the microchannel. Unsteady conjugate heat transfer (CHT) of a thermally developing flow in a microtube is studied by Şen and Darici. 7 They observed the fluid temperature increases by increasing in Brinkman number in the upstream region. Borah et al. 8 considered the conjugate force convective of the microchannel under the sinusoidal heat flux distribution with a phase difference between two walls. They claimed that the CHT depends on both the wall thickness and the thermal conductivity of the wall. In a numerical investigation of the MCHS by Dehghan et al., 9 a 33% growth in the convective heat transfer in a converging flow channel more than the straight one in the case of 2% Al2O3/water work fluid was reported. Rostami et al. 10 in another numerical research via discrete phase model show in the case of water/cu in 100nm and 2% concentration the Nusselt number of the conjugate surfaces rises by 33.2% in compare with water through a wavy MCHS. The heat transfer and fluid flow of the MCHS with the secondary flow was modeled by Alsaiari et al. 11 Abdollahi et al. 12 simulated a microchannel with longitudinal fins under a constant heat flux. They show the SiO2 in 2% and 30 nm had more performance in comparison to CuO, ZnO, and Al2O3. The MCHS performance under different condition were studied by Ambreen et al.13–15 They studied numerically the thermohydraulic parameters of the 15 nm spherical shape of Al2O3-Cu/water in 1% of concentration hybrid nanofluid via the DPM approach through the micro diamond, circular, and elliptical fin heat sink. Their obtained results show a 25.14%, 19.65%, and 24% enhancement in mean Nuseelt number for diamond, circular, and elliptical fins, respectively. Saadoon et al. 16 investigated the impacts of the amplitude of the wavy MCHS and the volume fraction of CuO. Al2O3, TiO2, Ag, and Fe3O4 in 2.5%, 5%, and 7.5% in laminar flow. Sadripour 17 presented the 1.315 increases in the PEC parameter in the case of 4% of SiO2/water nanofluid through a corrugated channel. Ali et al. 18 considered numerically the thermal behavior of the Al2O3 nanofluid pass along MCHS with different shapes of fin in it.
Amiri et al. 19 in their recent paper studied thermal management enhancement by water/Ag nanofluid with sinusoidal and absolute sinusoidal wavy MCHS walls. They reported by utilizing unnecessary sinusoidal periods wall the heat transfer and thermal efficiency reduced, while employing only one absolute sinusoidal wavelength enhances thermal efficiency by 3.35%.
As a passive method in enhancing heat transfer in electronic devices, MCHS used an efficient solution to reduce the undesirable heat flux in the thermal devices. Wavy designs in microchannel are the two main varieties that have been the focus of extensive research in this field.
Therefore, due to earlier mentions, it has been tried to study a comprehensive numerical approach to survey the heat and flow characteristics (conjugate heat flux, local and axial temperature, heat transfer convective coefficient, friction factor, Nusselt number, velocity distribution, and thermal and hydraulic boundary layers) of the CuO-water as the nanofluid in a 3-D wavy MCHS via the single-phase, Eulerian-Eulerian (mixture and Euler multiphase models), and Eulerian-Lagrangian (DPM and DDPM models) approaches to compare the obtained results to each other and also study the behavior of the nanofluid flow behavior versus the base fluid. To study the effect of adding CuO nanoparticle to the pure water from the point of the thermohydraulic, the PEC term in all approaches were computed for all studied simulation cases, also.
Mathematical formulation
Supposing a three-dimensional fluid and solid CHT problem, the physical properties of the fluid flow and solid are independent of temperature if the flow is laminar. Then, the governing equations for the nanofluid flow and solid parts could be written as follow in each CFD model. 20 Moreover, the following assumptions have been considered to simplify the heat and flow modeling in the computational domain:
- Model is considered to be steady-state.
- The flow is assumed to be laminar and incompressible.
- Physical parameters of solids and fluids are constant.
- The natural convective and radiative heat transfers from the MCHS are ignored.
The Governing equations in the presented methods (for subsequent equations without explicit references, the preceding reference is implied).

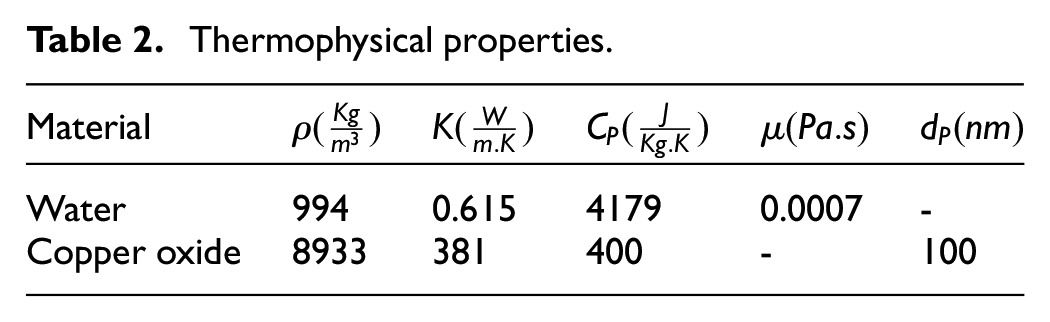
Thermophysical properties.
The applied boundary condition of the MCHS simulation.

It is also needed to mention that the energy equation in the solid part is


Where the

Geometry model
The wavy microchannel heat sink has been deemed as one of the several methods employed for increasing heat transfer efficiency. Among the various waveforms of the channel, the sinusoidal type has been used in different studies because of its geometry. The wavelength of the sinusoidal waveforms and its amplitude are playing important roles to conduct the flow and the governing regime.
The computational domain has been shown in Figure 1 which is experimentally used by Sui et al.
55
The working fluid is pure water. The width and depth of the investigated microchannel are Sc = 207 µm and H = 406 µm, respectively. The waveform part of the channel follows the
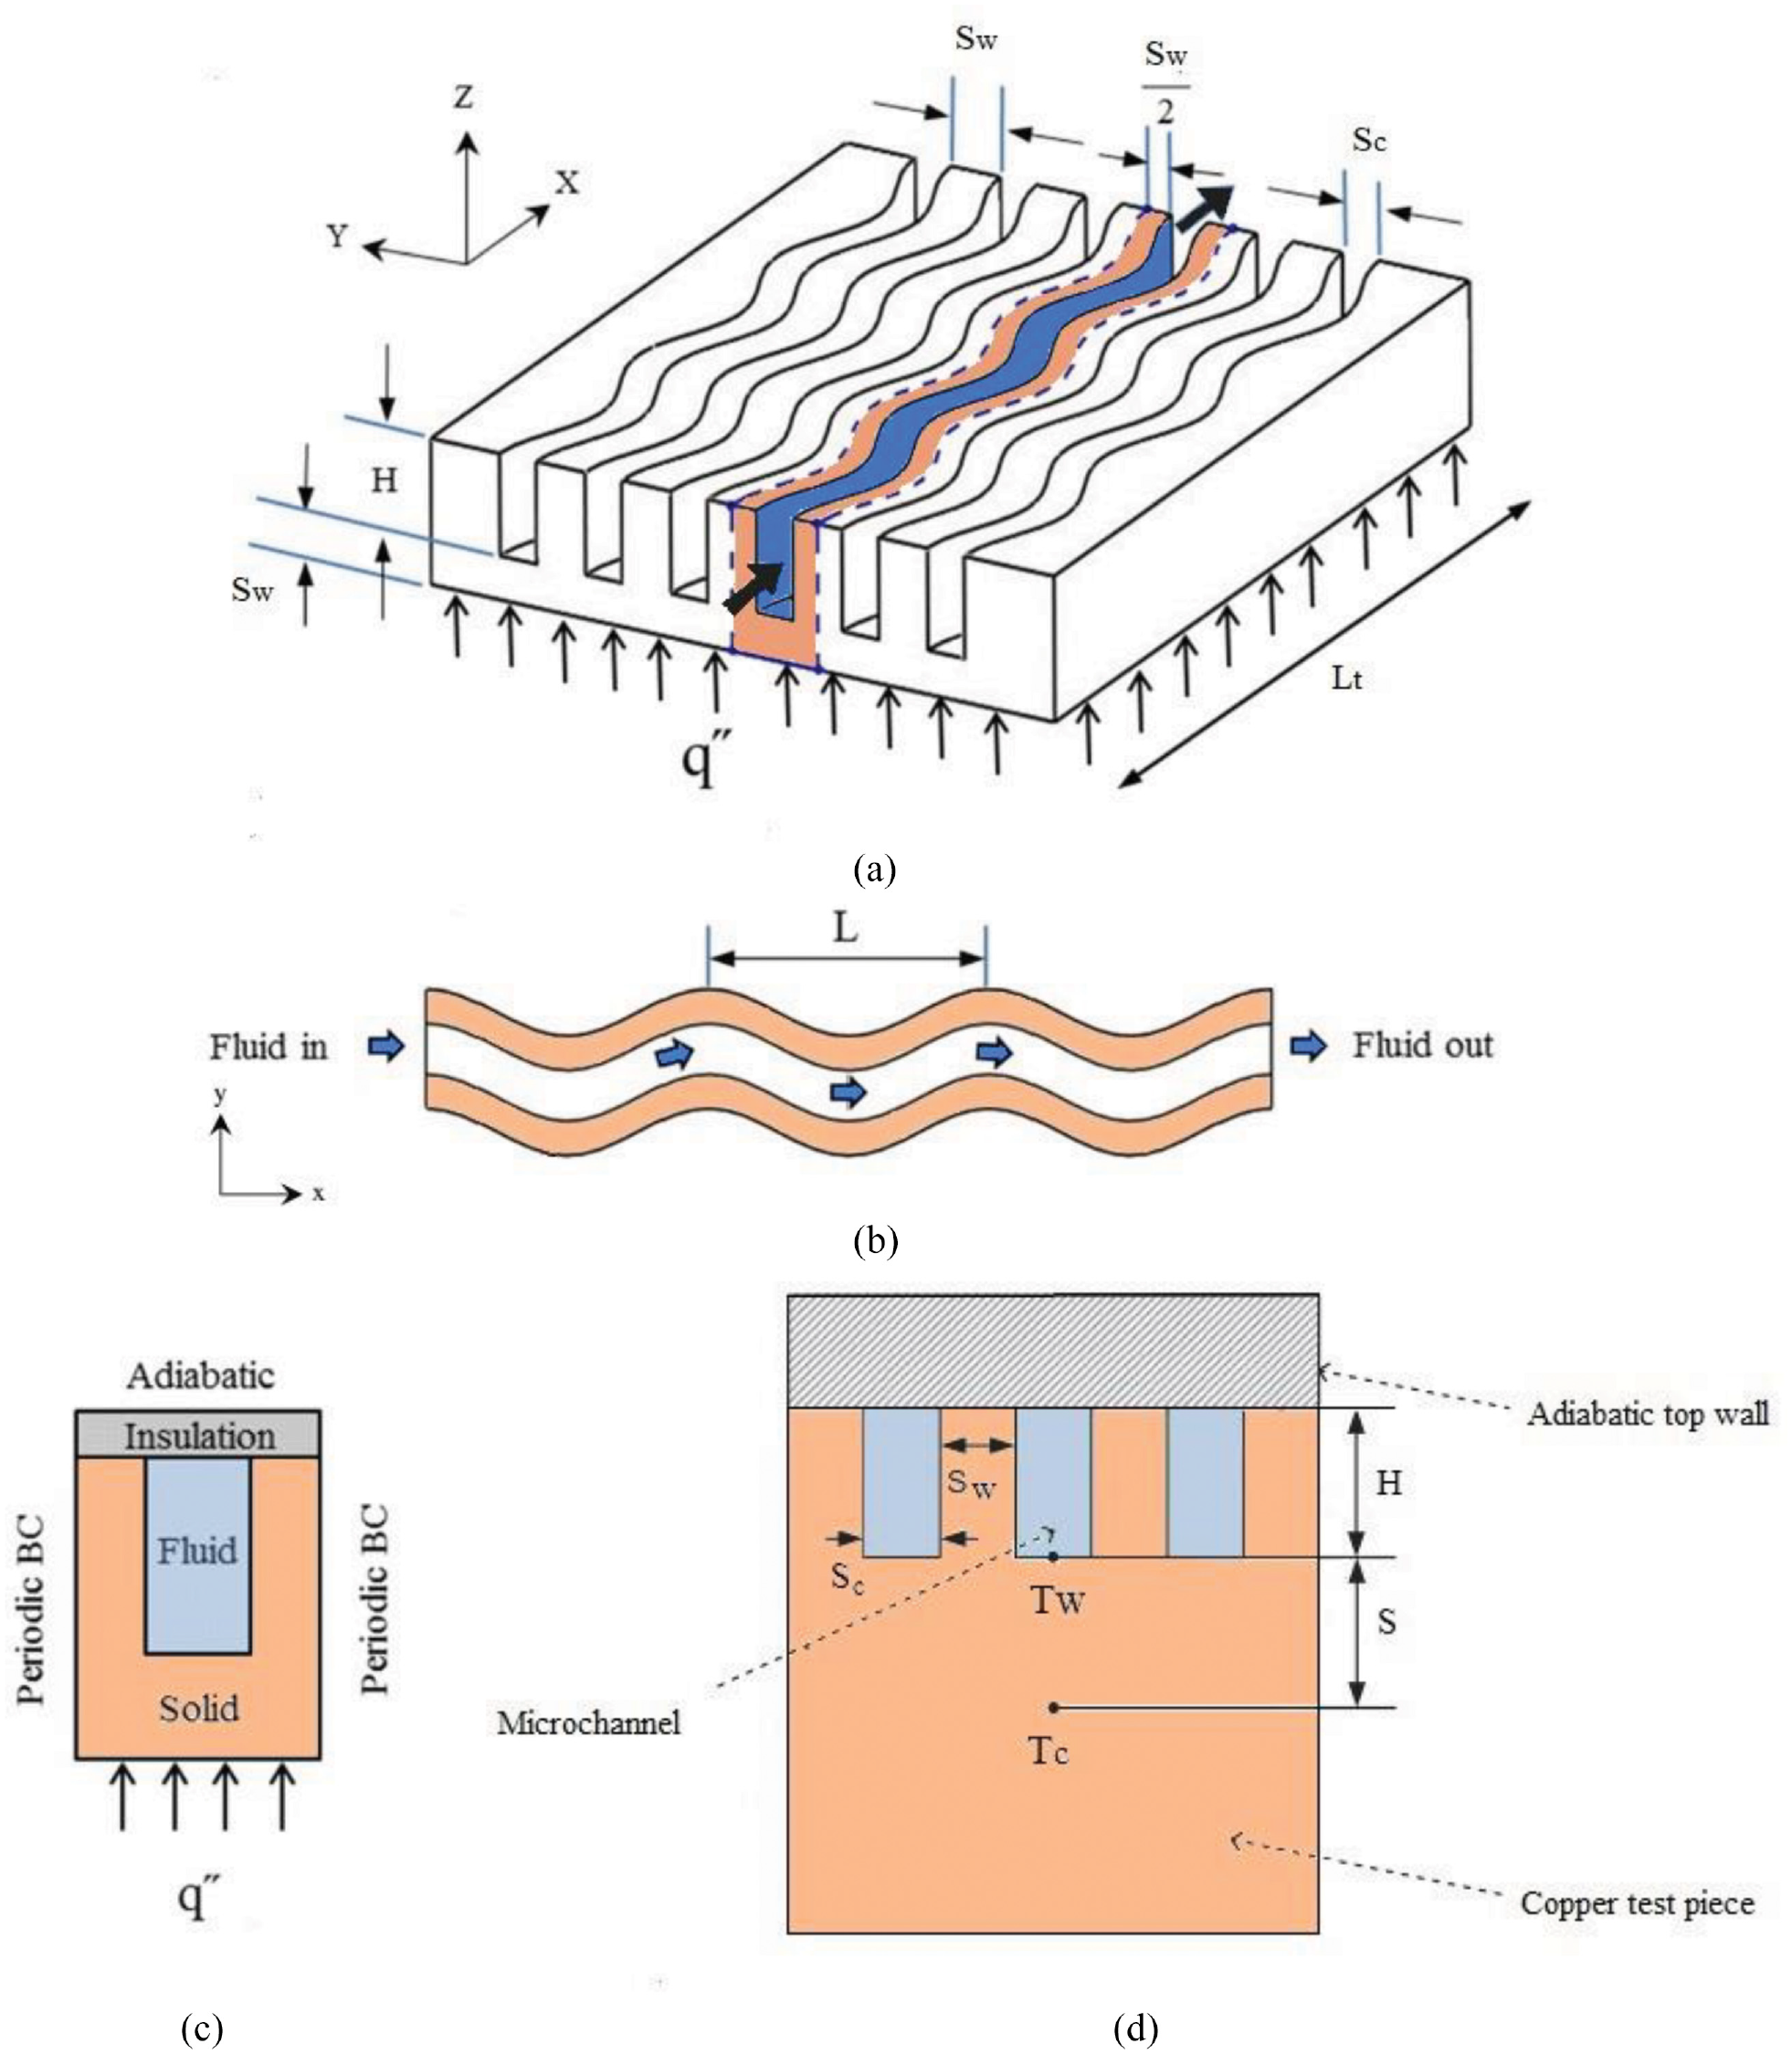
The computational geometry. (a) Copper block contains 60 wavy microchannel. (b) Conjugate domain along the microchannel. (c) Conjugate domain across the microchannel. (d) Cross-section of the microchannel sample.
According to the standard procedure, the heat (

where Q denotes the flow rate,
To calculate the temperature of the microchannel wall, 1-D heat conduction is considered as below:

In equation (5), the temperatures

where N = 60 in this simulation, and
The term
where

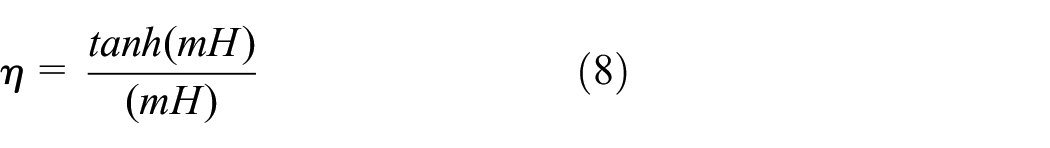
The fin efficiency is evaluated using an iterative approach as described in Yao et al. 54 Then, the average Nusselt number is evaluated as:

where

where

where the pressure gradient is calculated along the microchannel length.
To calculate the fin efficiency (
Moreover, to evaluate the overall performance of the MCHS by adding CuO nanoparticles to the pure water and study its hydrothermal performance in simulated numerical methods, the performance evaluation criteria (PEC) is used. The PEC parameter is defined as follows 56 :

where
In general, the geometry has been divided to two parts; the MCHS solid body and the flow channel which means these two parts exchange the heat transfer via conjugate surfaces. In such a way the produced heat flux in the solid part of the MCHS exchange in the conjugate surfaces by the developed fluid flow enters to the channel with uniform and constant values in velocity and temperature.
The governing equations have been discretized by the finite volume method (FVM) via Ansys Fluent package. It is needed to note; the SIMPLE scheme is employed to solve the pressure-velocity coupling. while the PRESTO scheme is applied to discretize the pressure, the second-order upwind is selected for the spatial discretization of momentum and energy equations. The continuity, momentum, and energy residuals are set to 10−6, 10−6, and 10−10, respectively.
More cell elements are needed to obtain reasonable results in Eulerian-Lagrangian approaches in comparison with the Eulerian-Eulerian approaches and also in contrast to the single-phase methods. To consider the unique mesh system for the simulation of all approaches, it is tried to obtain results from the DPM method to be the criteria of this evaluation. To examine the effect of the mesh grid size on the numerical results, different uniform cell systems in both the solid and the fluid part of the microchannel have been implemented (see Figure 2(a)). For this purpose, the Nusselt number has been investigated which has been depicted in Figure 2(b). Therefore, the mesh system with the 582,250 cells has been selected by less than a 0.17% difference in the both friction factor and Nusselt number. Meanwhile, despite the Nusselt number which is an integral variable, the temperature profile at the middle section of the outlet boundary in the height channel direction was investigated to be sure of the chosen mesh grid systems (see Figure 2(b)).

(a) Structured mesh system in all domains. (b) Changes in the Nusselt number based on the cells number.(c) Temperature distribution in the x = L cross section.
All of the mentioned approaches for nanofluid simulation have been validated based on the two various experimental studies. The former was provided by Sui et al., 55 shows that the flow friction and heat transfer of deionized water in 3-D wavy microchannels experimentally is more important from this point of view which has been used in this research to investigate the effect of the CuO as the nanoparticle in the base fluid in this geometry as the passive methods. In addition, the latter considered the convective heat transfer in nanofluid in a circle tube under a constant heat flux which is done by Anoop et al. 57 Eulerian-Eulerian model treats both the base fluid and nanoparticles as continuous phases. The governing equations for each phase are solved simultaneously to determine their respective velocities, pressures, and concentrations. The interactions between the two phases are accounted for by incorporating additional terms in the equations. This model is suitable for studying highly loaded nanofluids containing a high volume fraction of nanoparticles. In Eulerian-Lagrangian model, the base fluid is considered as a continuous phase using the Eulerian method, while the nanoparticles are treated as discrete Lagrangian particles. The base fluid is modeled using the Navier-Stokes equations, while the particles’ motion is determined by solving the motion equations for each particle. This model is appropriate for dilute nanofluids with low particle volume fractions. It seems that the Euler, single phase, and mixture models have the least deviations from the laboratory results. The main difference between the Euler two-phase and the mixture model lies in how they treat the dispersed nanoparticles. In the Euler two-phase model, the nanoparticles are considered as a separate phase, while in the mixture model, they are treated as part of the fluid mixture. Each model has its advantages and limitations, and the choice depends on the specific characteristics of the nanofluid being simulated and the desired level of detail in the analysis. In the single-phase model, the properties of the nanofluid, such as density, viscosity, and thermal conductivity, are calculated as effective properties based on the nanoparticles volume fraction in the mixture. The model also considers the energy transfer between the nanoparticles and the base fluid, taking into account factors such as thermophoresis, Brownian motion, and convection compared to two-phase models, which treat the nanoparticles and base fluid as separate phases, the single-phase model is more convenience and computationally less demanding. It provides an efficient way to predict the overall behavior of nanofluids, such as their heat transfer performance, without the need for detailed information about the individual phases. However, one limitation of the single-phase model is that it does not capture the spatial distribution and interaction of nanoparticles within the fluid. It assumes a homogeneous distribution, neglecting any concentration gradients or clustering effects that may occur in practice. This limitation can make the single-phase model less accurate for certain applications, such as predicting the behavior of nanofluids in complex flow patterns or near solid surfaces. In contrast, two-phase models, such as the Eulerian-Eulerian and Eulerian-Lagrangian methods, explicitly consider the separate phases of the nanofluid. These models can capture the spatial distribution and movement of nanoparticles, which may be important in situations where particle clustering or sedimentation occurs. However, two-phase models are more computationally intensive and require more detailed input data, such as the particle size distribution and interphase forces. To be sure from the numerical methods, obtained average Nusselt number in different Res at the 0.698 m section has been compared by a maximum difference of about 9% in the DDPM and the single-phase models (see Figure 3). Overall, the choice between single-phase and two-phase models depends on the specific application and the level of accuracy required. The single-phase model provides a simplified representation of nanofluid behavior, suitable for many engineering applications, while two-phase models offer a more detailed and accurate description but at a higher computational cost.

Results and discussion
The numerical simulation results are extracted for CuO-water nanofluid in different concentrations as the working fluid and a comparison is made among the mentioned models and also the experimental data available in the literature. 55 The effect of adding nanoparticles in the heat and fluid flow parameters and the CHT has been noticed.
It is necessary to note that in the interface between the solid surface and its adjacent fluid, these two conditions must be confirmed. The condition first is that due to the principle of conservation of energy, the constant heat flux must be transferred on the conjugate surfaces. The second one is that the conjugate surfaces must be in thermal equilibrium with their adjacent fluid flow.
Figure 4 shows the transferred heat flux from the conjugate surfaces to the nanofluid flow which is located in a positive direction. While this amount for the solid is in the reverse direction. The substrate surface transferred about 218

Changes in the conjugate heat flux along the channel in the DDPM approach. (a)

Changes in the nanofluid temperature in the case of
As is seen from Figure 4 the variations in the trend of the conjugate heat flux in the substrate surface are less than the sides, while its average amount is more than those (217.6 kW/m2). Although the changes in the heat transfer coefficient depend on the shape of the wavy channel (A, L) and its amount fluctuations along the channel in all of the presented CFD approaches the same trends were observed. Of course, this trend has differences in the DPM approach in comparison with others. Since the wall of the microchannels is wavy, causes the thermal resistance of the conduction to be different compared to the heat dissipation during the microchannel, and the heat flux profile on the surface of the microchannel is different. Meanwhile, the amount of axial heat transfer coefficient is almost the same in these CFD simulations. For example, the heat transfer coefficient at Re = 589 with the 0.03 CuO nanoparticle concentration is 37.885, 37.188, 36.933, 37.175, and 37.675
As mentioned before, the Nusselt number changes as similar to the convection heat transfer coefficient, consequently the maximum Nusselt number occurs at the channel entrance due to the wave-shaped flow path fluctuating along the channel. Due to the growth of the thermal boundary layer on the conjugate surfaces and the tiny size of the cross-section, nanofluid flow is developed. Also, due to the rise in the bulk temperature of the fluid, the
Besides, the variations in the average Nusselt number based on the Re and nanoparticle concentration are observed in Figure 6. Increasing the Re increases the Nusselt number. In the Re = 304, the obtained 11.19 Nusselt number reaches 20.97 for the Re = 794 by 0.06 CuO nanoparticle concentration in the Eulerian model. While, this amount in the DPM model obtained 11.13–21.60, respectively. Although, all of the presented models show similar trends, about a 5% difference is observed in the DDPM approach (11.66–21.85, respectively). Meanwhile, there is a margin (approximately 4%) of obtained Nusselt number in the DDPM model shown in the 0.06 of CuO concentration, the average Nusselt number extracted is a little more in different concentrations, for example, Nusselt number of 11.66 in DDPM approach in contrast with 11.19 in Eulerian model (see Figure 6(b)). Firstly, the addition of nanoparticles rises the effective thermal conductivity of the fluid. Nanoparticles have a high surface area-to-volume ratio, which enhances the interaction between the nanoparticles and the surrounding fluid molecules. This increased interaction leads to improved thermal conductivity, resulting in enhanced heat transfer. Secondly, the presence of nanoparticles alters the fluid viscosity. Most nanoparticles have a higher viscosity compared to the base fluid. This increased viscosity affects the flow behavior of the fluid, leading to changes in convective heat transfer. The flow resistance in the presence of nanoparticles may increase, reducing the overall heat transfer rate. Moreover, the addition of nanoparticles can augment the convective heat transfer coefficient. Due to their small size and the fractal nature of their surface, nanoparticles have a higher probability of being involved in Brownian motion. This increased motion leads to stronger mixing and improved heat transfer at the fluid-solid interface. Furthermore, the presence of nanoparticles can also affect the thickness of the thermal boundary layer. The interaction between nanoparticles and the fluid molecules can result in changes in the boundary layer formation and growth. This alteration in the boundary layer affects the overall heat transfer characteristics of the system. According to the differences in the two-phase and single-phase models for nanofluid modeling, the amount of changes in different models is different.

Changes in average Nusselt number (a) in different approaches for
Abugnah et al. 61 reported that the predictions from three two-phase models – Volume of Fluid (VOF), Eulerian Mixture Model (EMM), and Eulerian -Eulerian Model (EEM) – exhibit significant similarity in the average Nusselt number, showing a 24% increase compared to the single-phase model (SPM).
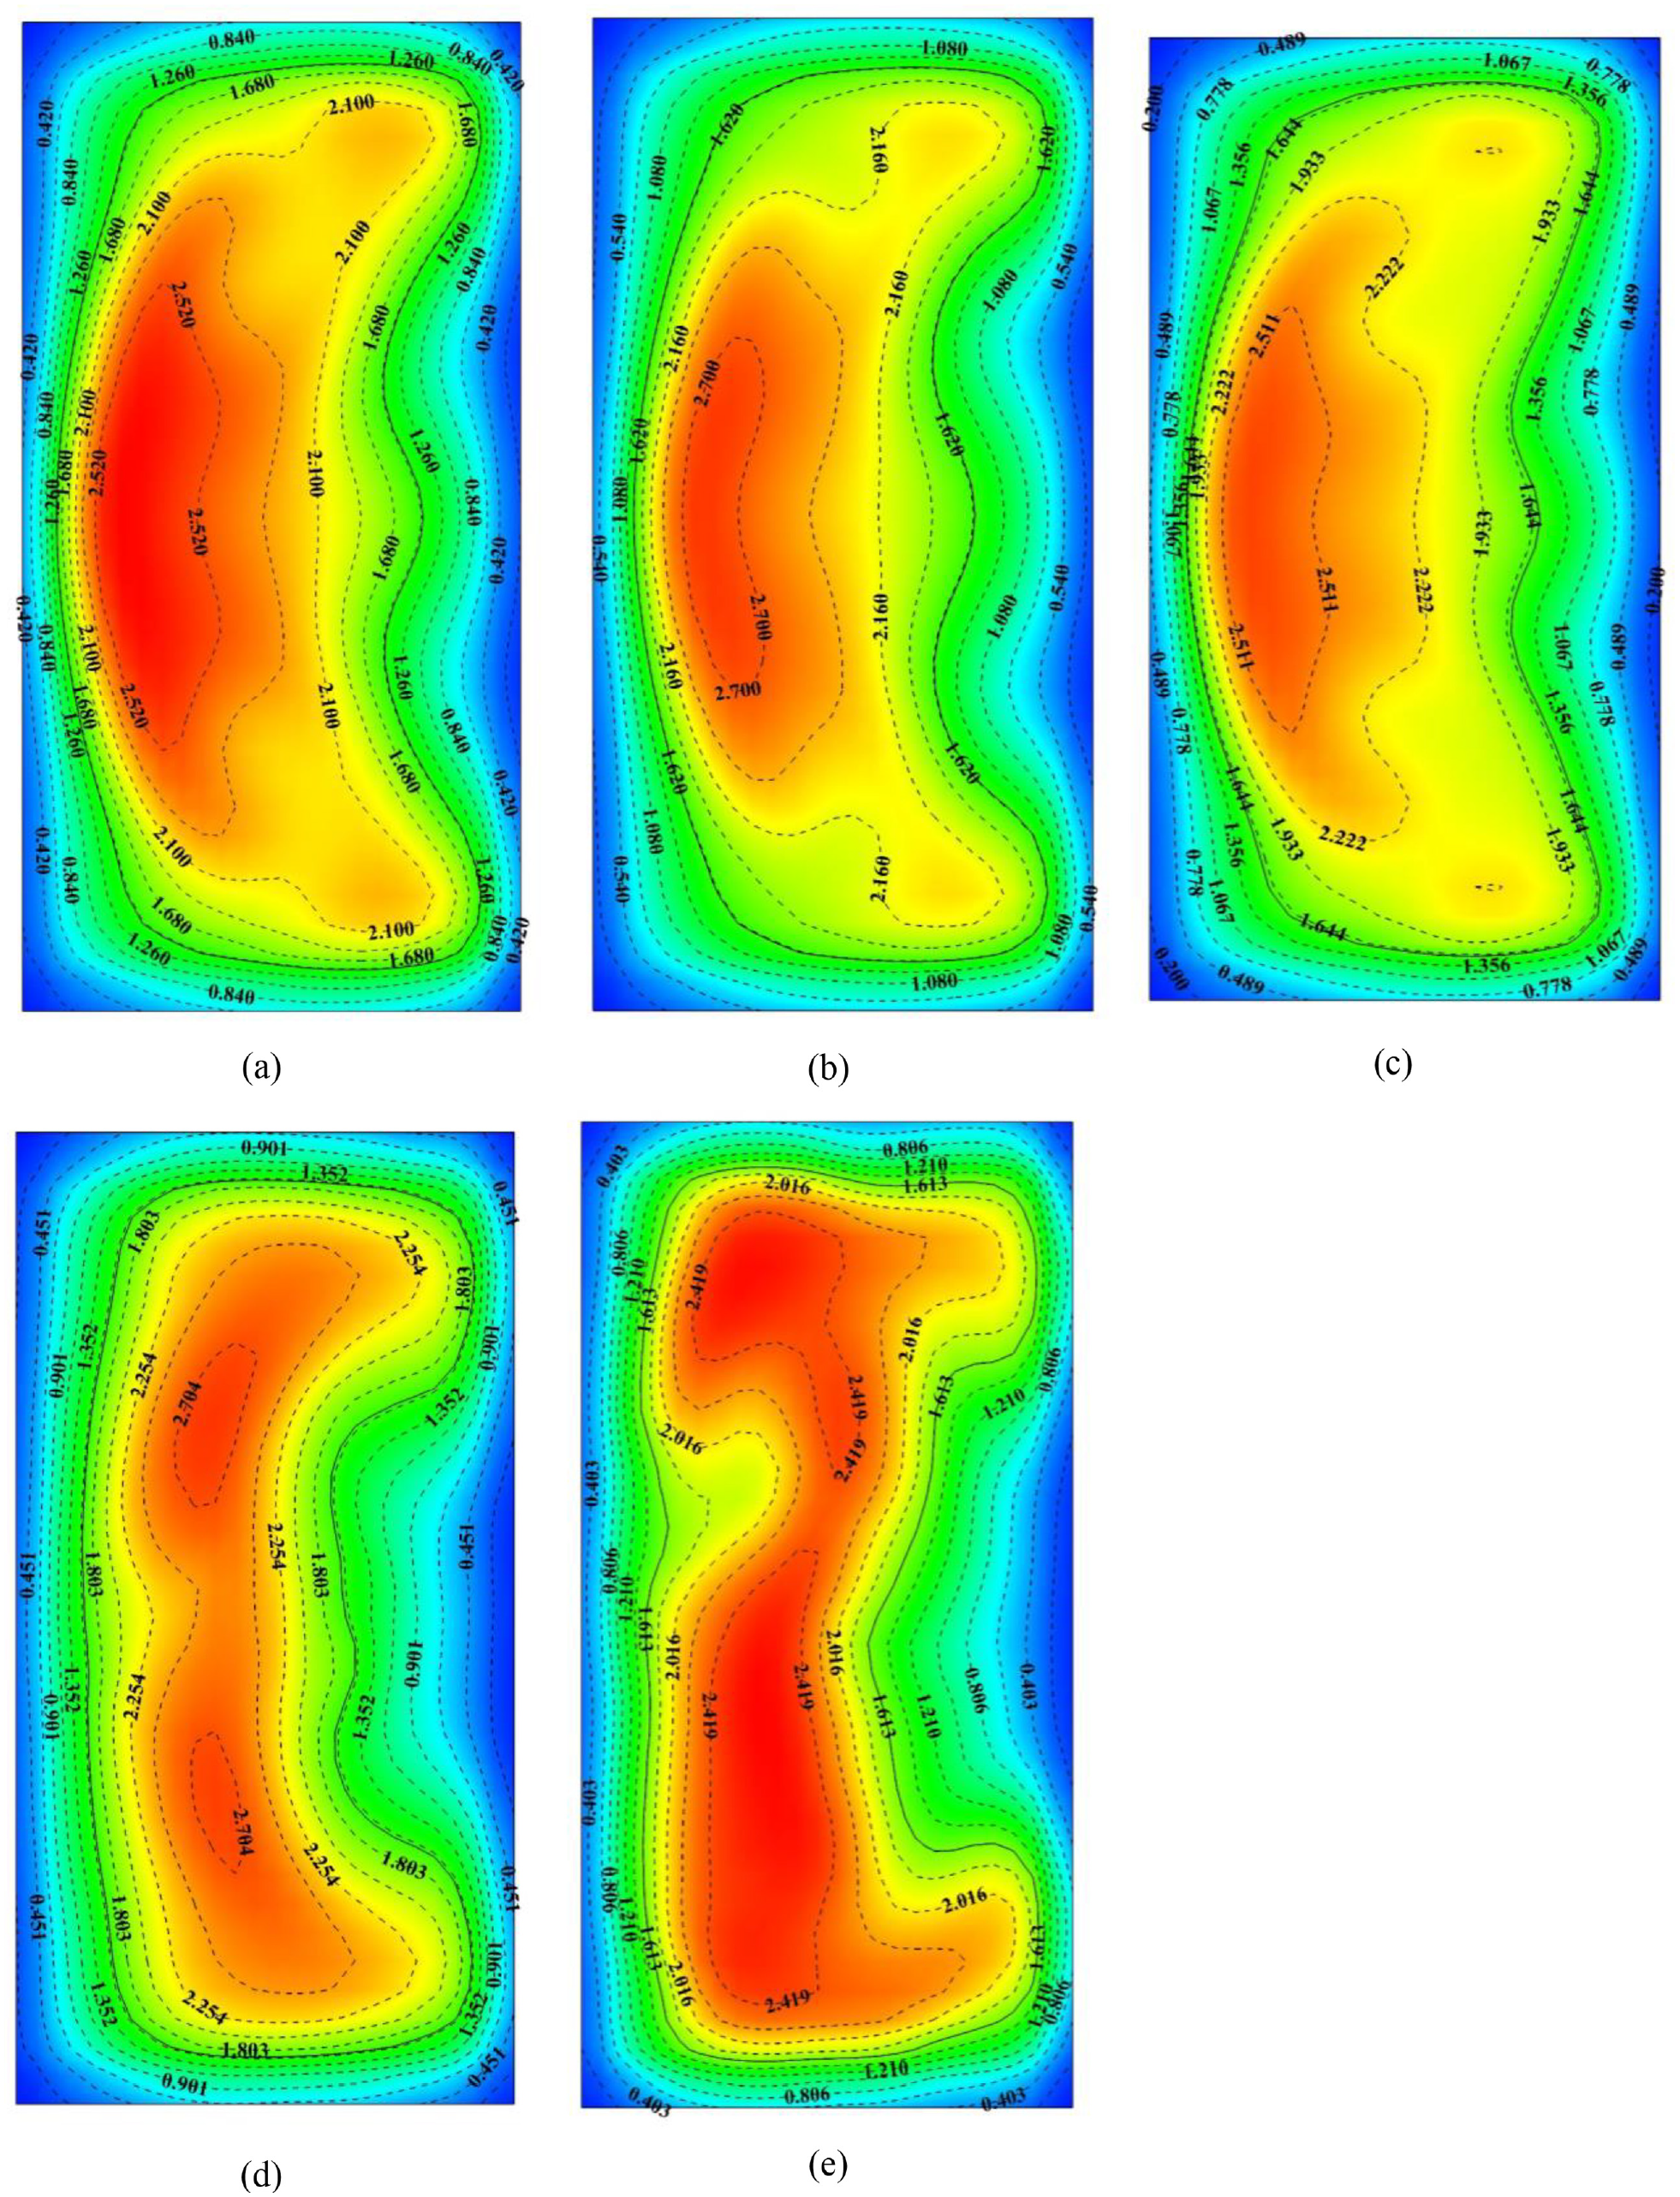
Figure 7 presents the temperature distribution across the solid and nanofluid parts of MCHS for Eulerian-Eulerian and Eulerian-Lagrangian methods in the case of Re = 702 with 0.06 CuO nanoparticle concentration, in this study. As it is observed, the temperature distribution decreased from about 311 K (310.283, 310.717, 310.358, 310.282, and 310.161 K for the single-phase, mixture, Euler, DPM, DDPM approaches, respectively) for the Solid part on the bottom surface of MCHS, the boundary of applying heat flux, to about 309 K (309.157, 309.592, 309.233, 309.157, 309.035 K for the single-phase, mixture, Euler, DPM, DDPM approaches, respectively) close the adiabatic surface at the top solid boundary. This change for the nanofluid flow part is from about 309 K (309.691, 310.125, 309.765, 309.690, 309.569 K for the single-phase, mixture, Euler, DPM, DDPM approaches, respectively) at the conjugate surfaces to about 304 K (304.672, 304.778, 304.655, 304.484, 304.349 K for the single-phase, mixture, Euler, DPM, DDPM approaches, respectively) at the top surface. Of course, these trends for the Eulerian model are less than the others. The isothermal lines are shown by dash lines in these contours. While the thermal boundary layer is depicted by a solid line across the channel. As is seen in Figure 7, there is no thermal boundary layer formed for the adiabatic surface because there is no temperature gradient in the top boundary. The thin thermal boundary layer of the substrate conjugate surface can be justified by the more heat flux on the channel substrate. Consequently, the thickness of the thermal boundary layer is less and the flow will be developed at less distance from the substrate in the Z-direction. Also, the wave-shaped channel drives the flow to the special areas of the cross-section (maximum amplitude). Also, it is seen that there are more streamlines in the adjacent of these areas. Additionally, the thickness of the thermal boundary layer is thin in these areas.

Contours of temperature (K) in the solid and fluid part in the case of
Changes in friction factor based on Re are observed in Figure 8. In the 0.06 of CuO concentration. Almost in all approaches, it is shown that a considerable decrease in friction factor occurs by increasing Re, which this reduction is greater in the low Res. For example, the friction factor value decreased by around 4.5% and 1.3% by increasing in Re from 304 to 397 and 702 to 794, respectively. Meanwhile, in DPM approach the reduction trend was different in some of the cases. In the case of Re 589, the Re was unjustifiable in comparison to the other methods. In addition, it is necessary to note that these changes in friction factor parameter versus the Reynolds and CuO nanoparticle concentration along the channel and in different cross-sections were similar to the other cases. Also, a significant difference was observed (about 6.8% and 3.05% in comparison to the other methods despite of DPM model). In detail, the friction factor for Re = 304 obtained about 0.2606, 0.3281, 0.3327, 0.2876, 0.3159 reduced to about 0.1456, 0.1856, 0.1844, 0.1763, 0.1767 in the case of Re = 794 for the 0.06 CuO nanoparticle concentration via single-phase, mixture, Euler, DPM, DDPM approaches, respectively. Moreover, by adding more nanoparticles in the working fluid, more friction factor is extracted. As is seen in Figure 8(b), the single-phase and DPM models presented different trends in contrast to the other models. The friction factor in the single-phase model was independent of the nanoparticle concentration. While the obtained value in the DPM model was different, the other models lead to closer results. For example, at Re = 589 in 0.01 of concentration, the friction factor extracted 0.1693, 0.1778, 0.1801, 0.1668, 0.1776 in contrast to 0.1693, 0.2160, 0.2187, 0.1846, 0.2103 for 0.03 of concentration for the single-phase, mixture, Euler, DPM, and DDPM approaches, respectively. The variations in different models differ in terms of the changes in nanofluid modeling, as indicated by the disparities between the single-phase and two-phase models.

Changes in the friction factor (a) in different approaches for
Due to the presented approaches in this paper to simulate the nanofluid flow, various nanofluid velocity profiles were extracted in the both Y and Z direction in different cross sections. The velocity distribution in the 12.5 mm (at

Changes in the nanofluid velocity distribution in the case of
The velocity contours for Re = 702 with 0.06 CuO nanoparticle concentration in the single-phase, mixture, Eulerian, DPM, and DDPM models across the
Contours of the velocity (m/s) distribution in the case of
The CuO nanoparticles distribution in the wavy channel cross-section is another important parameter in this study. Figure 11 shows the particle scattering of the 0.06 CuO concentration at Re = 794 in the width and height of the middle cross-section of the channel. There is no access to the nanoparticles scattering in the single-phase model. Also, obtained results present the changes in the nanoparticle distribution via Eulerian-Eulerian approaches (mixture, Euler) so close. Whereas there were small changes in the micro-scale in the Eulerian model which are shown in Figure 11. On the other hand, the CuO nanoparticles concentration scattered in the wide range via Eulerian-Lagrangian approaches (DPM and DDPM). The obtained data shows these changes from 0 to 0.1224 via the DPM model in comparison to 0 to 0.2206 via the DDPM model in the width of the section. In this section, the particles dispersed around 0.06198 and 0.06618 in the DPM and DDPM models, respectively, by about a 9.34% difference relative to the particles in the inlet boundary. The distribution of nanoparticles in microchannels for nanofluid flow using two-phase models can be attributed to several factors. One major factor is the interplay between fluid flow and particle dynamics. In microchannels, fluid flow is significantly influenced by the channel geometry and the flow rate. As the fluid flows through the microchannel, it experiences various flow regimes such as laminar flow, transition flow, or turbulent flow. These different flow regimes affect the distribution of nanoparticles due to their varying velocities and shear forces acting on them. Additionally, the properties of nanoparticles themselves, such as size, shape, and surface charge, play a crucial role in their distribution. Nanoparticles tend to aggregate or disperse depending on their surface properties and interaction forces with the surrounding fluid. These interactions can cause agglomeration or dispersion of nanoparticles, leading to uneven distribution along the microchannel. Moreover, the presence of other forces, such as Brownian motion and thermophoresis, also affects the distribution of nanoparticles. Brownian motion causes random movements of nanoparticles due to collisions with fluid molecules, leading to diffusion-like behavior. Thermophoresis, on the other hand, is the motion of particles induced by temperature gradients, which can cause nanoparticles to migrate toward cooler or hotter regions within the microchannel. Furthermore, the boundary conditions and inlet configurations of the microchannel can also influence the distribution of nanoparticles. For example, the use of different surface coatings or functionalization can alter the interaction between nanoparticles and the channel walls, affecting their distribution throughout the microchannel. In conclusion, the distribution of nanoparticles in microchannels for nanofluid flow is influenced by various factors, including fluid flow characteristics, nanoparticle properties, interparticle interactions, external forces, and boundary conditions. Understanding and modeling these factors using two-phase models can provide insights into the distribution behavior, allowing for better control and optimization of nanofluid flow in microchannels.
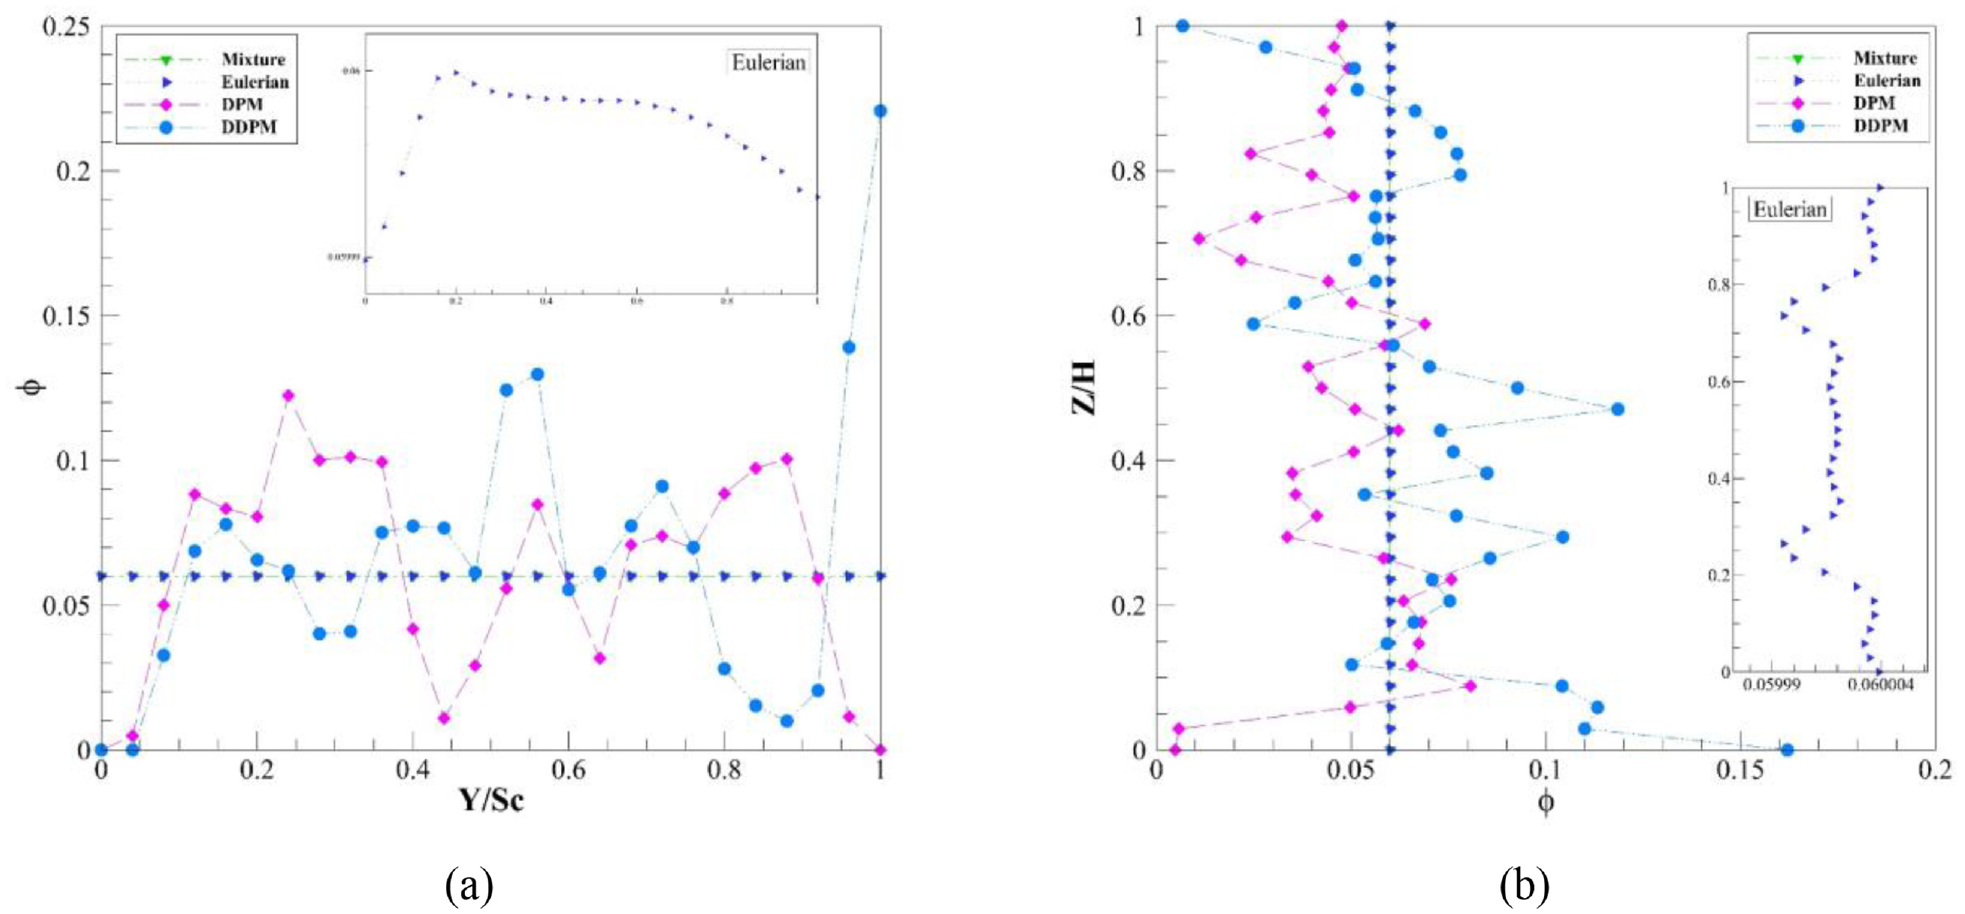
CuO nanoparticles Scattering in the case of
Furthermore, for a comprehensive comparison between the MCHS simulated approaches, the obtained results at Re = 589 are presented for different CuO nanoparticle concentrations in Tables 4 and 5. The extracted results from the presented single-phase model give close results in comparison to multiphase models, be mindful that there are no results from the nanoparticle concentration. The parameter of
Hydraulically obtained results of the MCHS at Re = 589.

Thermally obtained results of the MCHS at Re = 589.

In summary, due to the extracted friction factor in each simulated model, unexpected changes in the PEC are observed. For example, the PEC after an increase in Re = 397 decreased by about 3% in 494 of Re with 3% of CuO concentration in the DDPM approach. This trend is observed in the DPM approach by increasing the CuO concentration to 6% in Re = 702, also (see Figure 12). Due to the obtained results of the friction factor in the single-phase approach in low difference with pure water work fluid relative to the presented multiphase model, the PEC parameter extracted in higher amount. By increasing CuO concentration to 0.06 the PEC parameter increased about 1.9% on average despite in DPM approach which decreased by 2.7%. It returns to the more percentage growth in
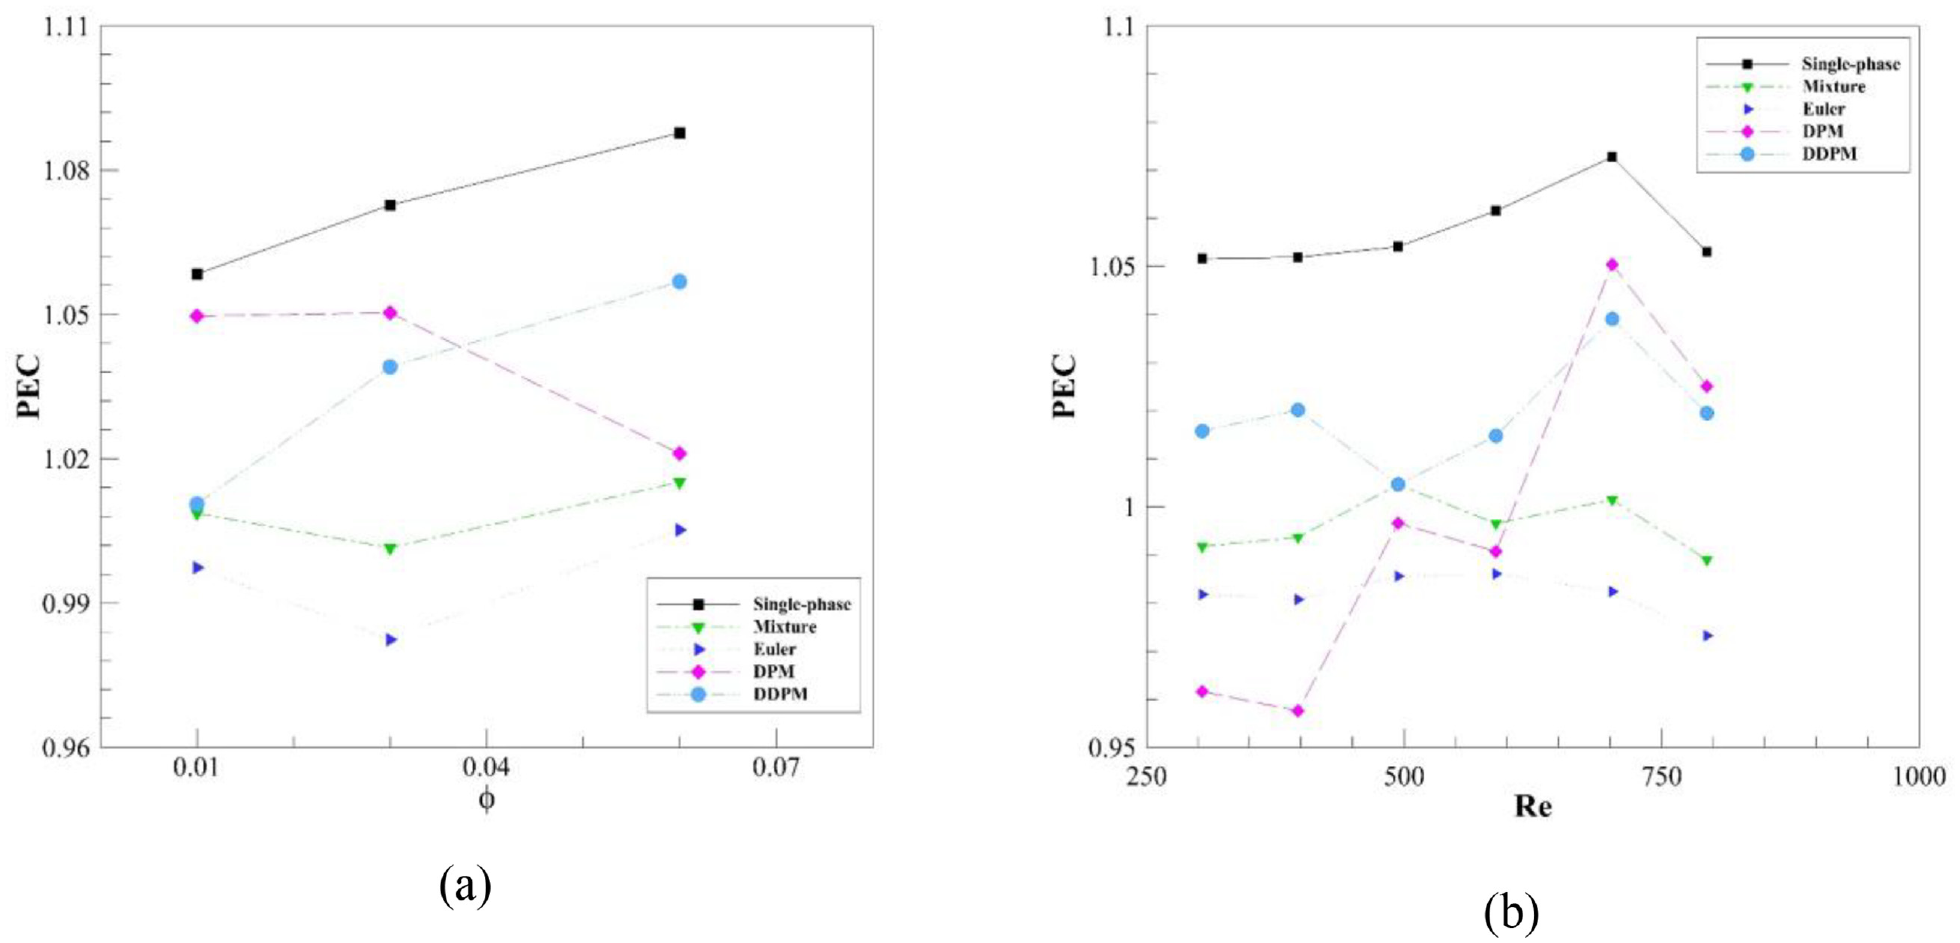
The PEC changes in all approaches (a) based on the CuO concentration in
Conclusion
The CHT model in a 3-D wavy microchannel by nanofluid as a working fluid to analyze the influence of nanoparticles on thermo-hydraulic features in a laminar flow by different models including single-phase, Mixture, Eulerian, DPM, and DDPM models are studied. In this research, the following important results are obtained:
The obtained data from the presented single-phase model depicted the acceptable data in thermal parameters, while in the flow parameters, there are differences between them.
The changes in the thermal gradient at each section along the channel can lead to oscillations in the trend of the Nusselt number.
The amount of heat flux on the substrate conjugate surface is more than the others (305 kW/m2 in comparison with 130 kW/m2), while its fluctuations domain is less.
Decreasing the temperature of conjugate surfaces along the wavy channel increases
The distribution of the temperature in the solid and fluid parts of the MCHS is presented (The acceptable match in each conjugate surface was observed).
The amount of
There were fewer changes in the CuO nanoparticles scattering in the Eulerian-Eulerian models in comparison to the Eulerian-Lagrangian models.
There are more differences (about 15%) between the particle’s concentrations in DPM and DDPM models in comparison to the mixture, and Eulerian models.
In most cases simulated in this study, more changes have been observed for Eulerian-Lagrangian (DPM and DDPM) approaches. However, the average parameters of the obtained results are almost the same
Footnotes
Appendix
Handling Editor: Sharmili Pandian
Author contributions
All authors contributed to the study conception and design. Material preparation, data collection, and analysis were performed by Farshid Marzban, Mahshid Marzban, Kazem Mohammadzadeh, and Somayeh Davoodabadi Farahani. The first draft of the manuscript was written by Kazem Mohammadzadeh and all authors commented on previous versions of the manuscript. All authors read and approved the final manuscript.
Declaration of conflicting interests
The author(s) declared no potential conflicts of interest with respect to the research, authorship, and/or publication of this article.
Funding
The author(s) received no financial support for the research, authorship, and/or publication of this article.
Data Availability Statement
No data associated in the manuscript.