
Abstract
Four optimization models were proposed to reduce the impact of pollutants from vans on themselves and surrounding vehicles. The adsorption of pollutants on the body of the van in rainy conditions and the diffusion of pollutants into the external environment were numerically investigated using the Discrete Phase Model (DPM) for vans having different wheel brow structures. The pressure distribution on the surface of the van, the surrounding flow field, and the raindrop distributions of various external positions on and around the van were analyzed and compared. The results indicated that the van with externally covered wheel brow model was most effective in inhibiting the diffusion of rainwater pollutants from the van under rainy conditions. Compared with the original model, the reduction in the polluted area was 11.19%, the reduction in the influence of the visual field on the rear vehicle was 25.4%, and the reduction in the diffusion of pollutants on the bodies of the side vehicle was 20.7%.
Introduction
When traveling in a van, a clear view of the surroundings is crucial for observing the road conditions and ensuring driving safety. However, when the vehicle is driving at high speed, severe weather can directly affect the driver’s judgment of road conditions, thereby threatening the driver’s personal safety.1,2 Especially in rainy weather, rainwater will form a water phase on the vehicle body, affecting the driver’s vision, lighting, etc., which can lead to accidents. Therefore, studying the formation mechanism and impact of vehicle pollutants is of great significance for ensuring driving safety.
For the study of vehicle pollutants, the pollutants distributions and the flow phenomenon around the vehicle have been studied by numerical simulation as well as experimental measurement. Gaylard et al. 3 reviewed the deposition of water and solid contaminants on to car surfaces is strongly influenced by unsteady vehicle aerodynamic effects, airborne water droplets falling interact with wakes, vortices, and shear flows and accumulate on vehicle surfaces as a consequence. Rodriguez et al. 4 used solid particles to study on the UFP dispersion in wake of a squareback Ahmed body, the result shows that the particle concentration is closely related to the flow topology. Gaylard et al. 5 used Very Large Eddy Simulation solver to simulate the water phase pollution at the rear of a simplified square-back model caused by wheel splash, and the study found that the deposition of pollutants at the rear of the vehicle was mainly driven by the lower part of the wake vortex. Kabanovs et al. 6 performed a preliminary simulation of the wake flow field of a vehicle using Reynolds-averaged Navier Stokes and Unsteady Reynolds-averaged Navier Stokes modeling approaches, and a water spray containing an ultraviolet dye was then injected underneath the vehicle to visualize the pollution pattern in the rear. Gaylard et al. 7 used wind tunnel testing and numerical simulations on a sports utility vehicle (SUV) and found that the rear wheels were the primary cause of rear surface pollution. Jilesen et al. 8 used a combination of experimental and numerical calculations to simulate and validate the water flow pathways on the side of the vehicle. Moreover, they analyzed the generation mechanism of the A-pillar bypass flow and elucidated the connection between the rainwater breakthrough point and the geometrical parameters of the A-pillar. Sun et al. 9 obtained the distribution of carbon monoxide concentration around the vehicle by wind tunnel experiment and field measurement, and verified the validity of the numerical simulation model. Du et al. 10 investigated the flow and adsorption characteristics of rainwater on a high-speed train using a coupled VOF–LFM multiphase computational flow model. Jilesen et al. 11 compared A-pillar aerodynamic characteristics data from environmental wind tunnel testing and numerical calculations. They analyzed the mechanism of water film generation on the side of the vehicle and investigated the effect of improving the A-pillar profile parameters on pollutants in the side water flow. Patel et al. 12 used the DPM model approach to estimate the effect of rainfall on the aerodynamic performance of vehicles. Until recently, most studies have focused on the pollutants adhering to the vehicle’s surface during its own motion and the pollutants on surrounding space which may affect neighboring vehicles have not been concerned. However, in actual road conditions, vans driving in rainy weather will generate a large amount of spray clouds, which reduces the visibility of other drivers and causes accidents. 13 Therefore, to ensure driving safety, apart from considering the impact of pollutants on the vehicle itself, the impact of pollutants on surrounding vehicles should also be considered, thus motivating the present work. In the selection of calculation model, the DPM model provides an effective computational approach for studying the motion of particles in space.14,15 Utilizing the DPM model allows for the extraction of the motion trajectories of pollutant particles from measured flow fields.
To reduce the impact of pollutants from vans on themselves and surrounding vehicles, vans having different wheel brow structures are proposed and the DPM model is employed to evaluate the impact of different wheel brow designs on the splatter and dispersion of surface pollutants on vans and their vicinity. Firstly, an analysis is conducted based on numerical results and the van’s streamlines with respect to the adsorption of self-pollutants. Secondly, in conjunction with 3D streamline, an analysis of the affected regions in the visibility of trailing vehicles at different following distances is carried out. Finally, utilizing velocity cloud on the vehicle’s side, an assessment is made of the contamination on the side of adjacent vehicles, including their body and window areas.
Numerical methods
Numerical simulation
In this study, the realizable k–ε turbulence model 16 was selected to simulate the pollutant distribution and dispersion around the van for different wheel brow structures. The particle collision and volume were not considered, and the DPM model was selected for precipitation simulation. The governing equations are as follows:
Mass conservation
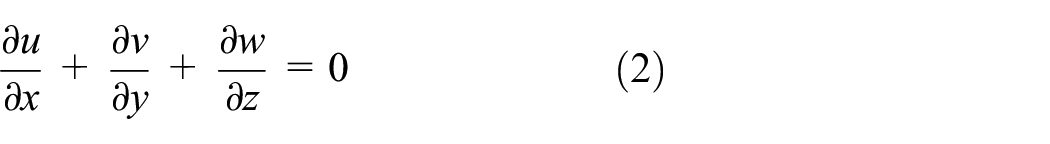
The mass conservation equation is also known as the continuity equation, and it is expressed as follows:
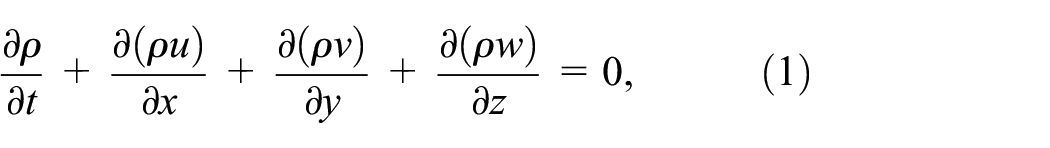
where
Momentum conservation
The momentum conservation equation represents the principle of momentum conservation – that is, the rate of change of the momentum of a fluid unit with respect to time is equal to the sum of the external forces on the fluid unit. Equations (3)–(5) express the momentum conservation in the x, y, and z directions, respectively.

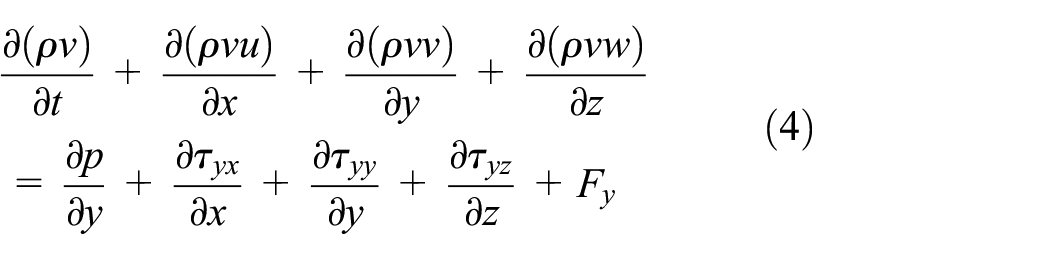

Here, p is the pressure, and
Turbulence model
The transport equations for the realizable k–ε turbulence model with turbulent kinetic energy k and turbulent dissipation rate ε are expressed in equations (6) and (7).


Here,
Equation of particle motion
The DPM model calculates the trajectory of the discrete phase particles by the motion equation of the discrete phase particles under the Lagrange reference system. Equation (8) represents the motion equation of discrete phase particles.

Here,

Here,
Geometric model and mesh generation
This study focused on the adsorption and diffusion of rainwater pollutants on the exterior surface of a van. Certain external components of the van were simplified with the assumption that the numerical results would remain unaffected. In addition, the chassis of the vehicle was flattened, which improved the efficiency of numerical calculations.17,18 Figure 1 shows a Schematic diagram of the original model (Figure 1(a)) and improved model (Figure 1(b)–(d)) of van, here, the following improved profile designs for suppressing the spread of external rainwater pollutants from the van were considered in this study.
The mudguard wheel brow was installed behind the wheels to prevent the wheel chambers of the van from splashing pollutants outwards (Figure 1(b)).
The fully covered wheel brow was installed above the wheels of the van to inhibit the external airflow from directly entering the wheel chamber of the van from the front (Figure 1(c)).
The externally covered wheel brow was installed above the wheels of the van to increase the transverse space of the wheel chamber and prevent the pollutants in the wheel chamber from affecting the bodywork (Figure 1(d)).
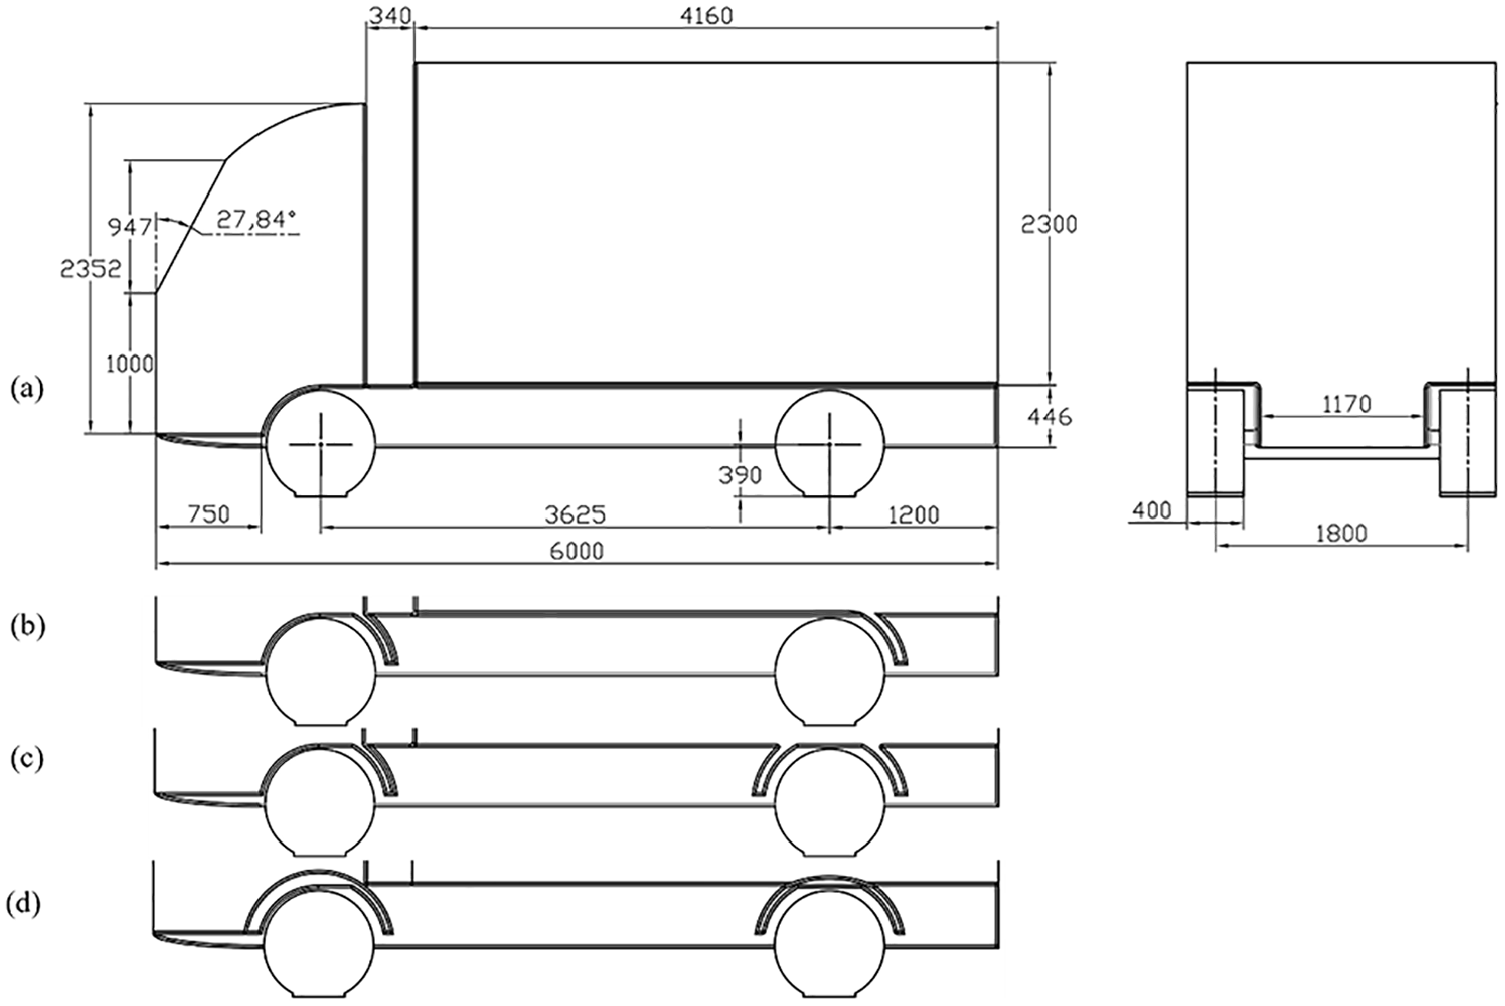
Schematic diagram of the original model and improved model of van: (a) original van model, (b) mudguard wheel brow van model, (c) fully covered wheel brow van model, and (d) externally covered wheel brow van model.
To avoid collision between the wheel brow and front wheels of the van when turning, the maximum width of the externally covered wheel brow cover should not exceed the width of the entire vehicle. Therefore, an externally covered wheel brow extending outward by 50 mm from the side of the van body was designed. In addition, an externally covered wheel brow with grooves was designed to examine the influence of the edge contour of the wheel brow on the suppression of pollutant diffusion. As shown in Figure 2, the two externally covered wheel brow designs differ primarily in the shape of the wheel brow edge – the edge of the original externally covered wheel brow is straight, and that of the grooved externally covered wheel brow is curved (Figure 2(b)). Moreover, in addition to restricting the diffusion of pollutants inside the wheel chamber of the van, the curved edge design effectively minimizes the flow of rainwater pollutants adhering to the inner wall of the wheel chamber onto the bodywork. In this paper, models a, b, c, d, and e denote the original model, the mudguard model, the fully covered model, the externally covered model, and the externally covered model with grooves, respectively.
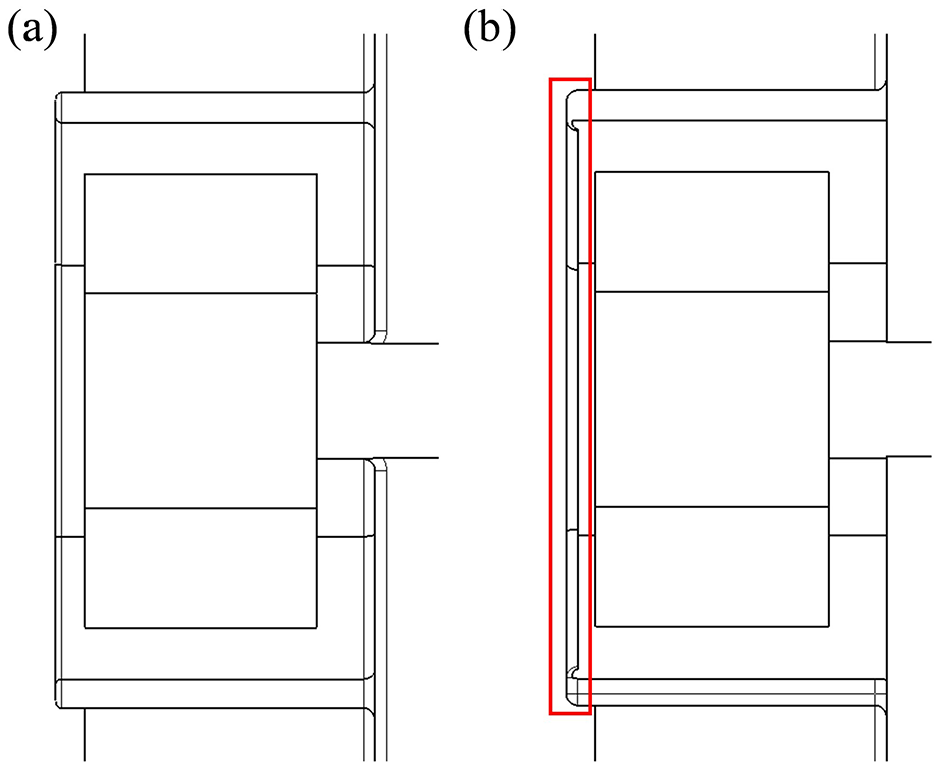
Partial view of the wheel chamber with an externally covered wheel brow: (a) original externally covered wheel brow and (b) externally covered wheel brow with grooves.
The computational domain was a rectangular volume with length, width, and height of 96, 30, and 30 m, respectively (Figure 3). The vehicle was mounted 30 m downstream of the front boundary of the domain.

Computational domain.
The computational model employed an unstructured hybrid grid generated by ICEM software. A high-quality triangular mesh was generated on the surfaces in the domain, such as the body of the van and the ground. In addition, a vertical three-layer boundary layer mesh was generated, and the height of the first layer of the mesh was 6.4 e−4 m. To guarantee the continuous flow of rainwater and sand pollutants in the flow field and collect the distribution data associated with different media, three layers of encrypted box grids with different densities were established in the body and the rear of the van (Figure 4).

Discretization of the flow field.
In this study, five different grid sizes were used to verify grid independence (Figure 5). As the number of grid points increased from 4,533,550 to 8,502,342, the variation in the reduction of the aerodynamic drag coefficient and lift coefficient of the van was larger. This suggested that the number of grids had a significant effect on the simulation results. However, with a further increase in the number of grid points, the drag and lift coefficients remain essentially unchanged. Considering the calculation accuracy and cost, a grid size of 12,347,264 was used for modeling and numerical calculations.

Verification of grid independence.
Boundary conditions
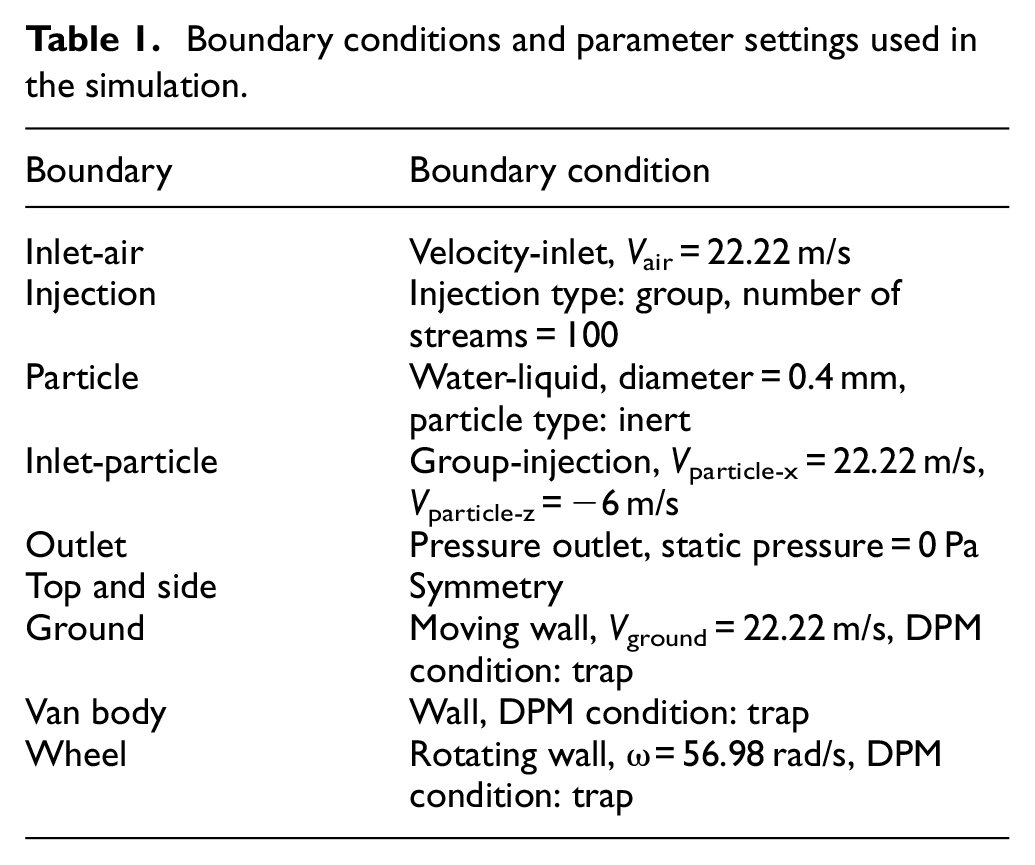
In the present study, the numerical simulation is conducted by ANSYS Fluent software. The following boundary conditions were used in the simulation: the inlet was divided into an air inlet (inlet-air velocity) and a discrete-phase inlet (inlet-particle), and the outlet was set as a pressure outlet (static pressure of 0 Pa). Further, to eliminate the influence of the wall surface on the simulation results, the ground surface was set as a moving wall, the top and sides as symmetric walls, the van body as a fixed wall, and the wheels as rotating walls. The rotational angular velocity of the wheels was determined based on the wheel diameter and speed of the van by establishing two independent coordinate systems corresponding to the front and rear wheels. In addition, to ensure the stable spraying of liquid discrete-phase particles, an 8M × 10M discrete-phase spraying plane was set up 5 m in front of the van, and the spraying surface comprised 100 × 20 spraying points to form a discrete-phase spraying array. The precipitation of the rainwater jet plane was set to 1 kg/h, and the diameter of the raindrops was 0.4 mm. The boundary conditions and initialization settings are listed in Table 1. A computer with 32 cores and 64 threads is adopted to perform numerical simulation and the calculation time is about 84 h for each case.
Boundary conditions and parameter settings used in the simulation.
Results and discussion
Effect of different models on discrete adsorption of rainwater from bodywork
To evaluate the effect of different models on discrete adsorption, parameters involving particle accretion, quantified pollutant adsorption and streamlines distributions are analyzed in the present study. Figure 6 shows a comprehensive illustration of rainwater discrete-phase particle adhesion distribution on the side of vans. In the Rainbow color scale, the trend from blue to red represents the degree of rainwater discrete-phase particle adhesion in that area, with red indicating the highest concentration and blue indicating the lowest. As shown in Figure 6, for all models, the areas of contamination on vans primarily concentrate on the upper portion of the cab and the cargo box above the rear wheels. By examining the streamlines, it becomes evident that around the cargo box above the rear wheels, the streamlines exhibit a concentration trend, aligning with the adhesion of rainwater in the cargo box area. Based on the distribution of adhered rainwater discrete-phase particles and the comprehensive flow field streamline patterns, it can be observed that the models b, c, and e (Figure 6(b), (c), and (e)) have little effect on reducing the adhesion of rainwater to the entire vehicle. For the case of model c (Figure 6(c)) featured by fully covered wheel brow designs, has a limited impact on rainwater adhesion to the van’s chassis. Focusing on Model d (Figure 6(d)), it can be observed that the externally covered wheel brow effectively reduces rainwater adhesion to the cabin, the area behind the rear wheels, and the cargo box.
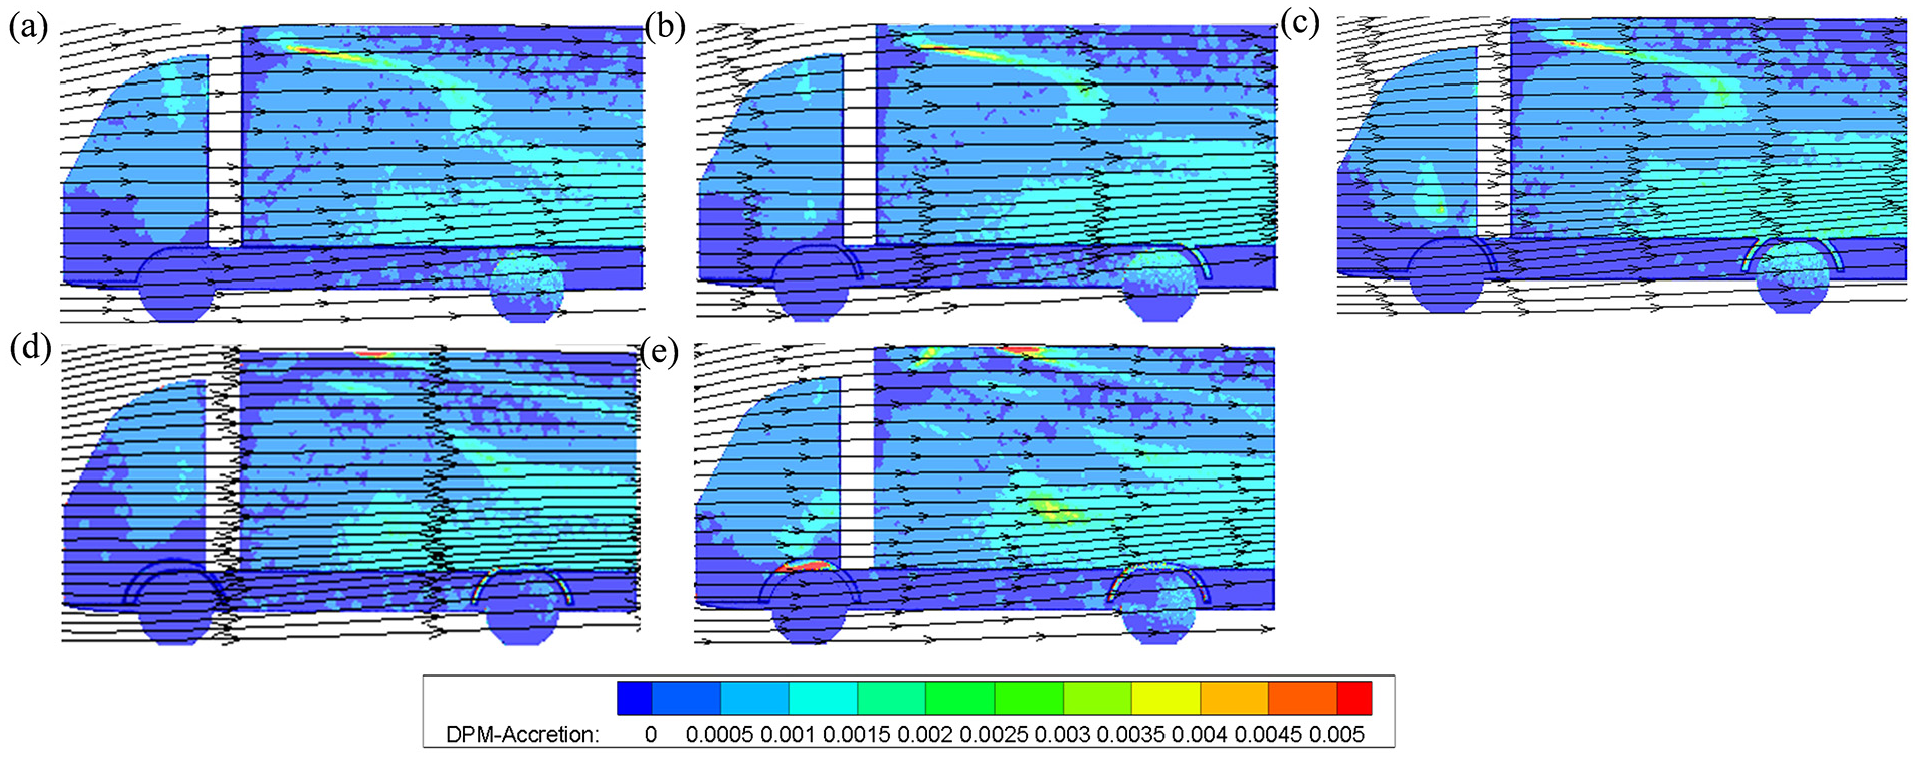
Rainwater adsorption and stream lines on the side surface of van (XZ plane): (a) model a, (b) model b, (c) model c, (d) model d, and (e) model e.
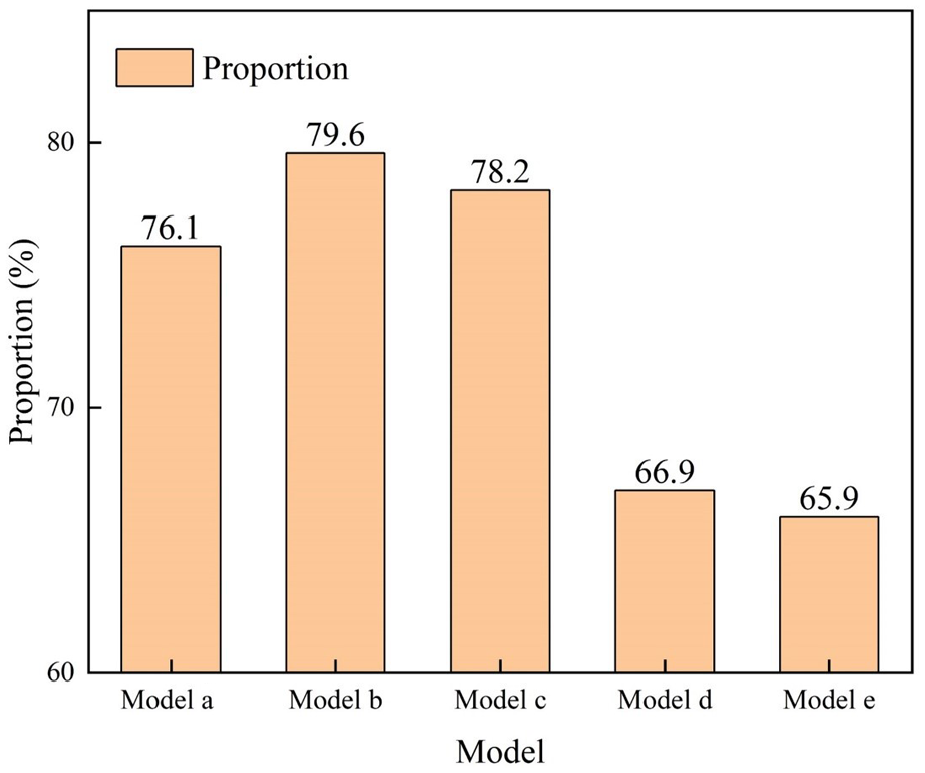
To better quantify the rainwater pollutants on the van body, OpenCV-Python is used to process the discrete phase distribution map, and the range of Hue, Saturation, and Value is defined to obtain the number of pixels in the pollution area in the image. 19 The pixel data of the discrete-phase rainwater adsorption region on the surface of the van was analyzed by the ratio of the number of pixels in the pollution area to the total number of pixels of the vehicle. As shown in Figure 7, the model c has little effect on the inhibition of their own rainwater pollutant adsorption. For the cases of model b and e, the pollutant proportions even exceeding that of the original model a. For model d equipped with externally covered wheel brow, it exhibits a lower percentage of self-adhered rainwater pollutants compared to other models, with a reduction of 6.2% compared to the original model.

Percentage of rainwater pollutants on the van body for different wheel brow designs.
By analyzing the streamline distributions shown in Figure 6, it can be inferred that the possible reason for this phenomenon is that the spiral centers of the wheel attachments of model b and e are located in the upper region of the wheel, which causes the rainwater to shift to the position of the carriage with the high-speed airflow and pollutes the cargo box (Figure 6(b) and (e)). Considering streamlines of the van from the windward direction shown in Figure 8(d), the reduction of rainwater adhesion can be attributed to the fact that the flow field streamlines around the van with externally covered wheel brow exhibit lower spiral centers near the wheels. This implies that the design of the external fenders can more effectively push down the high-speed airflow near the wheels, thus reducing the spread of rainwater toward the cargo area and effectively decreasing rainwater adhesion to the vehicle’s surface.

Windward side and streamlines around the van (YZ plane): (a) model a, (b) model b, (c) model c, (d) model d, and (e) model e.
Analysis of pollution in the rear of the van
As is known, the family cars are more likely to be affected by the pollutants generated by vans, therefore, this study focused on the pollutant distribution within the sight of the family car driver. The sight of the family car driver is typically 1–1.3 m above the ground level, and the width of the field of view equals the width of the front windshield. In the present study, the external pollutants are defined as follows: the length is measured from the windward side (starting point) to the back of the cargo box of the van and ranges from 11 to 13 m, and the height ranges from 0.8 to 1.7 m; the width is 0.75 m from left to right.
The mass concentrations of discrete-phase rainwater particles on the central streamwise plane (Y = 0 m) are presented in Figure 10, the black box indicated in Figure 9(a) represents the cab area of the rear car. Focusing on model d and e (Figure 9(d) and (e)), the rainwater exhibits a clear cyclotron motion at the rear of the van cargo box, indicating that the wake vortex at the rear of the box influences the reverse flow of rainwater toward the van. In addition, compared with the other models, it can also be clearly found that the rainwater flow above the rear of the cargo box of the model d and e have changed significantly from the regular streamlined raindrop movement to the ruptured raindrop movement, forming a small mass of fog-like raindrops behind the vehicle. This effectively reduces the pollution of large raindrop particles in the rear of the vehicle, and the backwash effect is more apparent.

Mass concentration of discrete-phase rainwater particles on the central streamwise plane (Y = 0 m): (a) model a, (b) model b, (c) model c, (d) model d, and (e) model e.
Figure 10 shows the proportion of rainwater in cab area of the rear car. For the case of model b and c, adverse effect on the rainwater suppression of the rear vehicle is observed. Combined with Figure 9(b) and (c), the reason for this phenomenon may be that when the raindrops flowing through the roof reach the rear of the van, they still maintain a high-quality dense state, and move directly to the rear due to inertia, resulting in a larger polluted area of the rear vehicle. For model d and e equipped with different externally covered wheel brow, they show a lower percentage of rainwater pollutants compared to other models, with reductions of 9.2% and 10.2% compared to the original model, respectively. Combined with Figure 9(d) and (e), the main reason is that when the large mass raindrops reach the rear of the vehicle, they are broken into small mass raindrops and are less affected by inertia, thus showing less impact on the rear vehicle.
The proportion of rainwater in cab area of the rear car.
The reason for the above situation may be that the streamlines passing through the rear of the van has changed, causing the rain particles to change their trajectory. To validate this hypothesis, Figure 11 shows 3D Streamlines at the rear of the van for different wheel brow structures. As is shown, the vortexes are formed on both sides at the rear of the van. Focusing on model d and e (Figure 11(d) and (e)), the airflow forms a more concentrated vortex at the rear of the van with the different externally covered wheel brow, restricting most of the rainwater pollutants to the rear of the cargo box. The streamlines behind models b and c (Figure 11(b) and (c)) gather in the middle, and most of the rainwater pollutants flow to the rear vehicle. By contrast, the streamlines at the rear of the model d and e diffuse toward the sides, which effectively reducing the impact of rainwater pollution on the rear vehicle.
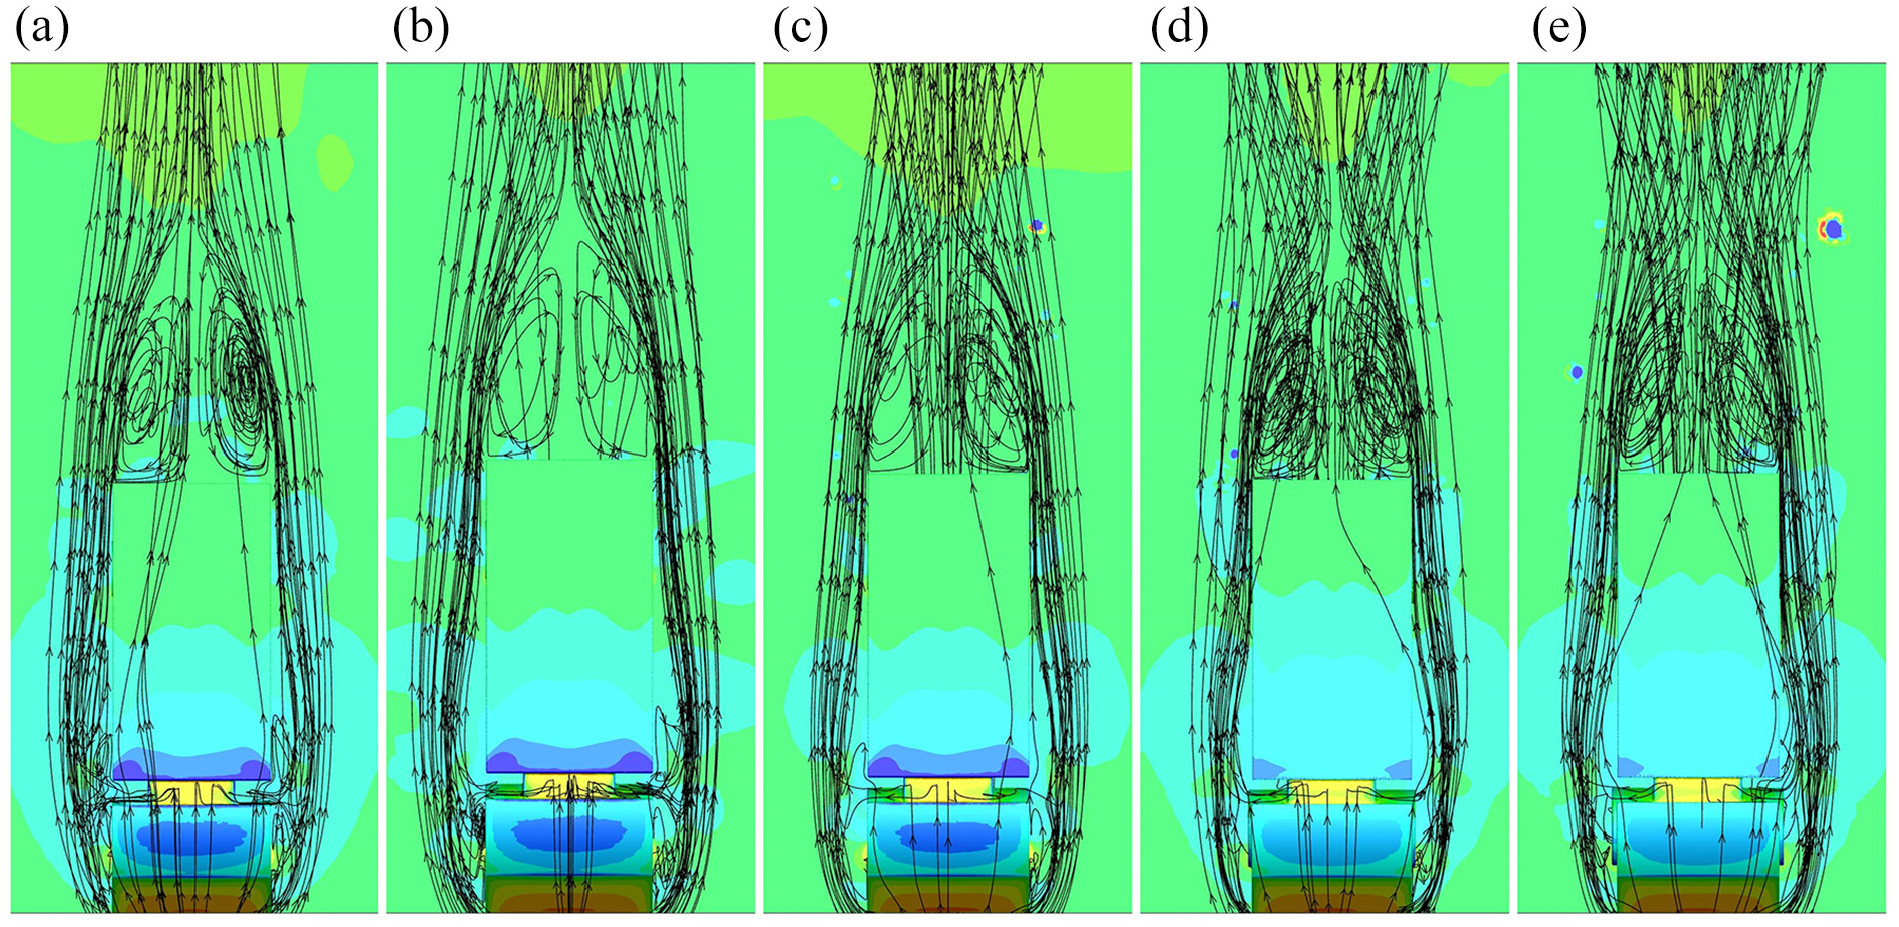
3D Streamlines in the rear of the van: (a) model a, (b) model b, (c) model c, (d) model d, and (e) model e.
To further elucidate the influence of the different wheel brow designs on the sight of the rear family car driver, pollution analyses are performed on planes X = 11, 12, and 13 m, as shown in Figure 12.

Selected surfaces for analyzing the rear vehicle pollutants.
Figure 13 shows the mass concentration of discrete-phase rainwater particles on YZ planes for different distances of the rear vehicle along streamwise direction. The black box indicated in Figure 13(a) represents the cab area of the rear car. At the location of X = 11 m, the van models with the fully and externally covered wheel brow (Figure 13(c)–(e)) effectively reduce the distribution of rainwater particles in the field of view of the rear vehicle, and the high concentration of rainwater particles above the field of view is suppressed and diffused toward the sides. At the location of X = 12 m, the concentration area of rainwater discrete phase particles descents in the horizontal position. The rear vehicle vision is greatly affected when the mudguard and the full covered wheel brow model are added (Figure 13(b) and (c)). At the location of X = 13 m, the field of view of the rear vehicle is primarily affected by broken raindrops when driving behind the van with the fully covered wheel brow (Figure 13(b)). In the van model with the externally covered wheel brow (Figure 13(d)), the distribution of rainwater droplets around the rear vehicle tends to be toward the sides.

Mass concentration of discrete-phase rainwater particles on the rear vehicle: (a) model a, (b) model b, (c) model c, (d) model d, and (e) model e.
To better quantify the impact of pollutants on the rear car, the ratio of the number of pixels in the discrete-phase raindrop distribution area to the total number of pixels in the data acquisition area is depicted in Figure 14. When the rear vehicle is 11 m away from the front of the van, the diffusion of pollution on the rear vehicle for both models with the externally covered wheel brow is markedly lower than that of the other models. The van model with the grooved externally covered wheel brow reduces the pollution on the rear vehicle by 13.8% compared with the original model, resulting in a reduction ratio of 26.2%. When the rear vehicle is in other positions relative to the van, the externally covered wheel brow can better reduce the rainwater pollution to the rear vehicle compared with the other models.

Percentage of area polluted by diffusion of raindrops in the rear of the van at different positions.
Analysis of environmental pollution on the side of the van
In most cases, the vehicle maintains a side-by-side position with vehicles in adjacent lanes during driving. Therefore, it is desirable to study the influence of raindrop pollutant diffusion caused by vans on side vehicles. In the present study, the pollutants are collected at the planes of X = 4, 5, and 6 m, respectively, as indicated in Figure 15.

Selection of positions of side vehicles.
Figure 16 shows the distribution of raindrop mass concentration when the front windshield of the side vehicle is 4, 5, and 6 m away from van head. Considering the distance of at least 0.5 m between the vehicle and the vehicle in the adjacent lane during driving, the black box indicated in Figure 16(a) represents the cab area of the side car, which may be highly affected by adjacent van during driving. Overall, the four models can effectively inhibit the lateral diffusion of rainwater particles. It has a similar effect on inhibiting rainwater when the mudguard and the full covered wheel brow model are added (Figure 16(b) and (c)), the large areas of rainwater still spread to the side. In the van model with the externally covered wheel brow (Figure 16(d)), the rainwater particles are largely suppressed within 0.5 m of the side body of the van, reducing the impact on the side vehicle vision.

Degree of pollution diffused by raindrops at different positions on the side of the van (Y = 1.6 m): (a) model a, (b) model b, (c) model c, (d) model d, and (e) model e.
To better quantify the impact of pollutants on the side car, the ratio of the number of pixels in the discrete-phase raindrop distribution area to the total number of pixels in the data acquisition area is depicted in Figure 17. It can be intuitively found that when the side vehicle drives to 5 m from the front of the van, it is most affected by rainwater pollution. On the inhibition of pollutants, the influence of the four models on the pollutants of the side vehicle is lower than that of the original model. The van model with the non-grooved externally covered wheel brow results in a smaller pollutant area on the car than that of the other models. When the car on the side is driven at a distance of 4 m from the front of the van, the diffusion of raindrop pollutants from the van model equipped with the non-grooved externally covered wheel brow is reduced by 11.6% compared with that of the original van model, and the reduction ratio is 14.8%. When the car on the side is driven at distances of 5 and 6 m from the front of the van, the reductions of 20% and 4.6% and reduction ratios of 20% and 6% compared with the original van model, respectively. Among the three locations, When X = 5, the installation of the wheel brow can make the side vehicle greatly improved by the influence of pollutants. When X = 6, the installation of the wheel eyebrow has no obvious improvement on the pollutants, which indicates that as the position of the side vehicle is more backward, the function of the wheel eyebrow in inhibiting the splash of pollutants becomes weaker.

Percentage of area polluted by raindrop diffusion for different side vehicle positions.
To further analyze the splash of pollutants on the side, velocity magnitude distributions of different models are considered in the present study. Figure 18 shows the velocity magnitude contours on the van surface. Evidently, the airflow near the van is primarily divided into the cockpit area, the cargo box area, and the bottom of the van, including the front and rear wheels. The flow velocity of the van models in the cockpit area is similar, and it gradually increases from the cockpit contour to the center. In the cargo box area, the models equipped with the grooved and non-grooved externally covered wheel brow have a lower flow velocity above the leftmost side of the cargo box, which reduces the overall flow velocity above the cargo box. By contrast, the flow velocity of the different models in the bottom of the van differed considerably. In the original model and the models equipped with the mudguard and fully covered wheel brows, the flow velocity is lower at the bottom of the van, with a large spatial span. The airflow velocity behind the rear wheels of the van model with the non-grooved externally covered wheel brow is markedly lower than that of the other models. The lower airflow velocity limits the kinetic energy of the water mist, thereby effectively reducing the movement of the mist to the sides.

Velocity magnitude contours on the van surface (Y = 1.1 m): (a) model a, (b) model b, (c) model c, (d) model d, and (e) model e.
Conclusions
This study elucidates the impact of rainwater pollutants on vans and external vehicles in rainy conditions. Specifically, the effects of pollutants on vans with different wheel brow structures on themselves and external vehicles at different relative positions are comprehensively examined using the discrete-phase method and image processing technology. The conclusions are summarized as follows.
(1) The DPM model provides an intuitive approach to study the splashing characteristics of rainwater particles around vans, and use pixel analysis method is helpful to obtain the quantitative information of pollutant concentration.
(2) When the van travels at 80 km/h in rainy conditions, the pollution is primarily concentrated in the upper part of the cab and the part of the cargo box above the rear wheels of the van. The van with the externally covered wheel brow structure shifts the spiral center near the wheel downward, affecting the trajectory of rainwater pollutants and reducing the spread of rainwater to the cargo box and cab.
(3) The pollutant distributions in the rear of the van indicates that the van models with the grooved and non-grooved externally covered wheel brows reduce the diffusion of pollutants to the rear vehicle compared with the other models. When these two types of vans are in motion, the airflow forms a more concentrated vortex near the rear of the vehicle, which effectively inhibits the diffusion of pollutants to the rear vehicle.
(4) The distribution of pollutants on the side of the van shows that the airflow velocity behind the rear wheel of the van model with the externally covered wheel brow is significantly reduced, which effectively reduces the movement of pollutants to the side. At the same time, as the position of the side vehicle becomes more backward, the role of the wheel brow in inhibiting the splash of pollutants becomes weaker.
In summary, the present study extends the influence of van water pollutants to the other vehicles, and obtains the optimal spoke structure to inhibit the diffusion of pollutants, which provides a new insight for van body design aimed at road safety. At present, only the van model and the structure of the wheel brow are considered. Future research will further discuss the laws of pollutant diffusion in different types of vehicles under different driving conditions, and will not be limited to the improvement of the wheel brow structure.
Footnotes
Handling Editor: Aarthy Esakkiappan
Author contributions
Yu Shi: Investigation, Validation, Writing – original draft. Dan Zhang: Supervision, Funding acquisition, Writing – review & editing. Yan Zheng: Conceptualization, Funding acquisition, Writing – review & editing. Lanchun Zhang: Visualization, Writing – review & editing. Tianbo Wang: Methodology, Writing – review & editing. Jun Yang: Validation, Writing – review & editing.
Declaration of conflicting interests
The author(s) declared no potential conflicts of interest with respect to the research, authorship, and/or publication of this article.
Funding
The author(s) disclosed receipt of the following financial support for the research, authorship, and/or publication of this article: The authors wish to acknowledge the following financial support: National Natural Science Foundation of China (Grant No. 11802108), Science and Technology Project of Changzhou (Grant No. CE20220066 and Grant No. CE20230021), and Major Basic Research Project of the Natural Science Foundation of the Jiangsu Higher Education Institutions (Grant No. 22KJB580002).