
Abstract
The study of loaded meshing characteristics and dynamic behavior is significant for evaluating the stability of hypoid gear under actual working conditions. Loaded tooth contact analysis (LTCA) of a hypoid gear drive under different loads is carried out. The equivalent meshing force, loaded transmission error (LTE), comprehensive elastic deformation, and time-varying meshing stiffness (TVMS) are investigated. Results show that the LTE and TVMS are sensitive to load, and the LTE and TVMS curves show obvious asymmetric as the load increases. Under low load conditions, the actual contact ratio increases significantly with the increase of load, but tends to be flat when the load reaches a certain range. The obtained TVMS and LTE are fitted by higher Fourier series and introduced into an 8-DOF dynamic model. By comparing the time history diagram, phase diagram, Poincaré section, and spectrum, the dynamic characteristics of the system under different loads are contrasted. On low load condition, the system may exhibit chaotic motion in certain meshing frequency bands and damping ratio intervals. While the tooth backlash increases to a critical value, the system may change to chaotic motion from periodic motion. The results provided a basis for improving the meshing performance of hypoid gear.
Introduction
At present, the study of hypoid gears can be roughly divided into two directions. One focuses on optimizing the machining process to obtain high-precision tooth profiles.1–8 Through the static geometric contact analysis, the gear blank parameters and machine-tool settings can be optimized. Tooth surface stress, load distribution, transmission error can also be obtained by the quasi-static finite element analysis.9–15 However, the results achieved by this “static analysis” cannot fully reflect the vibration and noise levels of the gear drive during entire meshing process. Another direction focuses on establishing a multi-freedom dynamics model of the gear system. With the consideration of the nonlinear factors, such as the excitation of the time-varying stiffness, dynamic transmission error, and backlash nonlinear, the dynamics response and vibration features of the gear pair can be researched.16–25 Results obtained by this “dynamics analysis” can reflect the dynamic behavior of the gear system and analyze the causes of vibration and noise. Nevertheless, some of the nonlinear factors are generally expressed using approximate formulas, like the meshing stiffness, which may lead to inaccurate results.26,27 So far, the above two directions have usually been studied independently, so the static analysis and dynamics modeling of hypoid gears have not been well connected.
Stiffness fluctuation is one of the main excitations of the noise and vibration of gear system.28–30 Accurate determination of meshing stiffness has always been a major problem in the dynamics research of gears. For hypoid gears, dynamics studies generally established a mathematical model of the gear drive to investigate the effects of the stiffness, damping, and inertial mass on the dynamic characteristics. Among the three types of parameters, the most significant difference between the hypoid gears and the spur gears is the meshing stiffness. Main reason is that the magnitude and direction of the meshing force of spur gears can be determined easily, and there are reliable methods and empirical formulas, while the tooth profiles and meshing process of hypoid gears are both complicated. 1 During the meshing process of a hypoid gear pair, the direction of the meshing force and the position of the meshing point vary with the gear’s rotation angle and the magnitude of the load. Compared with the spur gears, it is relatively rare to study how to precisely express the time-varying meshing stiffness of hypoid gears. Up to now, the calculation of the cylindrical gears’ meshing stiffness has been generally solved. Kiyohiko derived the formulas for calculating the bending stiffness and contact stiffness of involute cylindrical gears. 31 An empirical formula for calculating the single-tooth stiffness for the stand full-depth or addendum modified involute gears was proposed by Kuang and Yang, 32 which has been widely used to calculate the meshing stiffness of spur gears.
Today, it is still difficult to measure the meshing stiffness of hypoid gears by the experimental methods, while the finite element analysis method can precisely simulate the instantaneous contact state of the gear drive. For computing the meshing stiffness of spiral bevel gears, Gosselin et al. presented a calculation method based on the finite strip theory, which obtained the displacement curves along the tooth height and tooth length direction, while no stiffness curve was achieved. 33 Mennem used the finite element method to compute the tooth contact softness under different loads and finally worked out the time-varying stiffness. 34 Wang et al. established a generalized nonlinear time-varying (NLTV) dynamic model of a hypoid gear pair and approximated the gear meshing stiffness using a constant and a triangular series. 26 Mohammadpour et al. and Karagiannis et al. calculated the meshing stiffness of hypoid gears by the finite element software CALYX. Then they simplified the meshing stiffness to a triangular series form and finally obtained the empirical formula of the meshing stiffness.35,36 Fang established a meshing model of a hypoid gear pair based on the static force state of the gears and calculated the dynamic load, while this model did not consider the time-varying characteristics of the meshing stiffness. 37 According to the basic theory of meshing stiffness, Yang et al. calculated the stiffness of a single pair of teeth, then worked out the integrated meshing stiffness of the gear pair by overlaying the stiffness of the simultaneously meshing teeth. 38
Existing finite element methods for calculating meshing stiffness of hypoid gears are generally based on measuring the elastic deformation at the calculating nodes on tooth surfaces. The bending deformation of the tooth profile and the shear deformation of the tooth root are not considered, which may result in less precise stiffness data. Obviously, the deformation of the tooth surface is called the contact deformation more suitable than the meshing deformation. Wang presented a more accurate method to calculate the meshing stiffness of spiral bevel and hypoid gears by computing the dynamic loaded transmission error and the quasi-static unloaded transmission error. 18 Since the rotation angle can be measured more precisely than the elastic deformation by the finite element method, this calculation principle is more accurate than the traditional method. In his PhD dissertation, Wang stated that this method was implemented by the Contact Analysis Program Package (CAPP), so there is no detailed description of the actual measuring process in the dissertation. This calculation method and the CAPP were also used in other scholars’ research.19,38 Among the existing literatures, the comparison of the meshing stiffness measured by the finite element method under different load conditions was rare. Besides, the reports on the accurate fitting of hypoid gears’ meshing stiffness data are also scarce.
Dynamics study can not only analyze and predict the vibration and noise levels of the gear system, but also put forward new requirements for the design and processing of the gears. The vibration performance of a hypoid gear pair will directly affect the stability and reliability of the transmission system, so it is very valuable to analyze its dynamics. Most dynamics researches usually study the effects of different nonlinear factors on the dynamic responses by establishing a multi-freedom dynamics model. Since hypoid gears’ meshing stiffness is difficult to measure and calculate, the first or second order form of the Fourier series is usually used to represent it, which may result in inaccurate analysis results. Due to the lack of research on precisely measuring the meshing stiffness of hypoid gears, it is rare to import the accurate stiffness data into the dynamics model. In addition, the analysis of comparing the influence of the meshing stiffness under different loads on the dynamics characteristics of hypoid gears is also rare now.
In this research, we give a detailed mathematical model for computing the meshing stiffness by measuring the contact forces and the dynamic and static transmission error of a hypoid gear pair. The static transmission error is calculated by the TCA method. The actual rotational displacement of the gear and the pinion under different loads can be obtained based on the post-processing results of ABAQUS software, then the dynamic transmission error under different can be worked out based on the difference value of the actual rotation angle and the theorical angle of the pinion. By using the same method to calculate the spur gears’ meshing stiffness, the reliability and accuracy of the used method are verified. In order to compare the influence of different meshing stiffness on the dynamics of the gear system, the stiffness data is fitted by an eighth-order Fourier series and imported into an 8-dof dynamics model of the gear pair. Simultaneously, the accuracy and goodness of the results fitted by the second-order and eighth-order Fourier series are also compared. By contrasting the dynamics characteristics under different loads, the effects of different meshing stiffness on the motion features of the system are compared. Through the meshing stiffness, the connection between the static analysis of the meshing teeth and the dynamics analysis of the gear system has been established in this research.
Mathematical description of the meshing parameters
Equivalent meshing force (EMF)
Due to the high transmission ratio of hypoid gear drive, there are multiple pairs of teeth generally in contact at the same time during the meshing process. As shown in Figure 1,

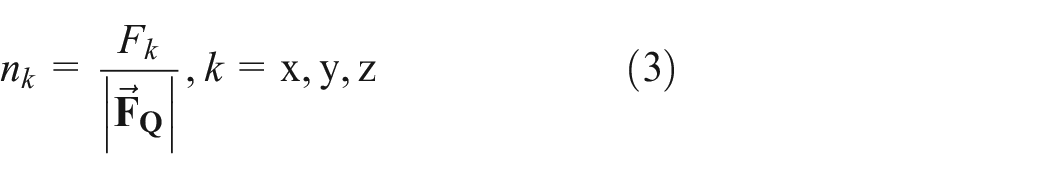
where Fx, Fy, Fz are the component of

where q is the number of the contacting tooth surfaces. The unit vector
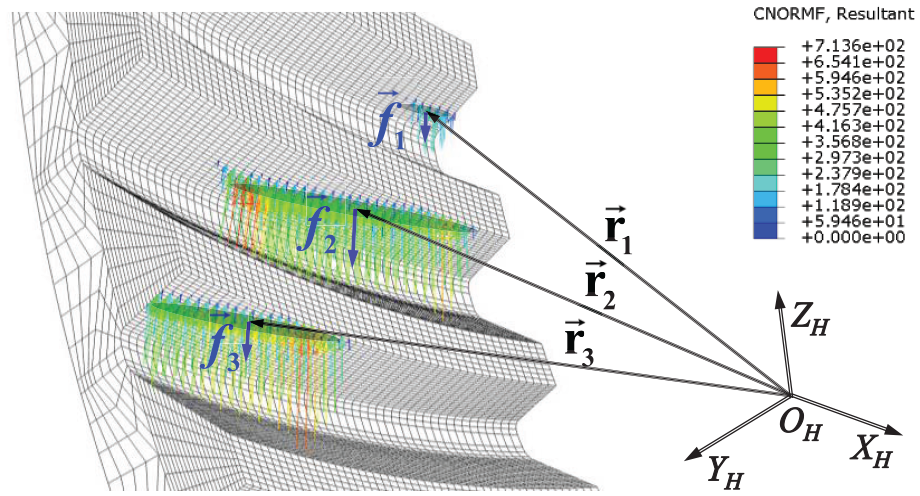
Equivalent meshing force and application points.
Equivalent meshing point (EMP)
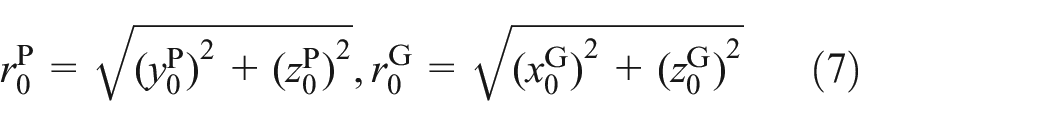
Based on the radial vector

herein, Mx and My are the torque of
Transmission error (TE)
Since the mating surfaces of hypoid gear pair are in local conjugate point contact state, the TE of the gear drive occurs inevitably during the meshing process, which is generally defined as the difference between the actual and the theoretical rotation angle of the driven gear, as follows

where zP and zG are the teeth number of the pinion and gear, respectively.
Comprehensive elastic deformation (CED)
The CED un of the contact area of a hypoid gear pair consists of the contact deformation uc of the tooth surface, the bending deformation ub of the tooth profile, the shear deformation us of the tooth, and the torsional deformation ut of the basement of the gear, that is

where the subscript p and g represent the pinion and the gear respectively. It is difficult to measure the above four kinds of deformations actually, and usually only the tooth surface contact deformation uc can be directly extracted from the LTCA results, which is generally used as the elastic deformation of the gear pair in some previous studies.
In order to obtain un more precisely, a novel calculation principle of CED by extracting the coordinates of the instantaneous contacting area and the rotation angle of the gear pair is proposed in this paper. As shown in Figure 2, during the rotation process of the gear pair, the actual displacements of the meshing points at one moment are composed of the CED and the rotational displacement of the tooth. In Figure 2, the tooth profiles of the pinion and the gear are the projections of the gears in the cross-section of the pinion and the gear, which are perpendicular to the rotation shafts. In fact, the projections are perpendicular to each other, so the points in Figure 2 should be described by the three-dimensional coordinates [xi, yi, zi] (i = P, G). The points

Actual and theoretical displacements of the meshing points on tooth surfaces.
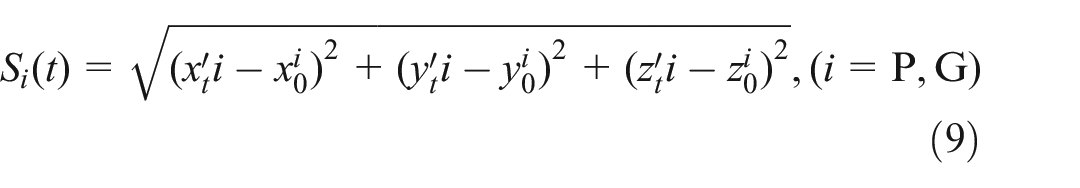
The theoretical displacement sP(t) and sG(t) of

where the φP(t) and φG(t) are the actual rotation angle of the pinion and the gear respectively. The actual displacement SP(t) and SG(t) of
At the time t, it is supposed that the numbers of the contacting points on the tooth surfaces of the pinion and the gear are m and l respectively, thus the comprehensive elastic deformation un of the gear pair can be computed based on

The calculation process of CED can be divided into the following steps,
Step 1. Select the j-th (j = 1, 2, …, n, n is the maximum number of teeth engaged simultaneously) teeth pair after the gear drive engages stably as the studied teeth. Extract the rotation angle of the gear and the pinion at each analysis step from the LTCA outputs.
Step 2. Select the time t0 after the gear drive meshes stably as the initial time, and the j-th teeth pair must not be engaged at t0. Extract the coordinates
Step 3. During the meshing process of the j-th teeth pair, at each analysis step, take all contacting nodes as a set and extract their coordinates
Step 4. During the meshing process of the j-th teeth pair, at each analysis step, based on the above parameters and equations (7)–(9), the actual and theoretical displacements Si(t) and si(t) (i = P, G) of the contacting nodes can be worked out. The CED un of the gear pair at can be calculated based on equation (10).
Time-varying meshing stiffness (TVMF)
According to the definition of the meshing stiffness of the gear pair, 32 the time-varying meshing stiffness kn(t) of the hypoid gear drive can be calculated based on

Verification of the LTCA method
The exact formulas for computing the meshing stiffness of the hypoid gear drive are rarely reported in current literatures, while those of the spur gear pair have been widely adopted. To verify the proposed principle, the same method is used to work out the meshing stiffness of a spur gear drive, and the results are compared with those computed by Kuang and Yang. 32 The parameters of the studied spur gear pair are given in Table 1. The instantaneous meshing force on the contact area obtained by LTCA are shown in Figure 3.
Parameters of the studied spur gear pair and the settings of LTCA.


Meshing force on the tooth surfaces of a pair of spur gears.
The meshing stiffness of a single tooth pair and the comprehensive meshing stiffness of the gear drive calculated according to the principle of this paper and the formulas proposed by Kuang and Yang are shown in Figure 4(a) and (b) respectively, where “Km1” and “Km2” represent the meshing stiffness of the first and second tooth pair computed by the classic formulas and “FEM” represents that worked out by the proposed principle in this paper. It is observed that the results obtained by the two methods are essentially same, thus the accuracy of the proposed principle to compute the meshing stiffness can be verified.

Meshing stiffness of the studied spur gear pair: (a) meshing stiffness of single tooth pair and (b) comprehensive meshing stiffness of spur gear drive.
In order to verify the accuracy of the modeling method and the LTCA process, the LTCA simulation under 30 Nm and the rolling test are respectively implemented. Due to the small load required for the rolling test, the LTCA simulation load is set to 30 Nm. As shown in Figure 5, it can be seen that the contact patterns obtained by LTCA are consistent with the results of the rolling test, and due to the small load condition, the contact pattern is close to the toe of the tooth, which will move toward the heel under general load. Therefore, the finite element model of the gear pair and the LTCA principle are proven to be effective, and the meshing parameters worked out by LTCA can be used in the proposed calculation principle.

Contact patterns on gear tooth surface obtained by LTCA and the rolling test: (a) contact pattern obtained by LTCA and (b) contact pattern obtained by the rolling test.
Time-varying meshing characteristics
A hypoid gear pair processed by the face-milled method is taken as the case study in this paper, which geometric parameters are given in Table 2. A series of LTCA cases in which the gear pair is driven at 100–6000 Nm load torque and 60 r/min rotate speed are carried out.
Parameters of the studied hypoid gear pair.

Taking the results under 4000 Nm load torque as an example, the position of the equivalent meshing points is shown in Figure 6, and the EMF, loaded TE, CED, and TVMF are shown in Figure 7.

Equivalent meshing points in the meshing coordinate system under 4000 Nm condition: (a) sight 1 of equivalent meshing points and (b) sight 2 of equivalent meshing points.
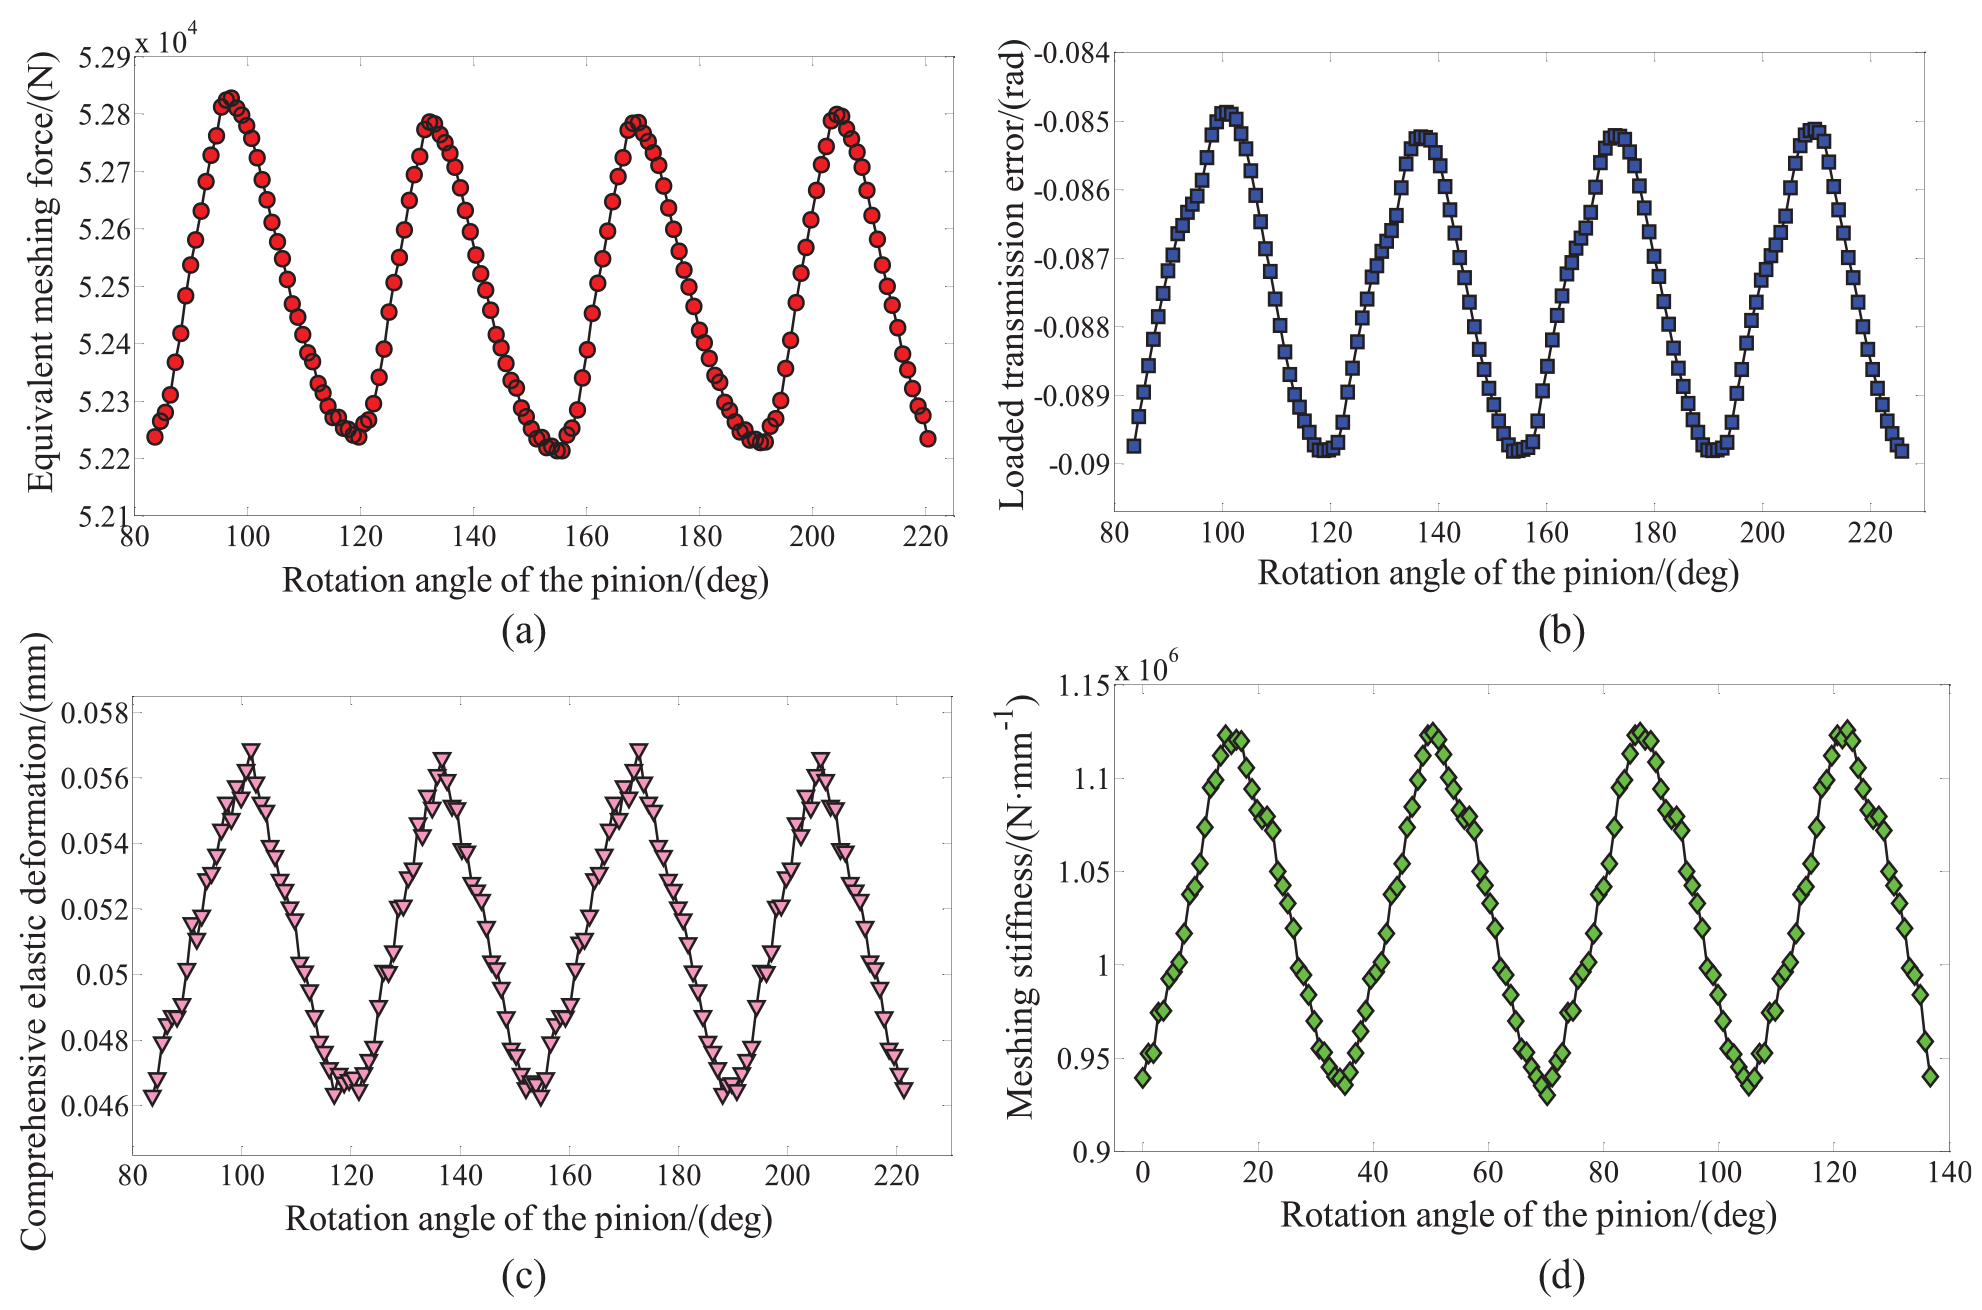
Time-varying meshing parameters of the hypoid gear drive under 4000 Nm: (a) equivalent meshing force, (b) loaded transmission error, (c) comprehensive elastic deformation, and (d) time-varying meshing stiffness.
Because of the periodicity of the meshing state, the ideal trajectory of the equivalent meshing points is a closed curve. Due to the errors in the modeling and analyzing process in LTCA, the equivalent meshing points obtained in this research are located in a small plane in the meshing coordinate system, as shown in Figure 6. It can be seen from Figure 7 that the EMF, loaded TE, CED, and TVMF all change periodically, and there is no obvious sudden change during the meshing process. As shown in Figure 4, there is a significant abrupt change between 620 and 1160 MN/m of the meshing stiffness of the gear drive. Therefore, the meshing process of the hypoid gear pair is relatively stable. The fluctuation frequency of the meshing parameters is consistent with the meshing frequency of the gear drive, which is 10 Hz in this case.
Loaded TE and actual contact ratio
The obtained loaded TE of the gear pair under different loads is shown in Figure 8(a). It can be seen that the absolute value of the loaded TE increases as the load rises, while the increment decreases gradually. The reason is that the increase of the load makes the actual contact pattern on tooth surface deviate from the ideal contact area, which moves toward the toe and the heel of the tooth, thus the loaded TE increases. However, as the load rises, the increment of the deviation of the contact pattern decreases gradually, while the actual contact ratio increases (as shown in Figure 8(b)), which enhances the stability of the transmission state, so the increment of the loaded TE decreases as the load rises. The influence of the variation of the load on the transmission error of the hypoid gear pair is significant, and it is necessary to consider this effect on the dynamic behavior of the gear drive.
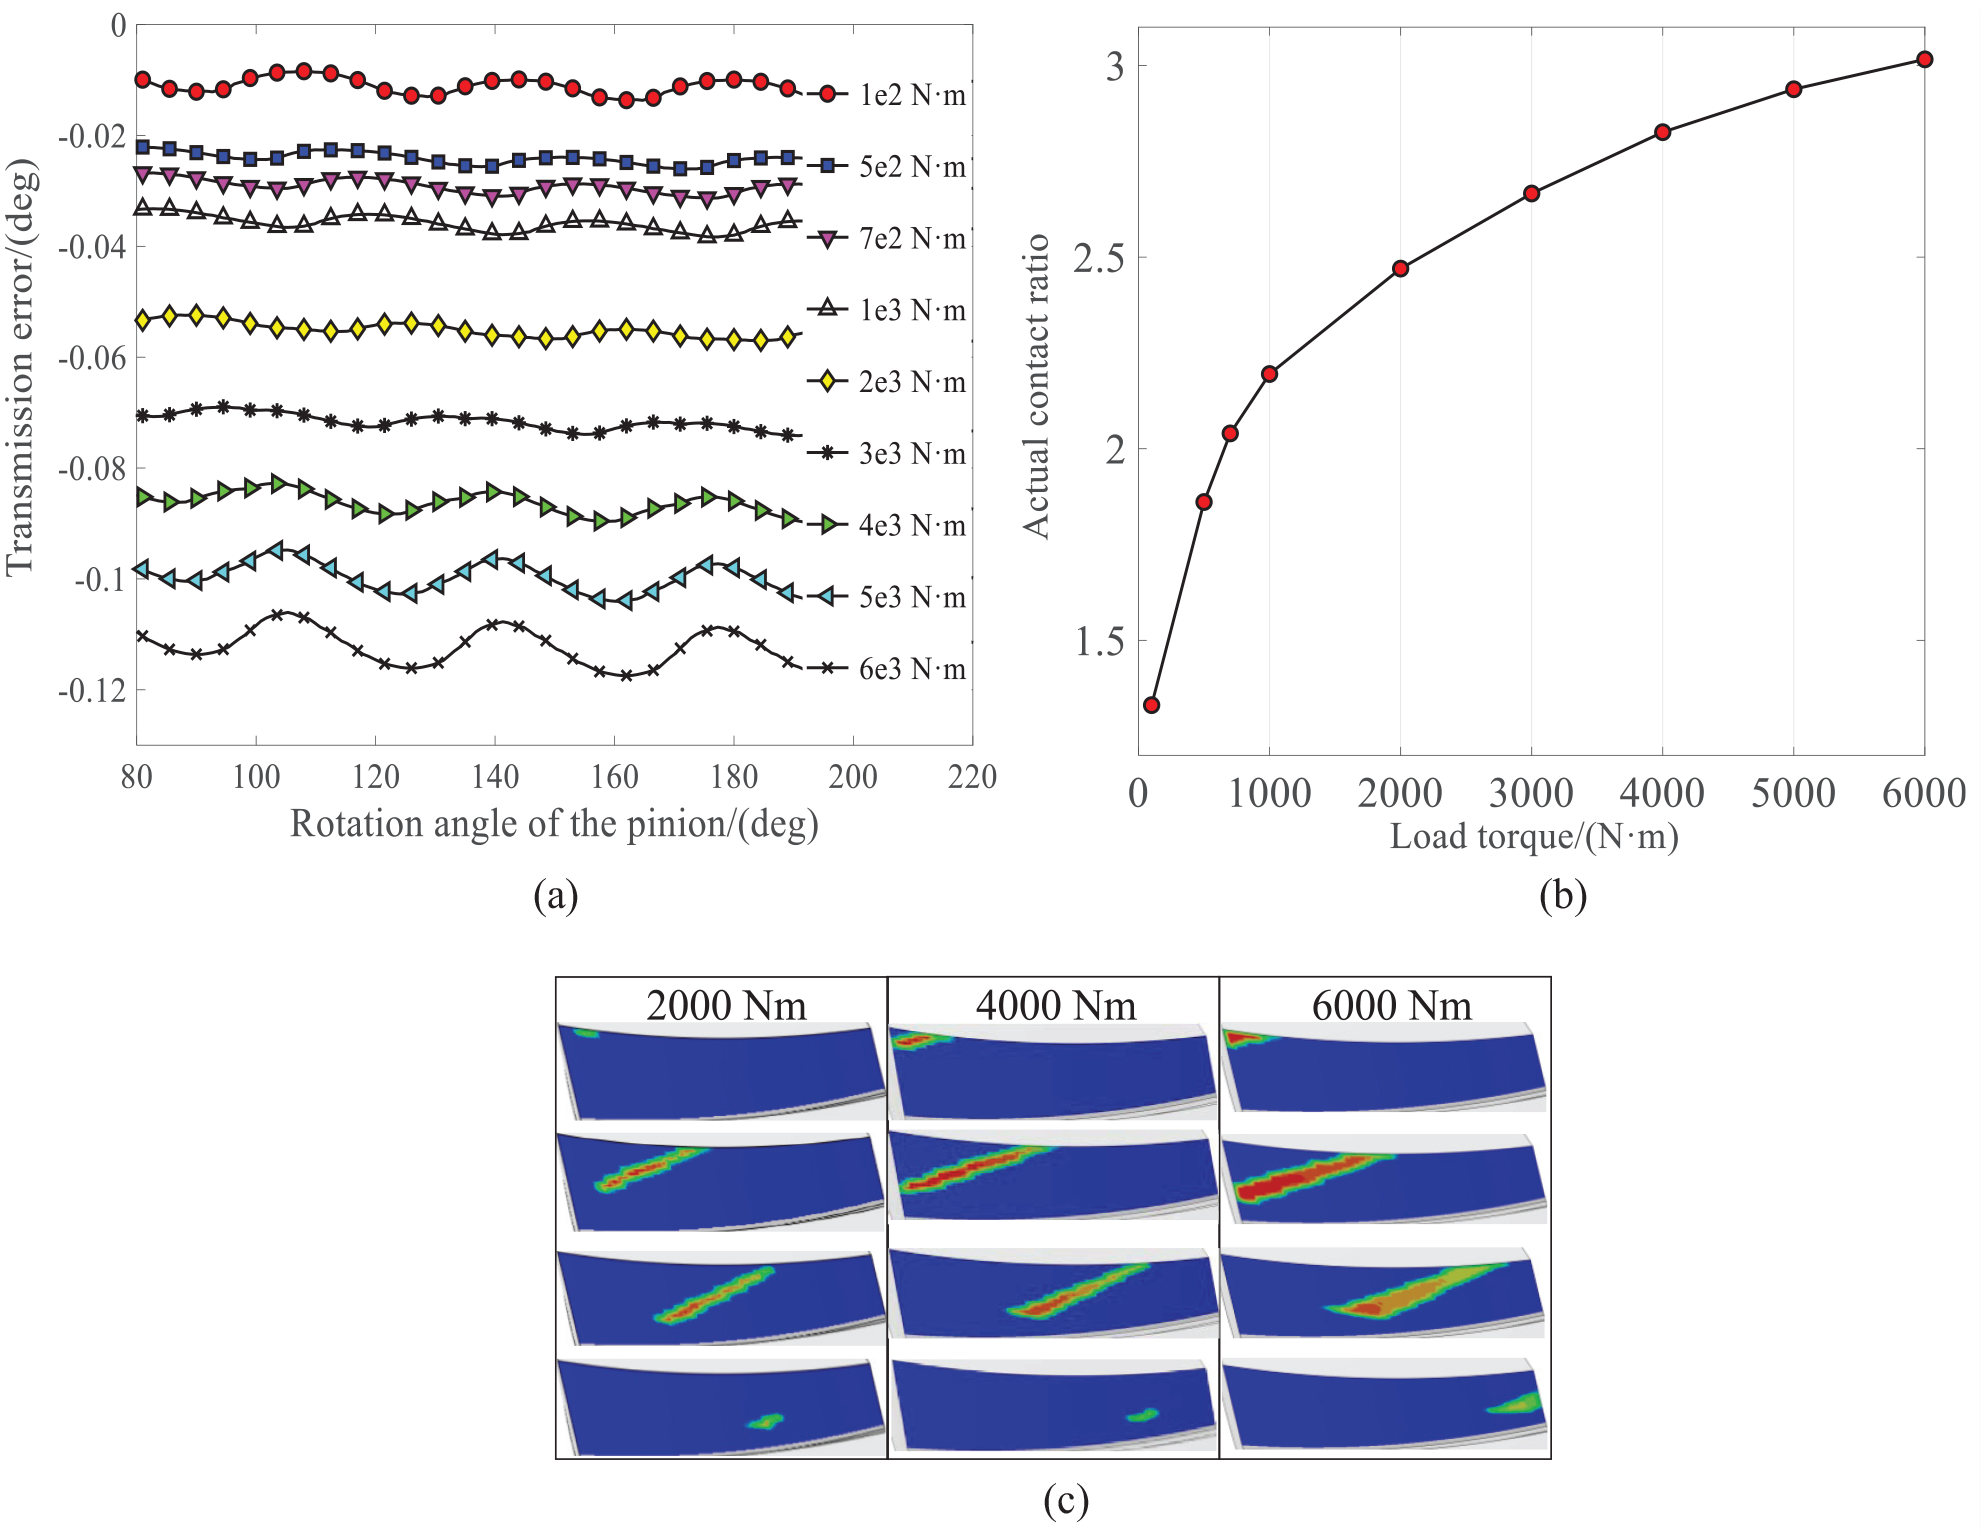
Loaded TE and actual contact ratio of the studied gear pair: (a) loaded transmission error, (b) actual contact ratio, and (c) contact patterns on gear tooth surface under different loads.
The actual contact ratio in Figure 8(b) varies from 1.38 to 3.01, and the relatively large range of the variation is due to the load torque of the finite element analysis of the gear drive set from 100 to 6000 Nm. From Figure 8(c) it can be seen that as the load increases, the contact pattern extends from the middle of the tooth surface toward the toe and the heel of the tooth. So that the axial contact ratio increases significantly, which leads to the actual contact ratio enhanced obviously. In practice, the load torque is usually in the range of tens to hundreds of Nm, so the variation range of the actual contact ratio will be smaller.
Considering the periodic feature of the meshing state, the Fourier series expansion is used to fit the loaded TE under different loads in this study, which can be described as

where em is the average of the loaded TE, eai and ebi are the magnitude of the i-th cosine and sine harmonic component of the loaded TE, ϕe is the initial phase of the harmonic component, Ωh is the meshing frequency. The “R-square” is used to evaluate the goodness of the fitting, which ranges from 0 to 1, and the closer to 1, the better the fitting is. It is found by comparison that the six-order Fourier series expansion is best for the fitting of the loaded TE in this study, and the coefficients are given in Table A1.
EMF and TVMS
The obtained EMF and TVMS of the studied gear pair under different loads are shown in Figure 9(a) and (b), respectively. The increase of the EMF is consistent with that of the load torque, and the fluctuating frequency of the EMF equals to the meshing frequency. When the load torque is lower than 2000 Nm, the TVMS rises significantly as the load increases. The reason is that the actual contact ratio of the gear pair increases rapidly as the load rises under lower load torque (as shown in Figure 8(b)), that is, the number of the teeth contacting at the same time increases rapidly, which leads to the TVMS rise obviously. After the load reaches a certain amplitude, as the load increases, the TVMS rises relatively slower.
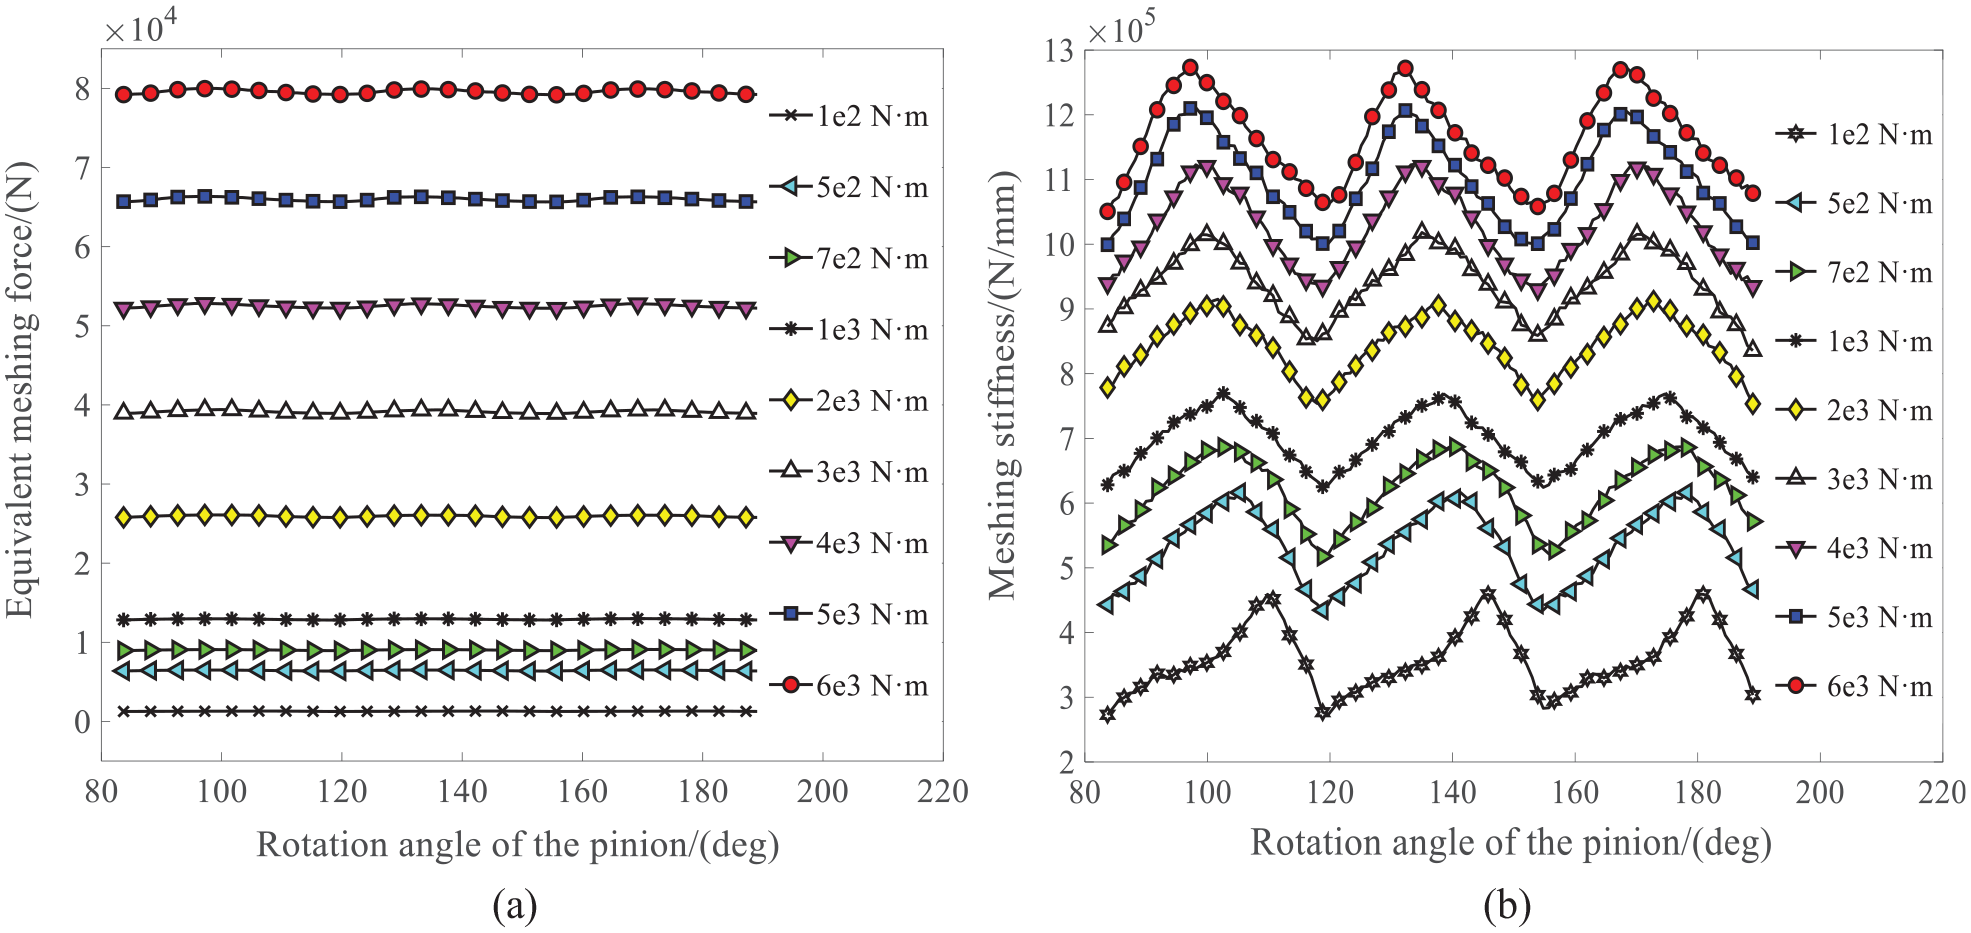
(a) Equivalent meshing force and (b) time-varying meshing stiffness of the studied gear pair.
Furthermore, it is worth noting that as the TVMS increases, the maximum of TVMS appears gradually earlier during one meshing cycle. The reason is that as the load increases, the actual contact area expands to the toe and the heel of the tooth. The trajectory of the contact pattern on hypoid gear tooth surface is from the heel to the toe. Therefore, as the load rises, the contact at the heel appears earlier. Because the tooth profile at the heel is thicker, the bending and shear deformation of the tooth is not easy to be generated, so the TVMS at the heel is greater than that at other position of the tooth. Therefore, as the load rises, the first contact pattern moves toward the heel of the tooth, and the maximum of TVMS appears gradually earlier.
As the load changes, the TVMS exhibits strong nonlinear characteristics, which should be concerned in the study of the dynamic behavior of the gear drive. In this paper, the Fourier series expansion is also used to fit the TVMS under different loads, which can be described as

where km is the average of the TVMS, kai and kbi are the magnitude of the i-th cosine and sine harmonic component of the TVMS, ϕk is the initial phase of the harmonic component. It is found by comparison that the three-order Fourier series expansion is best for the fitting of the TVMS in this study, and the coefficients are given in Table A2.
Dynamic model of hypoid gear system
Dynamic model of the gear pair
The simplified dynamics model and contact force model of a hypoid gear pair with the elastic supports is illustrated in Figure 10. p and g indicate the pinion and the gear, respectively, which are simulated as lumped mass and lumped rotational inertia. The shafts are simulated as rigid bodies without mass and the bearings are simulated as springs and damper. Tp and Tg are torques of the pinion and gear, respectively. The X-axis is set as the pinion shaft and the Y-axis is set as the gear shaft. k(τ) is the time-varying meshing stiffness where τ is time. e(τ) is the comprehensive TE along the line of action. cm is the meshing damping coefficient.
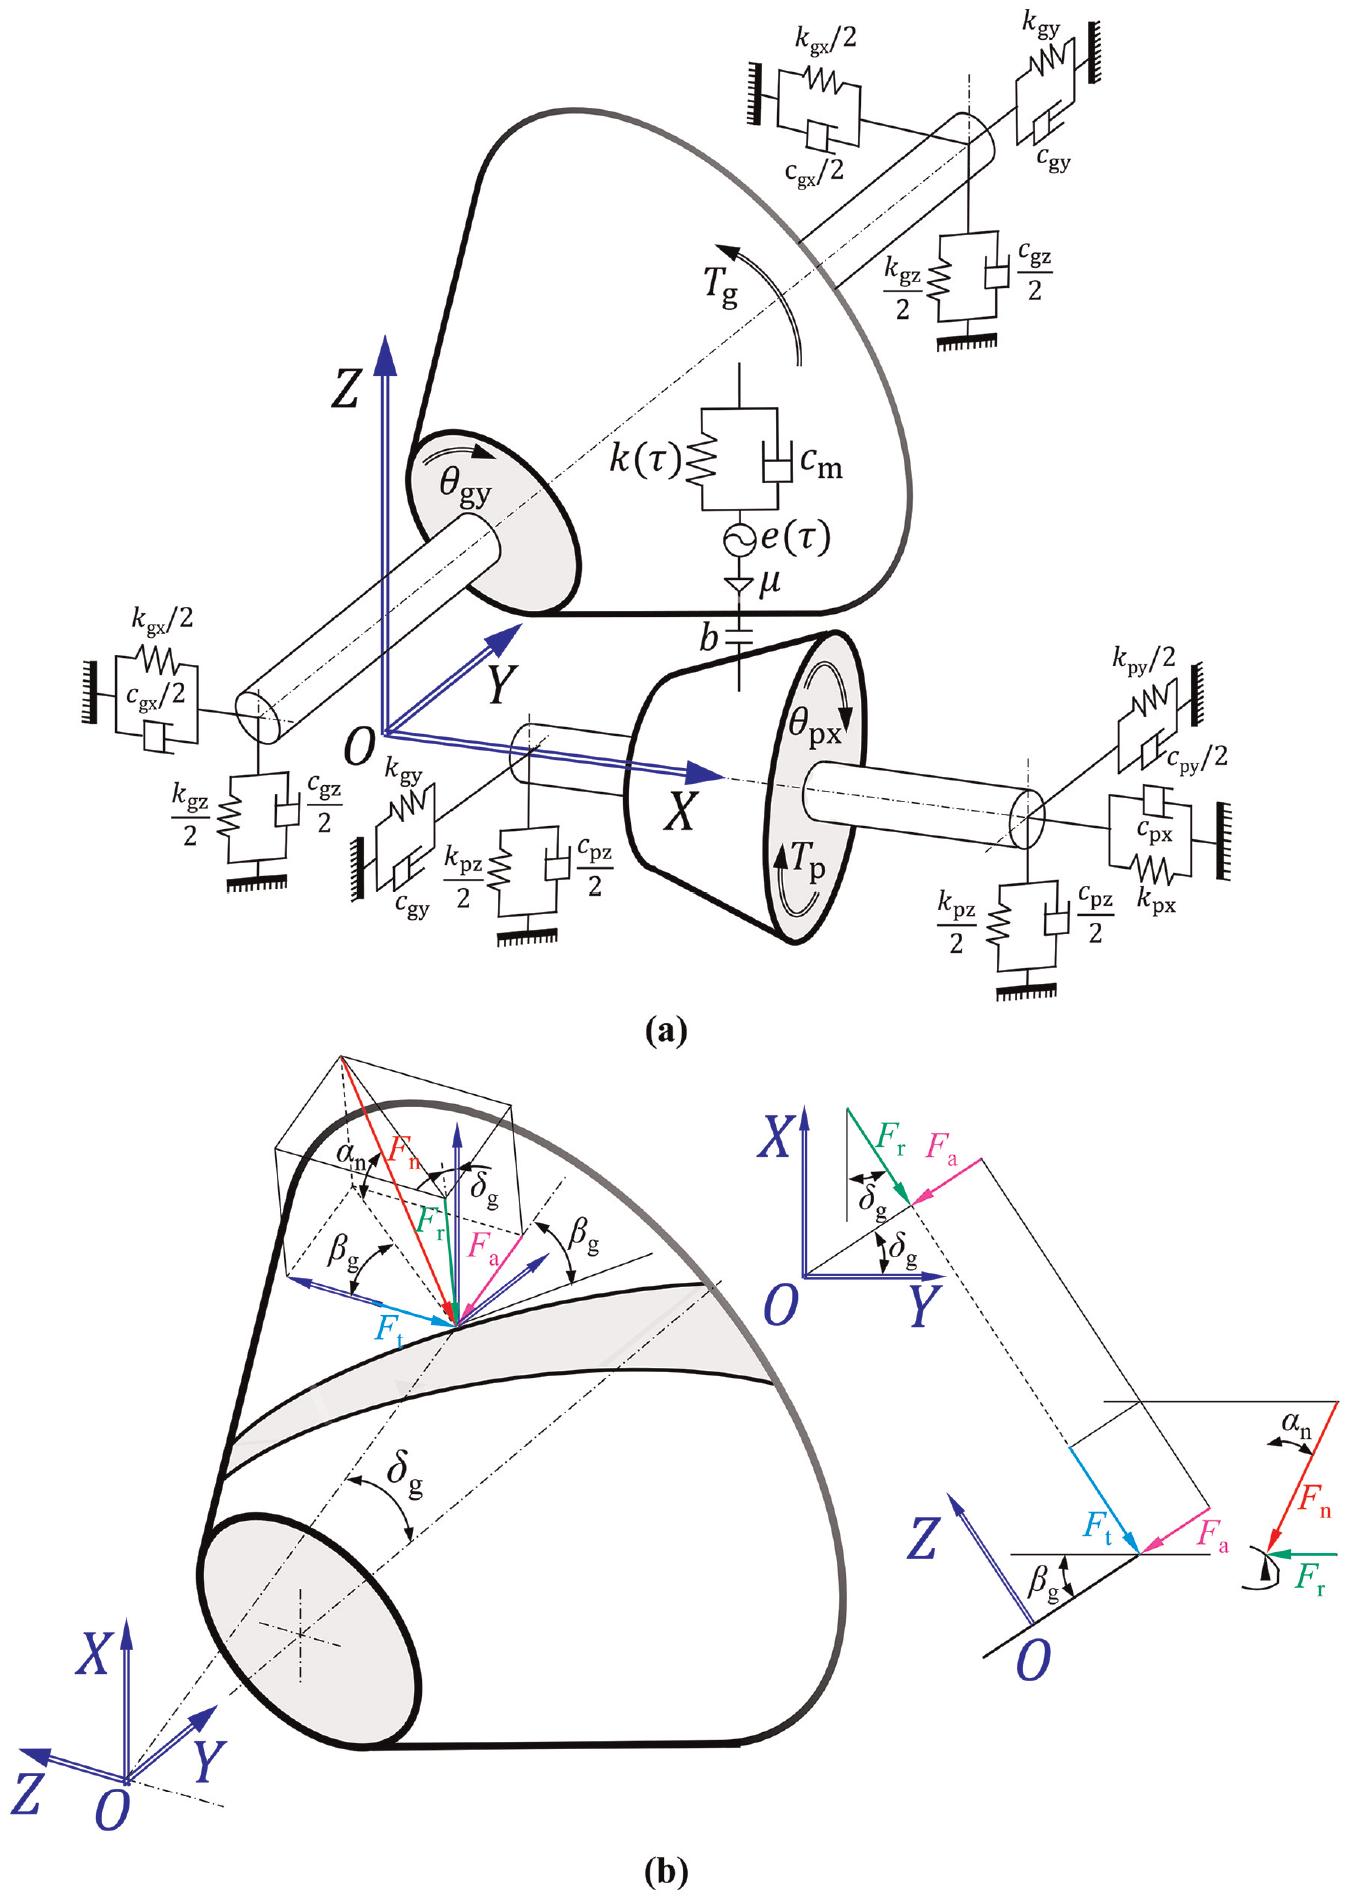
(a) Dynamics model and (b) contact force model of a hypoid gear pair.
Thus, the entire dynamic system has 12 degrees of freedom, including the bending vibration, axial vibration, torsional vibration, and shimmy of the pinion and the gear along the X-axis, Y-axis, and Z-axis. In Figure 10, “k” represents the stiffness coefficient, “c” represents the damping coefficient, and the subscripts “1” and “2” represent the pinion and the gear respectively. Since the influence of the shimmy of the gears is not significant to the dynamics of the system, in order to simplify the dynamics calculation, the shimmy is ignored in this study. Therefore, the transmission system of the hypoid gear pair is finally built as an 8-dof nonlinear dynamics model with the time-varying meshing stiffness and backlash. The generalized displacements of the system can be expressed as
where,
Mathematical model
The contact force at the meshing point can be worked out based on the relative position parameters of the mating tooth surfaces. After establishing the positional relationship between the pinion and the gear shown in Figure 10, the relative displacement of the tooth surfaces along the direction of the normal force at the contact point can be represented as


where,
The normal force at the contact point and its component forces along the coordinate axes can be respectively expressed as


where,

where,
The drive torque

The intermediate variables a1–a9 in equation (21) are all derived from the stress analysis in Figure 10. The derivation of damping and stiffness matrix and load vector using variables a1–a9 is shown in the appendix. Combining the two torsional vibration equations in equation (21), a new differential equation can be obtained.


where,

where,

where,


Simplifications, assumptions, and parameter settings
Before solving the nonlinear differential equation set, it is necessary to make appropriate simplifications and assumptions for some of the excitation terms in equation (24) to simplify the calculation process. Firstly, the driving torque on the pinion is assumed relatively stable, and its fluctuation is ignored. Therefore,

where,
For the time-varying meshing stiffness, according to the above fitting results by the Fourier series, the first to the eighth harmonic components are considered into calculation

where,
Since equation (24) is a strongly nonlinear second-order differential equation set, it is very difficult to solve it by analytical method. In this study, the fifth-order variable step size adaptive Runge-Kutta numerical integration method is used to solve it. Therefore, the seven second-order differential equations in equation (24) should be transferred to fourteen first-order differential equations. The state variables are introduced into the equation.
Therefore, equation (24) can be transferred to a matrix form as

where,
In this research, the “ode45()” function in MATLAB R2016b software is employed to solve equation (24). The backlash of the gear pair is set as 72

The meshing stiffness under 500, 1000, and 2000 Nm are given in Appendix equation (A1), and the initial condition of the differential equation set is set as

Comparison of the effects of different meshing stiffness on the dynamics
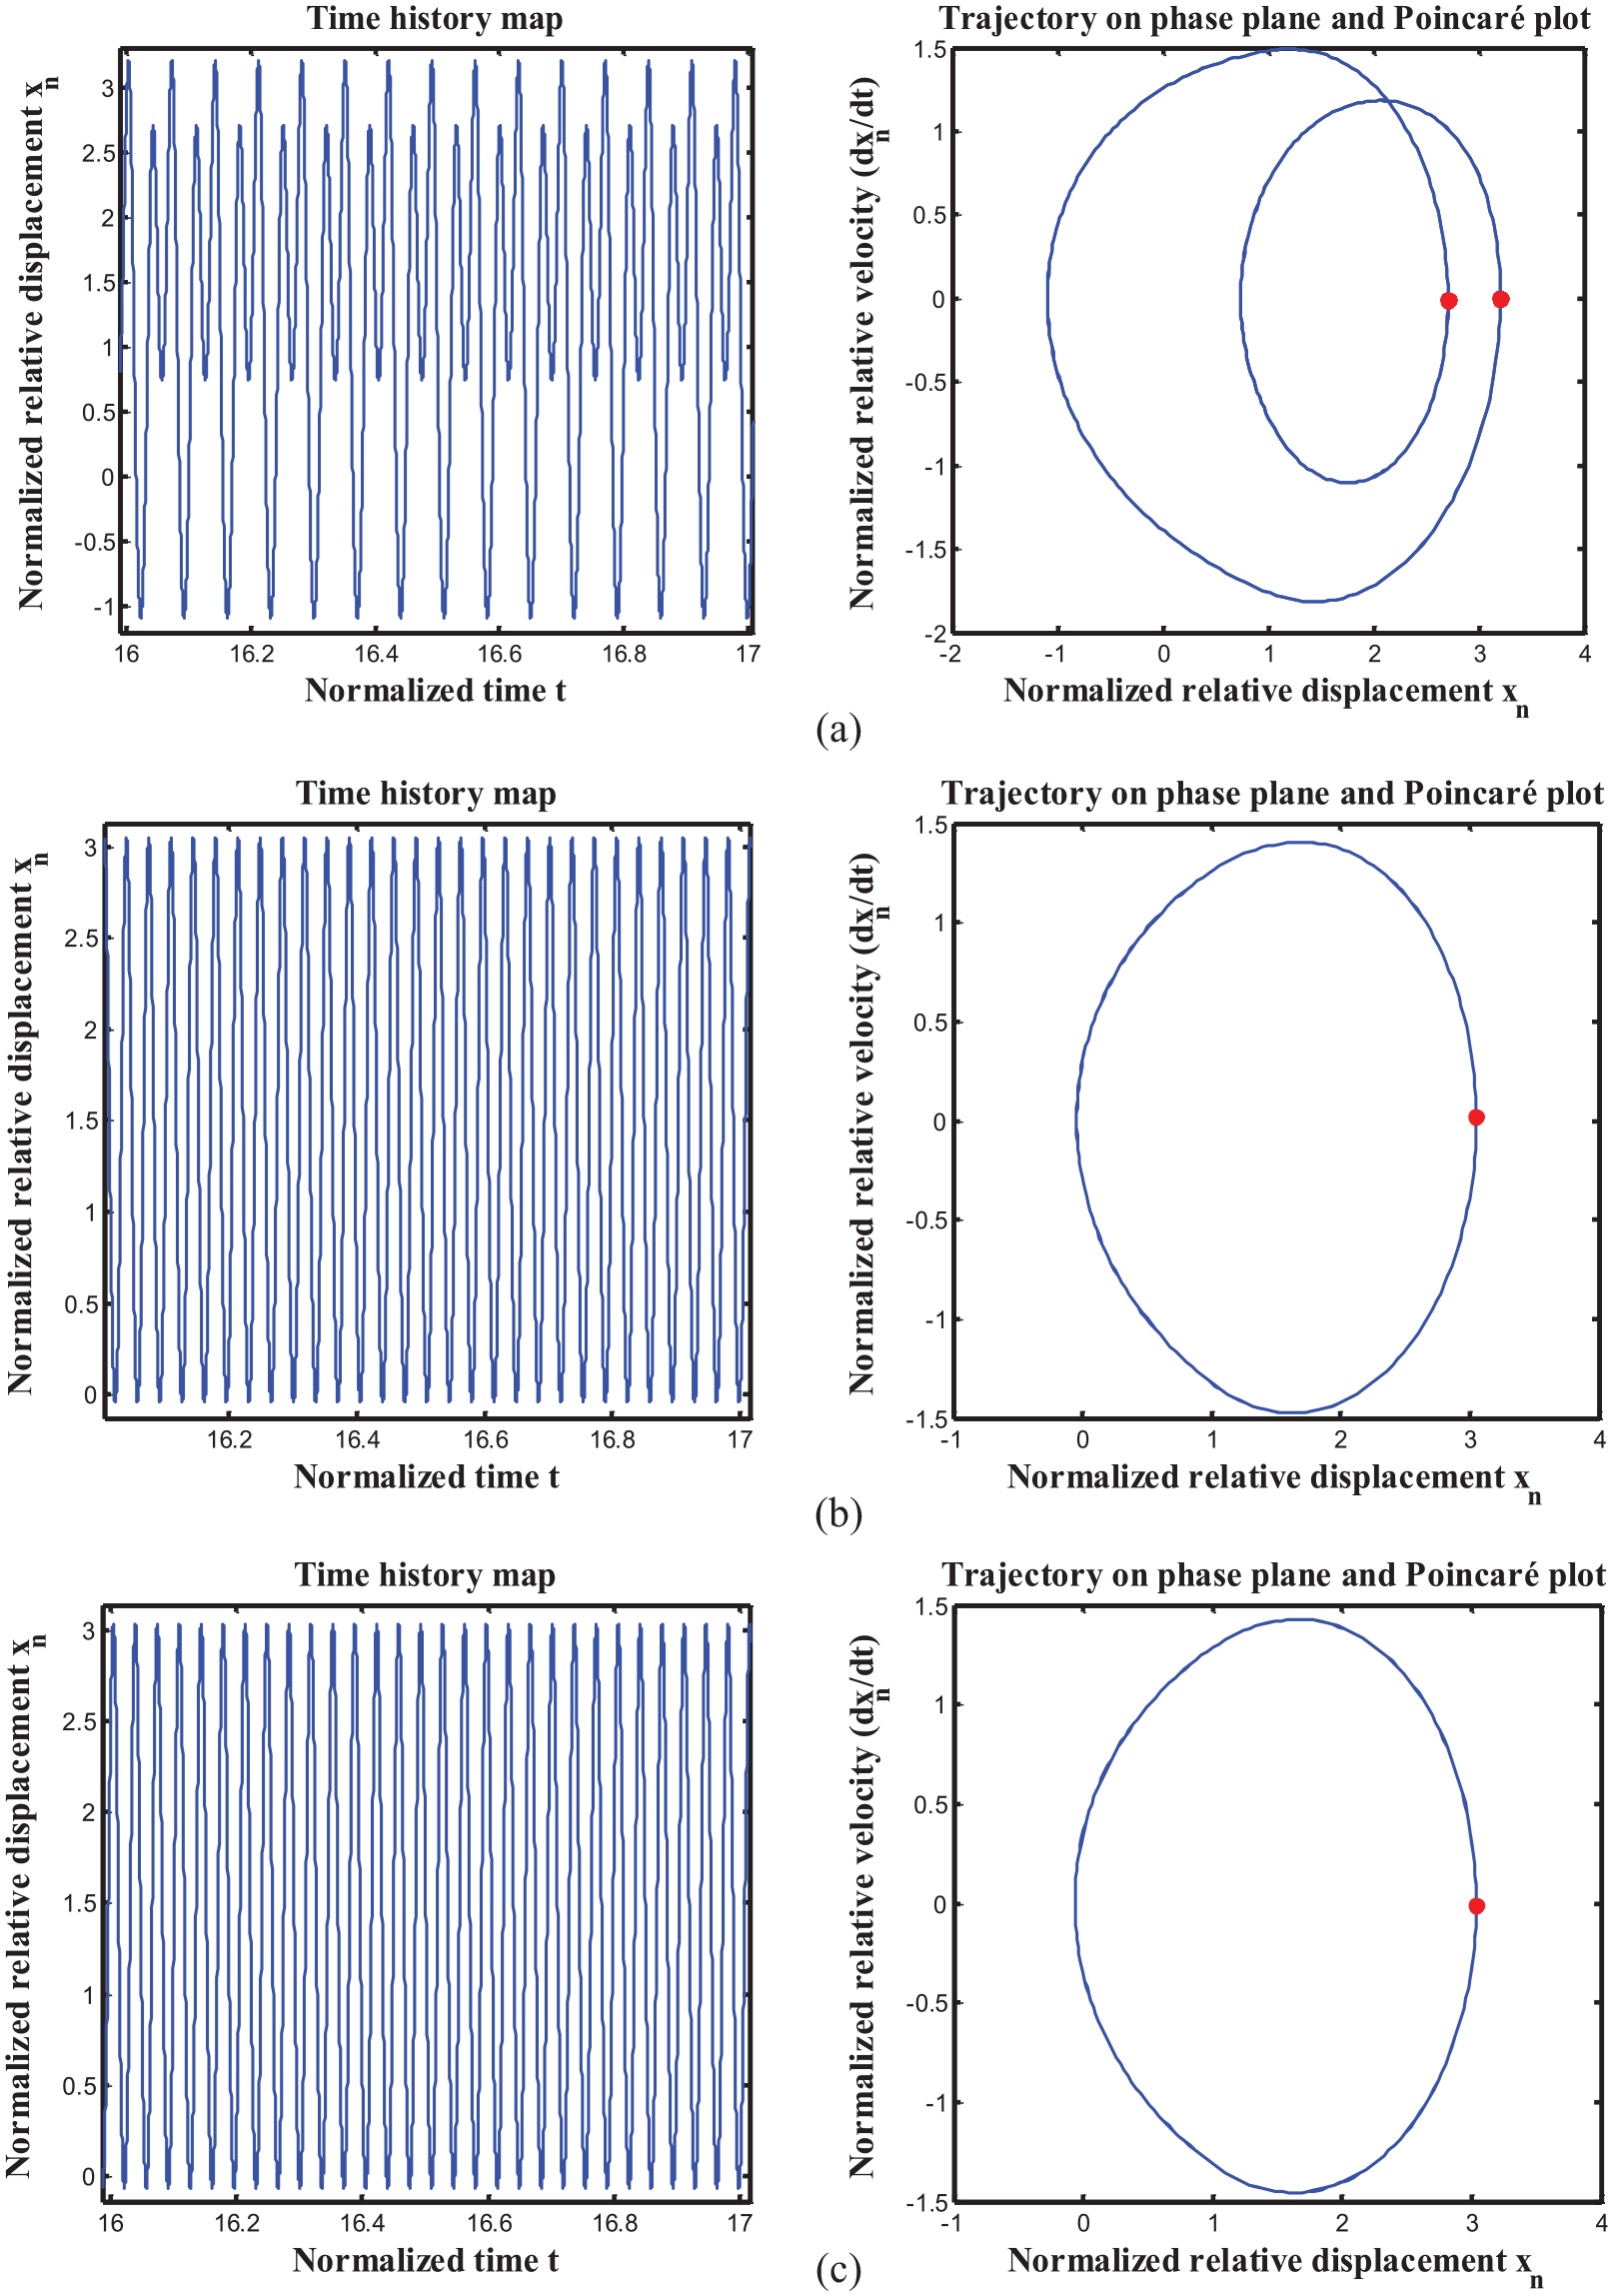
In order to investigate the effects of different meshing stiffness on the dynamics characteristics of the hypoid gear system, the above three expressions of dimensionless stiffness are introduced into the dynamics model. After completing the simulation, the time history curve, phase diagram, Poincaré section, and the bifurcation diagram of the system are used to analysis the influence. When the normalized excitation frequency
Time history map, trajectory on phase plane, and Poincaré plot of xn (ωh = 0.23): (a) 500 N m load condition, (b) 1000 N m load condition, and (c) 2000 N m load condition.
As can be seen from Figure 11, the vibration amplitude of the normalized relative displacement
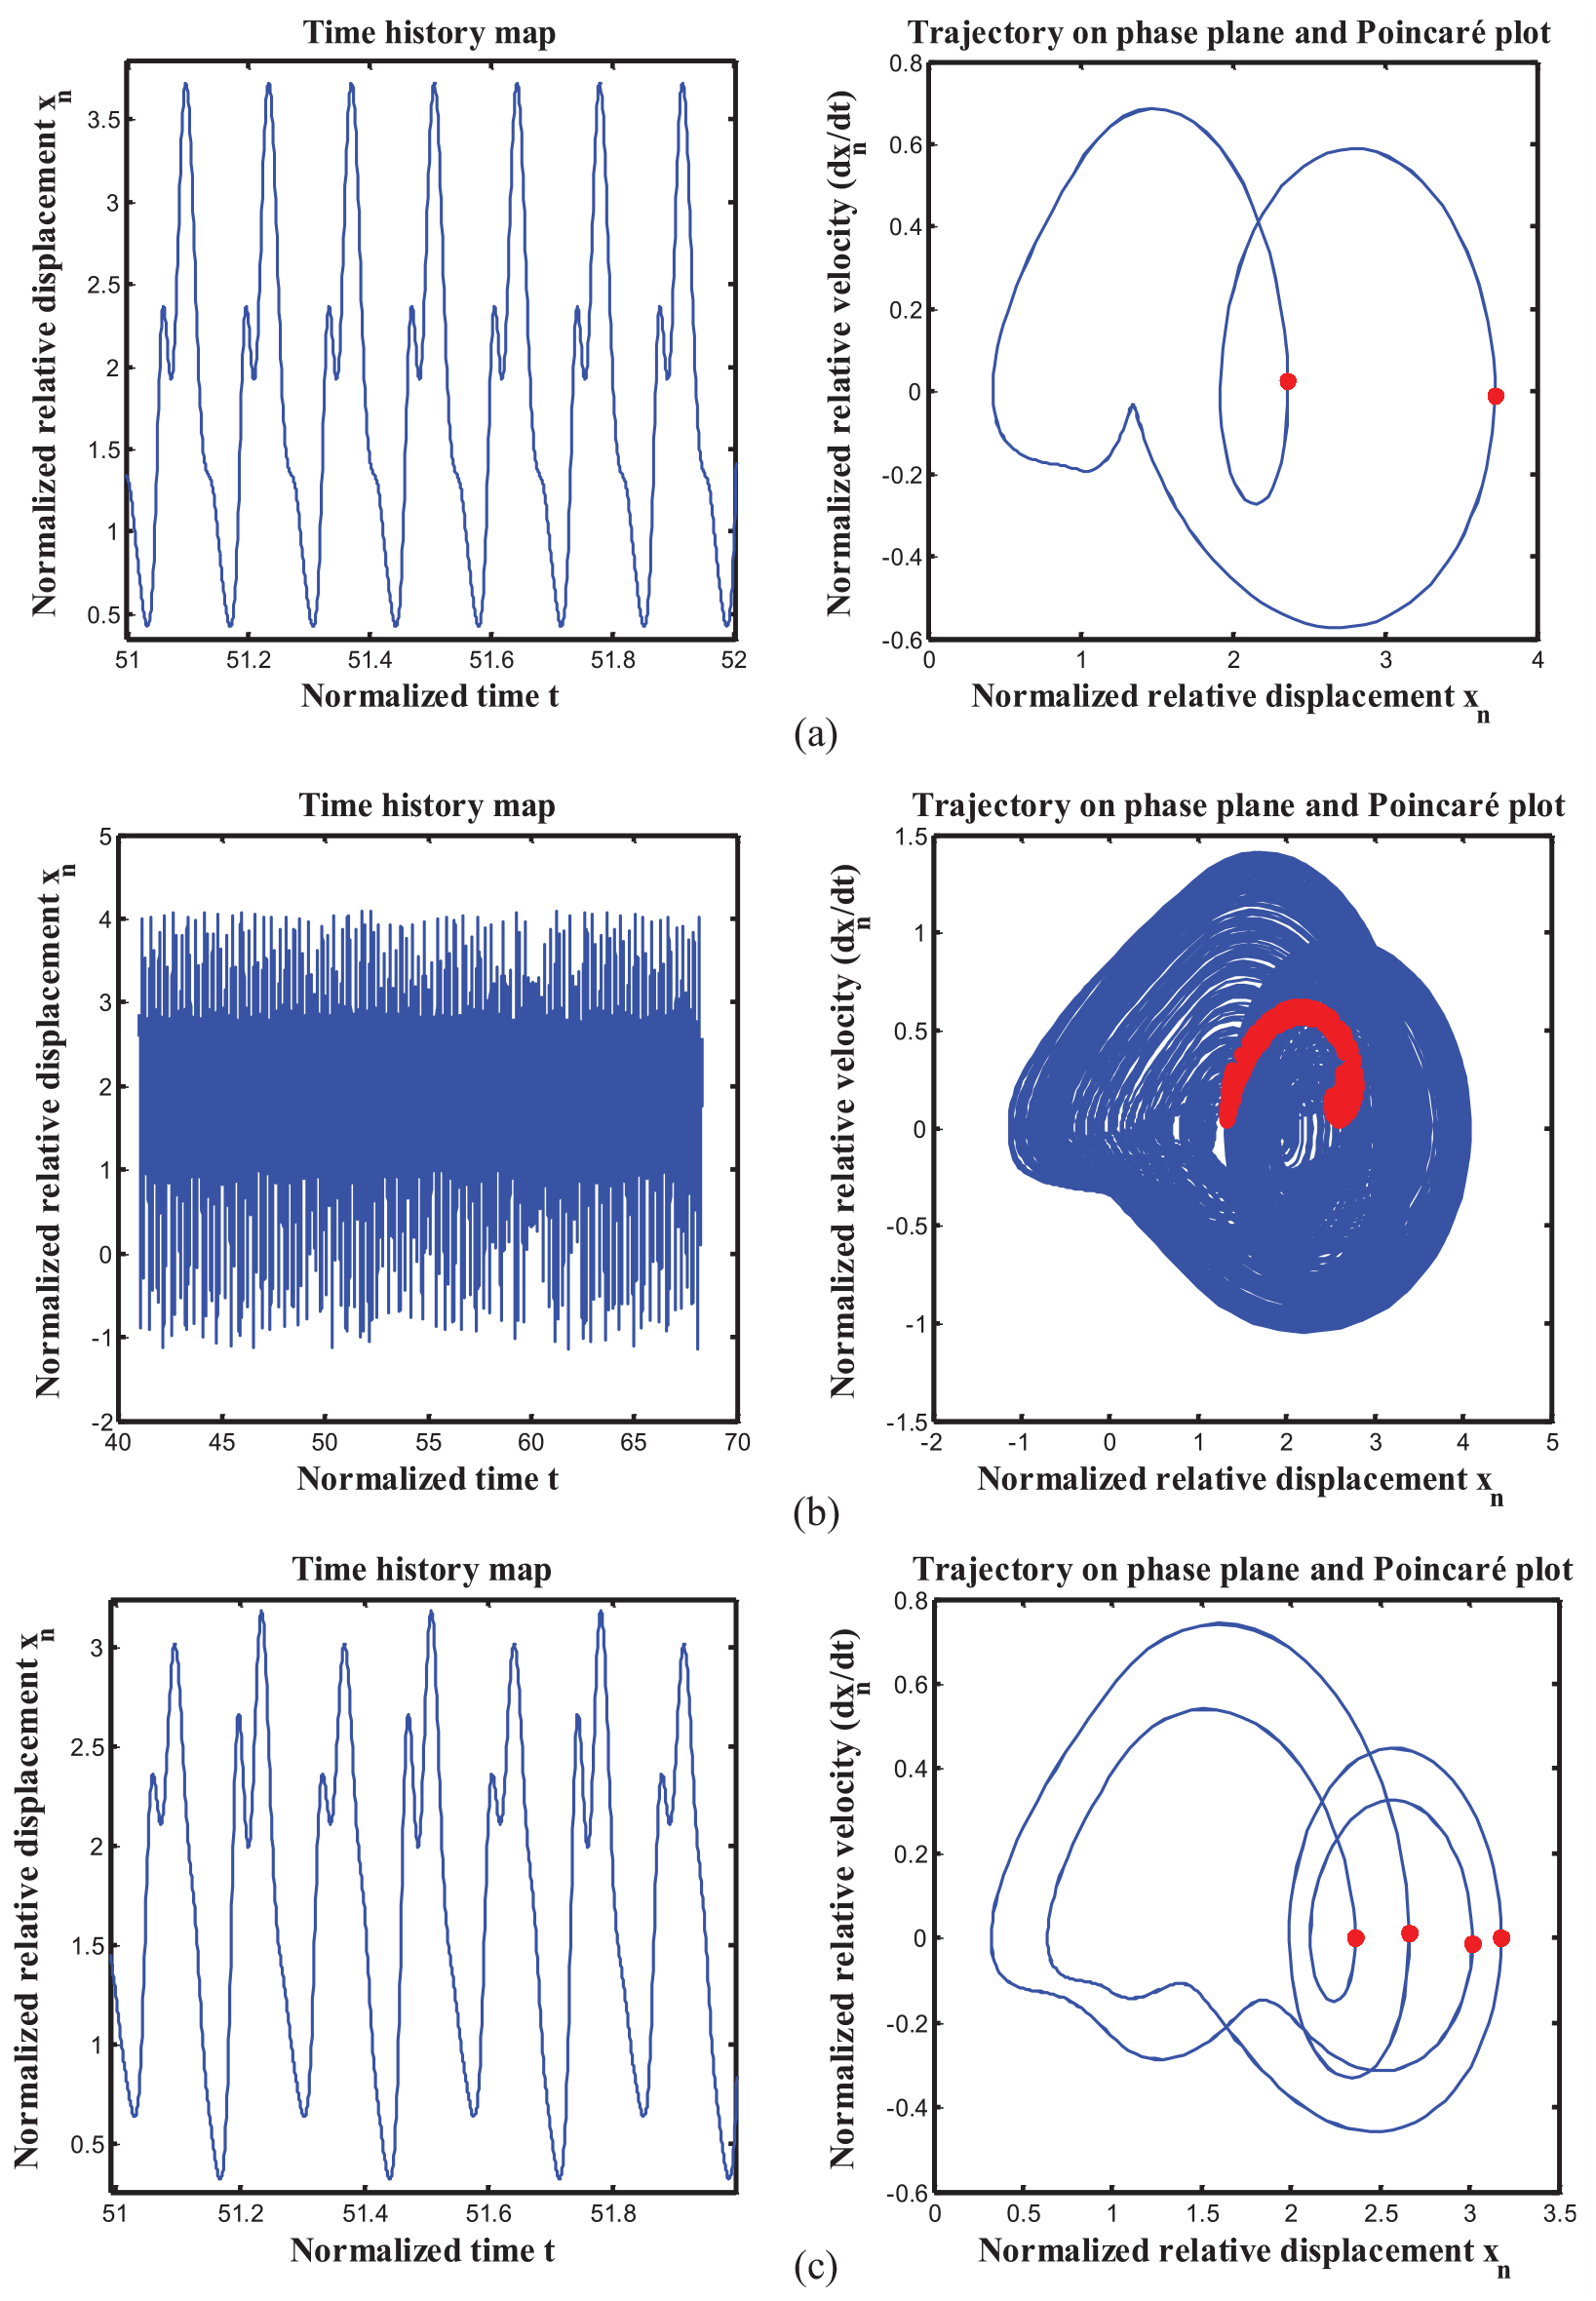
When
Time history map, trajectory on phase plane, and Poincaré plot of xn (ωh = 0.90): (a) 500 N m load condition, (b) 1000 N m load condition, and (c) 2000 N m load condition.
The normalized displacement and normalized velocity of the pinion along X-axis, Y-axis, and Z-axis under different loads are shown in Figure 13. It can be seen that under the three load conditions, the vibration amplitudes along the offset direction are all the largest, followed by those along the axial direction of the pinion, while those along the gear axial direction are minimum. This rule also applies to the comparison of the normalized velocities of the pinion along the three axes. Since the hypoid gears are supported by the tapered roller bearings, these vibration features are consistent to the actual motion state of the gear system.

Comparison of the displacement and the velocity of the pinion along three axes under different load condition: (a) 500 N m load condition, (b) 1000 N m load condition, and (c) 2000 N m load condition.
In order to study the influence of the excitation frequency on the vibration characteristics of the system, the bifurcation diagram of

Bifurcation diagram of xn relative to ωh with different meshing stiffness fitted by eighth-order Fourier series: (a) 500 N m load condition, (b) 1000 N m load condition, and (c) 2000 N m load condition.
It can be seen from Figure 14 that as the excitation frequency changes, the local characteristics of the normalized relative displacement
By comparing the bifurcation diagrams under the same load condition in Figures 14 and 15, it can be found that the influence of the fitting accuracy of the time-varying stiffness on the motion of the gear system cannot be ignored. For instance, there are visible differences between the local vibration state of

Bifurcation diagram of xn relative to ωh with different meshing stiffness fitted by second-order Fourier series: (a) 500 N m load condition, (b) 1000 N m load condition, and (c) 2000 N m load condition.
Conclusion
A detailed mathematical model has been given in this study for computing the meshing stiffness of a hypoid gear pair by measuring the contact forces and the static and dynamic transmission error. The reliability and accuracy of the calculation method are verified by using the same method to compute the stiffness of a spur gear pair. A generalized 8-dof nonlinear dynamics model of the gear drive is established considering the time-varying stiffness, backlash, dynamic transmission error, elastic supports, and neglecting the shimmy of the gears. Meshing stiffness obtained by the above analysis is fitted by an eighth-order Fourier series and imported into the dynamics model. The influence of the meshing stiffness under different loads on the dynamics response of the system is analyzed and compared. The effects of the excitation frequency on the motion characteristics of the gear pair are also analyzed. The conclusion can be summarized as follows:
a. Meshing stiffness of the hypoid gear pair changes periodically, and the period is same to the changing period of the contact forces and the transmission error, which equals to the meshing period of the gear pair. Unlike the variation of the meshing stiffness of spur gear pair, the meshing stiffness of hypoid gear pair will not change suddenly, thereby the gears can smoothly contact and the meshing impact can be reduced. The meshing stiffness increases with the increase of the load, mainly because the increase of the contact forces enhances the deformations of the tooth profile and the tooth surface, so that the average value of the meshing stiffness increases. The load has a major effect on the amplitude of meshing stiffness, and the consideration of load is essential in the dynamics analysis of hypoid gears.
b. The accuracy and goodness of the meshing stiffness curves fitted by the eighth-order Fourier series are better than those fitted by the second-order Fourier series. The fitting of the low-order function for time-varying meshing parameters may be not accurate enough, which may cause errors in the dynamic analysis results. In the future studies on the dynamics of hypoid gears, the time-varying meshing stiffness should be represented as accurately as possible.
c. Under different load conditions, the vibration amplitudes along the offset direction are all the largest, followed by that along the axial direction of the pinion, while those along the gear axial direction are minimum. This rule also applies to the comparison of the normalized velocities of the pinion along the three axes. Since the hypoid gears are supported by the tapered roller bearings, these vibration features are consistent to the actual motion state of the gear system. During the assembly process of the hypoid gear pair, it is necessary to restrain the displacement of the gears along the offset distance.
d. As the excitation frequency increases, the hypoid gear pair studied in this paper experiences singe-cycle, multi-cycle, quasi-periodic, and chaotic motion state and finally returns to a single-cycle motion. At the same excitation frequency, there are big differences in the steady-state dynamics features of the hypoid gear system corresponding to different meshing stiffness. Under the same load condition, the vibration features of the gear system change with the excitation frequency. Hence, the influence of the time-varying meshing stiffness and the load on the dynamics cannot be neglected in the analysis of dynamics of hypoid gear system. The effects of the excitation frequency on the vibration features of gear system should be analyzed, and the influence of the fitting accuracy of the meshing stiffness on the motion of the gear system also should be considered. Besides, the conclusion can be drawn from comparative analysis that the motion state of the hypoid gear system under light load condition is more sensitive to the fitting accuracy of the meshing stiffness.
e. Compared with previous and similar hypoid gear system dynamics models, the high-order time-varying meshing stiffness and transmission error under different loads are introduced into the dynamics model instead of using the mean value and the first harmonics. Therefore, the effect of load variation on the behavior of gear system dynamics can be found in detail. Furthermore, the dynamics behavior of hypoid gear system considering the variation of the meshing damping, frequency, and tooth clearance under different loads is also discussed. However, in order to simplify the calculation process, the 12 DOF dynamic system is simplified to 8 DOF in this paper, which may lead to slight deviation between the calculated results and the real state. Moreover, there are assembly errors between the meshing hypoid gears, and the influence of misalignments is not considered in this paper, which is also an important content of follow-up research.
Footnotes
Appendix
The dynamics model of the gear drive described as equation (20) can be represented as Matrix form as
where
Handling Editor: Sharmili Pandian
Declaration of conflicting interests
The author(s) declared no potential conflicts of interest with respect to the research, authorship, and/or publication of this article.
Funding
The author(s) disclosed receipt of the following financial support for the research, authorship, and/or publication of this article: The authors would like to thank the Universities Natural Science Research Project of Anhui Province of China (Grant No. 2024AH050475), the National Natural Science Foundation of China (Grant No. 51875150), the Aeronautical Science Foundation of China (Grant No. 2018ZEP4006), and Anhui Agricultural University youth Science Fund project (Grant No. rc412011) for the support given to this research.