
Abstract
Laser processing technologies are among the leading industry technologies for efficient and economical processing of a wide spectrum of engineering materials. The determination of optimal parameter settings with respect to multiple and opposite process performances is of great practical importance in laser processing technologies. This paper discusses, analyzes, and compares two main approaches for multi-response optimization (MRO) in engineering, that is, desirability function approach (DFA) and grey relation analysis (GRA), while solving five case studies, covering different laser processing technologies, such as cutting, drilling, welding, micro-channeling, and cladding. In each case study the MRO solutions obtained with two competitive approaches were assessed using the relative target deviation (RTD) criterion. Analysis of the obtained MRO solutions and comparative analysis with results from previous studies indicate that the integrated RSM-GRA provide similar and comparable solutions with the hybrid Taguchi method and GRA, while DFA proved to be a better and more promising approach for solving MRO in laser processing technologies. Some specific features, limitations, and possibilities of MRO approaches were also discussed.
Keywords
Introduction
By using energy from laser radiation in direct form, laser technologies are capable of providing various energy density levels which are well suited for a variety of manufacturing processes such as laser drilling, laser cutting, laser cladding, laser hardening, laser soldering, laser welding, laser additive manufacturing, etc., with respect to productivity, quality, costs, and suitability to perform certain production features. Unique properties and advantages made laser processing technologies become an important scientific field of continuous research and industrial practice. 1 To efficiently process a growing number of engineering materials with specific properties, different types of lasers and laser processing techniques are applied and being developed. Numerous scientific and practical studies regarding analysis, modeling, simulation, and optimization as well as research in new/hybrid technologies play a critical role in the advancement of laser processing technologies. 2
The multiple physical phenomena involved in laser processing technologies are highly complex and are governed by numerous process parameters, which in turn affect numerous process performances, including quality characteristics, productivity, costs, environmental impact, etc. A better understanding of the underlying physical phenomena and relations between controllable inputs, non-controllable noise factors, and desirable outputs creates the prerequisites for single and multi-response optimization of laser processing technologies.
In recent years, researchers, practitioners, and companies that use laser processing technologies have focused on attaining as high as possible process efficiency, that is, an increase in productivity, and consequently profitability, while achieving specified quality characteristics as well as minimizing all kinds of variations and unnecessary costs.
Multi-response optimization (MRO) has been applied in many fields, particularly in production engineering and technologies, where an optimal solution, which may represent a certain combination of main design or process parameter values (processing regime), needs to be found in the presence of trade-offs between two or more responses. From the aspect of MRO of production technologies, product quality characteristics and productivity performances are, in general, opposite responses. 3
Laser processing technologies, like many other traditional and unconventional manufacturing technologies, almost always have more than one quality characteristic (responses) of interest that needs to be optimized. However, an improvement in one response generally degrades the remaining responses. Therefore, one may argue that it is not justified to consider optimization for each response separately. MRO is the right approach to find a compromise solution for all responses, often conflicting and of different significance, simultaneously.
Many different MRO techniques have been developed, such as desirability function approach (DFA), grey rational analysis (GRA), fuzzy logic (FL) approach, loss function (LF) method, principal component analysis (PCA), process capability index (PCI), utility concept, data envelopment analysis ranking (DEAR) approach, multiple-criteria decision making (MCDM) methods, global criterion method (GCM), goal programming, etc. In the last two decades, many improved and hybrid methodologies have also been introduced and applied.4–10 Some of these methodologies are very popular nowadays among researchers and non-statistical practitioners because they are attractive, easy to understand, and implement.
Apart from the previously mentioned MRO methods, the majority of which belong to scalarization methods with a priori preference expression, one needs to emphasize the great potential of Pareto methods with a posteriori preference expression for solving MRO problems. Many laser processing studies highlight the great receptivity of the modeless TM-GRA approach for determining MRO solutions. In an attempt to determine even better and more realistic MRO solutions, a hybrid method, referred to as the RSM-GRA approach, has also been proposed. Likewise, the desirability function approach (DFA) stands as one of the most frequently used optimization techniques among many others. Given that, when applied to the same MRO problem, different MRO techniques may yield different optimization solutions, the goal of this study is to compare and assess the two most popular MROs, that is, DFA and GRA, while solving five real case studies in laser processing technologies. Based on experimental data, multiple mathematical models were developed for the approximation of observed physical phenomena in aforementioned laser processing technologies, upon which both MRO approaches were applied, compared, and discussed. In order to assess and verify the domination of obtained MRO solutions, the relative target deviation (RTD) criterion was used.
Optimization methodologies
In this study, to determine laser processing conditions within the region of interest that simultaneously optimize multiple responses, two approaches, that is, DFA and GRA were applied, compared and discussed.
Grey relation analysis (GRA)
Grey system theory (GST) was introduced and formally established by Deng. 11 This theory (in contrast to many other cross-disciplinary theories) has been rapidly developed and introduced into various areas of research (manufacturing, agriculture, economics, meteorology, hydrology, geology, medicine, etc.) with great success in practical applications. 12
GRA is one of the most important branches of GST. GRA helps to overcome the shortcomings of classical statistical methods. Namely, GRA provides an assessment of the behavior of the unknown systems/processes under very unfavorable circumstances (small sample size, uncertainty and non-determinism of information, unknown sample distribution, etc.).
According to this concept, every system in the real world can be considered as a grey system. In complex manufacturing processes there are multiple and contradictory objectives (quality characteristics) to be analyzed. Essentially, GRA converts MRO into an equivalent single-response optimization problem, which is much easier to analyze and solve.
The first step of GRA is grey relation generation (also known as data pre-processing), because raw empirical experimental data cannot be used in GRA. 13 During this procedure, experimental data are normalized in the range [0, 1], where the original sequences are transformed into comparable sequences.
One sequence will be the best option if all of its quality characteristics are the closest to or equal to one. In this sense, the comparable sequence should be the closest to the reference sequence, which can be defined as:

In GRA, the following equations for linear data pre-processing are used7,10,14:
Smaller-the-better (STB):

Larger-the-better (LTB):

Nominal-the-best (NTB):

where i = 1, 2,…, N and k = 1, 2,…, m,
Grey relational coefficient (GRC) expresses the strength of the relation between the target (ideal) and the actual (experimental) quality characteristic. GRC is defined by the equation:

where
Deviation sequences are determined by the following relations:


Grey relational grade (GRG) represents the degree of correlation between the referential sequence and the comparable sequence. The overall GRG is calculated as follows:
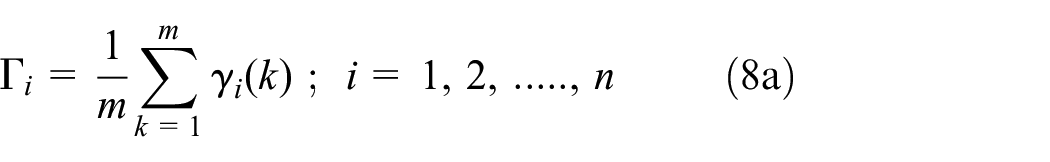
In real manufacturing processes, the importance of quality characteristics may be different. 16 Therefore, in such cases, the GRG is calculated according to the equation:
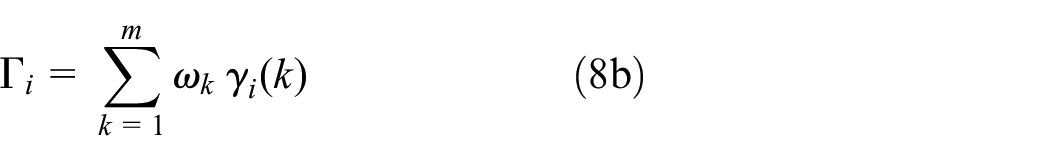
where
By using the GRG, the MRO problem converts into a single-response optimization problem. The higher the GRG, the closer the corresponding process parameter combination levels to the optimal values.
Desirability function approach (DFA)
DFA is considered as one of most popular, receptive method for solving MRO problems by converting them into single response problems. To improve the original DFA several desirability functions (DFs) have been proposed.17–22 Recently, a novel DF was introduced. 23 This DF was defined as:

where
Note: For the one-sided DF
According to the category of response, the individual DF from equation (9) can be defined as:
- for the STB:

with
- for the LTB:
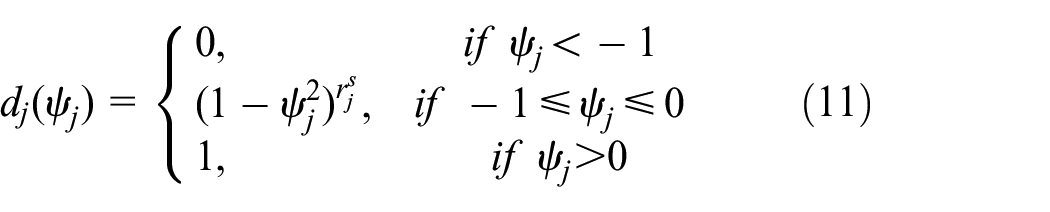
with
- for the NTB:

with
where
For more details on this DF, which was used in the present research, readers are referred to recent studies.23,24
The overall desirability was defined by Harrington 17 and Derringer and Suich, 18 respectively, as the geometric mean and as the weighted geometric mean of the individual desirability functions:
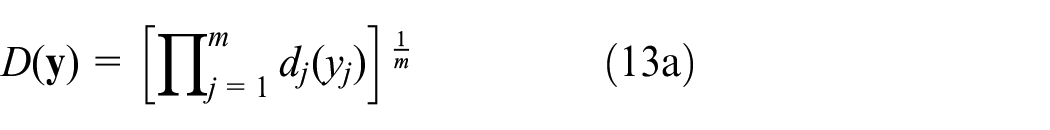

where
Case studies
The assessment and comparison of the response surface methodology (RSM)-GRA and DFA methodologies will be demonstrated on five laser processing case studies that have been previously studied in the literature.
Case study 1
Madić et al.25,26 investigated and optimized the CO2 laser cutting process of AISI 304 (X5CrNi18-10) austenitic stainless steel.
The four design factors (process parameters) on three levels defined the experimental space over which the laser cutting process optimization would be performed, as depicted in Table 1. By choosing the three levels for all factors, the curvature effect could be identified. In this research, the standard orthogonal array (OA) L27 (313) was adopted, which consists of 13 columns at three levels and 27 rows that represent the individual trials (26 degrees of freedom).
Laser cutting parameters and their levels.

The experimental results were expressed in terms of the following quality characteristics (responses): surface roughness R a (µm) –y1, kerf width w (mm) –y2, heat-affected zone HAZ (µm) –y3, kerf taper angle α (°) –y4, and burr height b (mm) –y5. The selected cut quality characteristics are important because they help to establish appropriate tolerances and required product quality without the need for post-processing.
Since the description of the experiment in this case study is very extensive, the readers are referred to the original papers for more experimental details.25,26
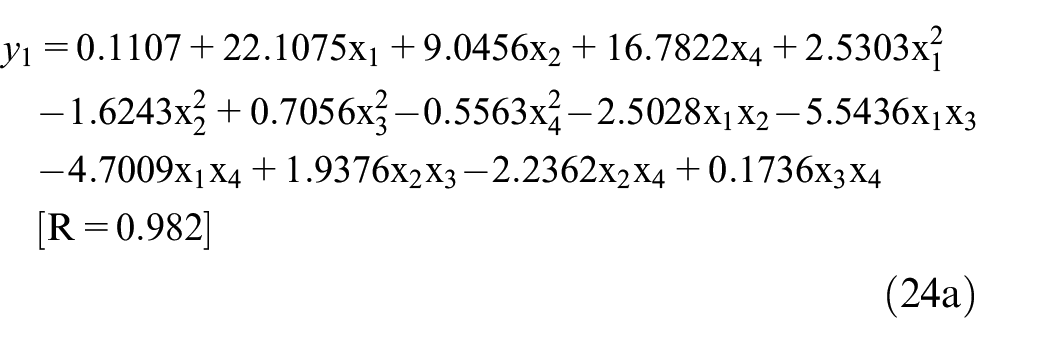
In this study, for approximation of the functional relationships, the second-order (quadratic) and third-order (cubic) mathematical models were developed:

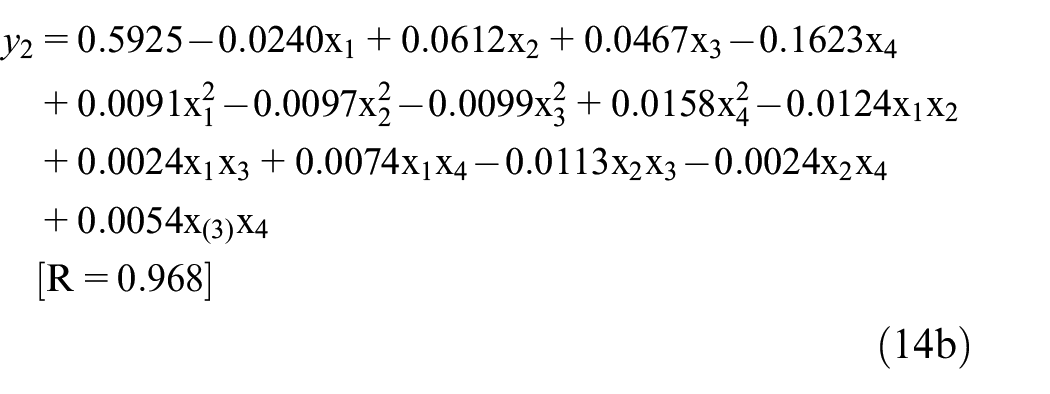


Note: As usual, in equation (14) the design factors (process parameters) are marked with the symbol “x.”
The intermediate values of coded design factors between 1 and 3 are calculated from the following relationship:
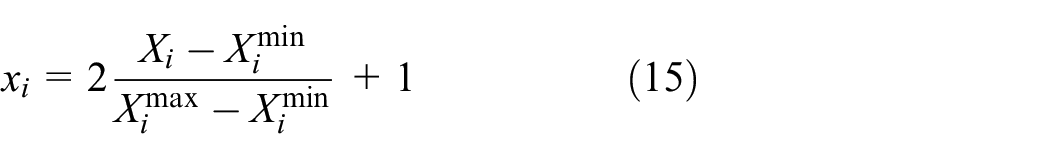
where
By applying the GRA, at first all quality characteristics were scaled using equation (2). After that, the absolute differences and GRCs were calculated by employing equations (6) and (7). It should be noted here that the distinguishing coefficient was set to 0.5 for all quality characteristics.
In this experiment, the decision maker (DM) designated different priorities for the observed quality characteristics. In this sense, function y5 should be of the highest importance, functions y1 and y4 of moderate importance, and functions y2 and y3 of the lowest importance. Accordingly, the following relative weights were adopted:
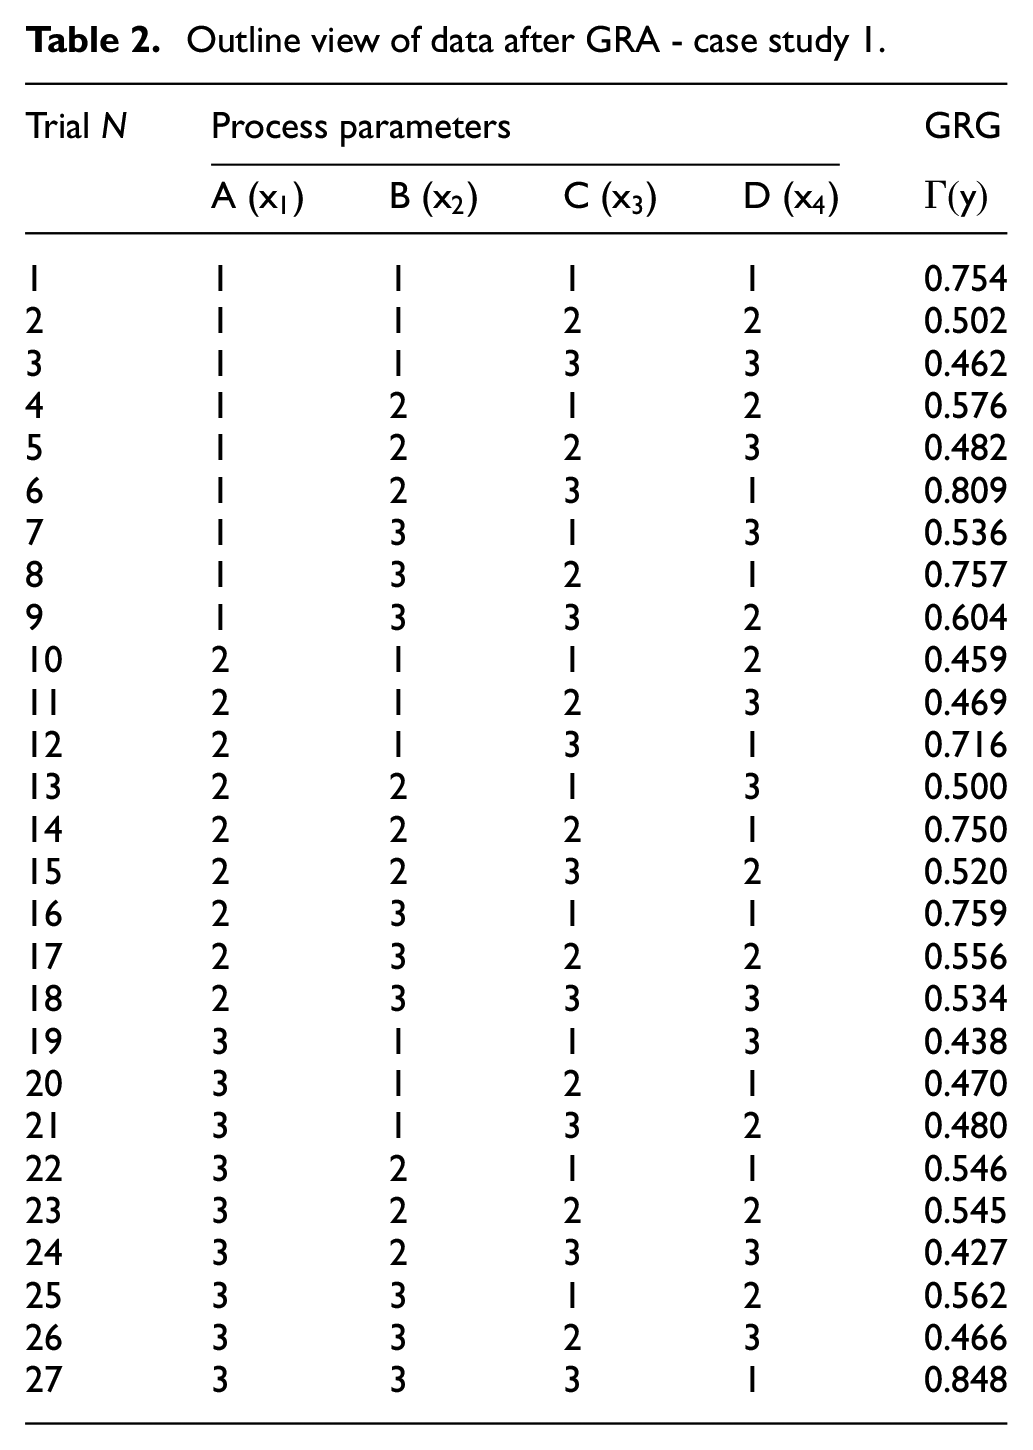
Consequently, the weighted GRGs were calculated using equation (8b; Table 2).
Outline view of data after GRA - case study 1.
Using the GRA procedure directly, the highest rank of GRG is associated with experimental trial N27 and, consequently, the laser cutting parameter level combination A3B3C3D1 represents the best solution with the corresponding response values
In the present study, in an attempt to find a potentially better MRO solution, another optimization approach was attempted, namely, the response surface methodology (RSM) coupled with GRA. This procedure involves two consecutive steps. The first step consists of the collection of data for optimization, as described above, while in the second step the relationship between the dependent variable (grey relational grade – GRG) and independent variables (design factors) should be established. The function defined in this way is further subject to optimization.
In this study, the data collected in Table 2 were exploited to fit the following second-order model:

Actual and predicted GRG values are graphically shown in Figure 1. It is clear that most points fall close to the line which has a slope of approximately 45°. The value of R for Γ is reasonably high, also indicating a good fit between the mathematical model and the actual data.

Graph of actual versus predicted GRG values - case study 1.
The aim of optimization in this case study is to maximize the GRG value. In the present study, for the purpose of optimization of objective functions, a pattern search (PS) algorithm was applied given that this algorithm represents an efficient alternative for solving engineering optimization problems.
27
In many cases, like in the studies presented in this paper, the optimal solutions obtained by the PS algorithm do not depend on the choice of initial points.
27
As a result of optimization, the point
One has to note that the optimization solution does not coincide with the combination of process parameter levels from the experimental matrix, which is typical for applying GRA and Taguchi-GRA hybrid approaches.4–6
Also, it should be kept in mind that equation (16) represents the response surface for GRG. It is clear that the prediction of the GRG will be more reliable for a larger experiment. In that sense, full factorial design is always better than fractional factorial design. Unfortunately, for practical reasons, the fractional factorial design is the most common option (as in this study).
When applying the DFA one should first set bounds for each response of interest. Since there is no additional decision maker’s preference information about responses, ranges of response values obtained in the experiment can be considered to choose their bounds. Apparently, in this investigation smaller values of all responses are desirable. Table 3 depicts the response type (smaller-the-better) and bounds for the responses.
Response types and their bounds - case study 1.

The same (standard) shape parameters were selected for all the five individual desirability functions (
As a result of optimization, the point
This solution can be treated as the initial (zero) solution, because DFs have the inherent flexibility that allows the researchers to find an improved solution. This property of DFA can be very useful, because DM may always strive for a better and more receptive solution. To this aim, a shape-based and/or bound-based interactive procedures can be implemented.24,28
According to the initial solution and bounds given in Table 3, the bound-based interactive approach seems to be a logical choice in this example. Therefore, previous bounds for responses
One can argue that the new solution is a considerably better compromise solution than the initial one.
Generally speaking, the iterative procedure can be continued. However, in this case it does not seem that significantly better solutions could be found in the next iterative steps.
Figure 2 shows an overlaid contour plot of the overall desirability function along with quality characteristics as constrained functions. The numerically obtained optimal point is in close agreement with the location of the optimum that would be obtained by visual inspection of Figure 2.

Desirability contour plot in case study 1 (X2 = B: cutting speed at optimal level (3 m/min); X3 = C: gas pressure at optimal level (12 bar)).
The optimization results for both approaches are summarized in Table 4.
Comparison of the optimization results for case study 1 – laser cutting process.

Better result is identified by underscore.
The optimal setting should represent the best balance (trade-off) between the considered responses (quality characteristics). In this case, both optimal solutions are almost identical and the DM must ultimately choose one of the two solutions offered. By pair-wise comparison of the optimal values of responses, the DM will face a tough choice, a dilemma they would like to avoid. The dilemma rests in the choice between two similar solutions. When there are many alternative solutions, choosing the best alternative becomes even more subjective and thus an almost unsolvable problem for DM. In such cases, relative target deviation (RTD) can be used as a comparison criterion.22,23
Since in the considered example the DM did not have a posteriori information about the process under investigation, according to the RTD criterion, the optimal solution obtained with DFA seems to be a slightly better choice. This solution matches the DM priorities quite well. Namely, this is a solution with optimal performance on the burr height, very good performance on the kerf taper angle, the size of the HAZ and the surface roughness, as well as quite acceptable performance on the kerf width. For this result, it is necessary to keep the cutting speed and gas pressure at the highest level, laser power at a very high level, but laser focus at the lowest level.
Case study 2
Nagesh et al. 29 investigated and optimized the laser drilling process of a carbon glass reinforced polymer composite. In this research, the design factors of interest were as follows: laser power (x1), pulse frequency (x2), scanning speed (x3), and carbon black (x4; Table 5).
Laser drilling parameters and their levels.

The HAZ (y1) and taper angle (y2) were chosen as quality characteristics (responses). In this investigation, the standard L16 (45) OA was used, with four factors for each of four levels (Table 6). The specimens, made of a carbon black/vinylester/glass laminate with the thickness of 3 mm, were laser drilled using a Rofin Sinar SC-30 CO2 laser with the spot diameter of 370 μm. The trepanning drilling method was used for drilling holes with the diameter of 2 mm. 29
Experimental matrix and responses.

The spread of the data in the normal probability plots of the residuals for HAZ and taper angle reveals that the drilling process is carried out under stable conditions, validating the normality assumption.
In this study, the second-order polynomial model was used for fitting both regressions:

The intermediate values of coded design factors between 1 and 4 were calculated from the following relationship:

Table 7 shows the GRG values and its rank for each trial. The GRG was calculated according to the previously described procedure.
The GRG values and rank for each trial.

According to this criterion, laser drilling parameter level combination from experimental trial No. 6 represents the best solution.
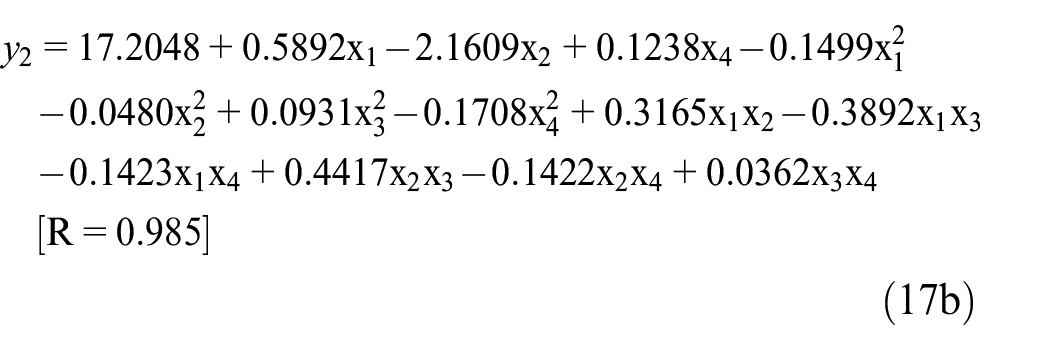
In this case study, the data collected in Table 6 were exploited to fit the following second-order model:

The graph of actual and predicted GRG values in Figure 3 indicates a very good correlation of data.

Graph of actual versus predicted GRG values - case study 2.
As a result of optimization, the point
For the purposes of applying the DFA methodology, it was necessary to define the bounds for observed quality characteristics. In this example, it was observed that in the given experiment the quality characteristics (responses) change at the following intervals: y1∈[0.660–0.995] μm, y2∈[6.268–15.885]°. Table 8 shows the response type and chosen bound values for both responses.
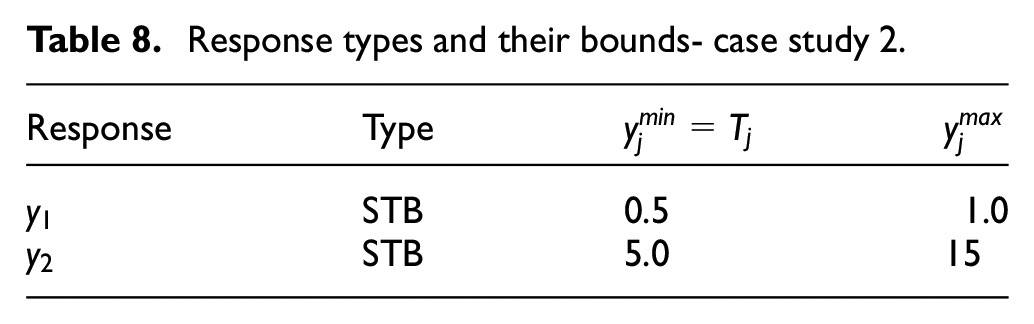
Response types and their bounds- case study 2.
The same (standard) shape parameters were selected for both individual desirability functions (
The complete results obtained by using the RSM-GRA and DFA methodologies are summarized in Table 9.
Comparison of the optimization results for case study 2 – laser drilling process.

Better result is identified by underscore.
In their work, Nagesh et al.
29
utilized a hybrid approach, namely the Taguchi method coupled with grey rational analysis (TM-GRA), to solve MRO problems simultaneously. By using this approach they found the combination A4B4C1D4 as a (near) optimal parameter setting, that is,
Given that each response model is usually developed in terms of coded input variables (design factors), one could easily analyze the established relationships qualitatively and quantitatively as well as assess the (statistical) significance of model parameters (main effects, two-factorial interactions, quadratic effects, etc.). Likewise, if one considers the overall desirability as a response of interest, the application of standard DOE methodology would reveal the extent and nature of the influence of design factors and their interactions. For the sake of illustration, if one applies a standard two-level 24 factorial design, it can be shown that, at the level of significance of 0.05, the overall desirability is statistically significantly affected by the main effects of design variables x3 and x4 (scanning speed and carbon black weight percentage) and the interaction of design factors x1 and x2 (laser power and pulse frequency). The estimated effects are as follows: main effect of carbon black weight percentage 0.417, main effect of scanning speed −0.216 and two-factorial interaction of laser power and pulse frequency −0.195. Therefore, one can argue that for increasing the overall desirability value, it would be beneficial to increase the value of design variable x4 (black weight percentage) and decrease the value of design variable x3 (scanning speed). Also, based on the analysis of the two-factorial interaction plot, not shown here due to space restrictions, one could also observe that for an increase in the overall desirability value, it is beneficial to combine a high level of pulse frequency with a low level of laser power. The derived analysis completely corroborates the determined MRO results from Table 9.
Case study 3
Sathiya et al. 30 reported MRO of laser welding of 904L stainless steel. As design factors (process parameters) of interest the following factors were considered: beam power (x1), travel speed (x2), and focus position (x3). Their levels are listed in Table 10.
Laser welding parameters and their levels.

The tensile strength (y1), bead width (y2), and depth of penetration (y3) were chosen as quality characteristics (responses). Three independent experiments based on L27 (311) OA, each with a particular shielding gas, were carried out. The analysis and results in this paper refer only to the welding process with argon shielding gas.
The higher-order polynomial model was used for fitting the following regressions:

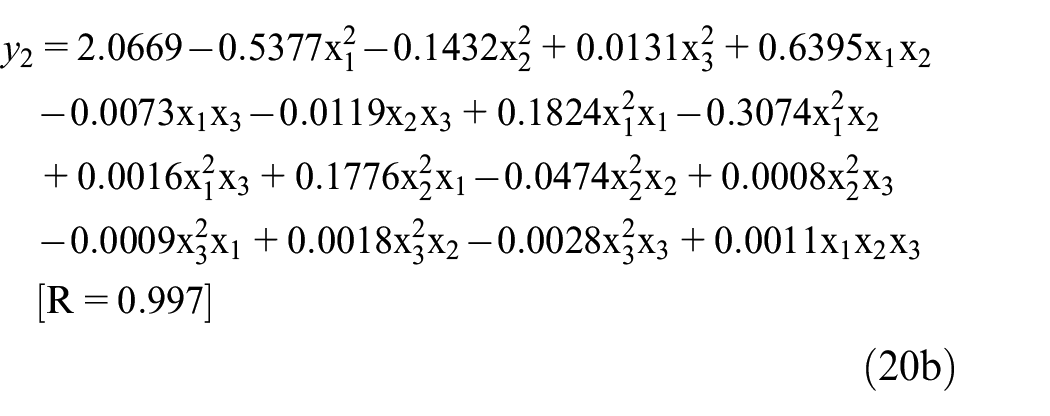

Table 11 shows the GRG values calculated according to the known procedure.
Outline view of data after GRA - case study 3.

In this example, a weighting approach was also used for the optimization of laser welding quality characteristics. Namely, the following relative weights were adopted:
The cuboidal mathematical model was employed to approximate the relationship between process parameters and the GRG:

Actual and predicted GRG values are graphically shown in Figure 4.

Graph of actual versus predicted GRG values - case study 3.
After the optimization procedure, by using equation (21), the point
When the DM’s preference information about responses is not known in advance, ranges of response values obtained in the experiment can be considered to choose their bounds. In the given experiment, the considered quality characteristics changed at the following intervals: y1∈[565–635] MPa; y2∈[1.563–2.123] mm; y3∈[2.693–2.932] mm. Also, it should be noted that in this case study the different types of the observed responses were desirable as presented in Table 12.
Response types and their bounds - case study 3.

The same shape parameters were selected for all individual desirability functions (
Comparison of the optimization results for case study 3 – laser welding process.

Better result is identified by underscore.
Sathiya et al.
30
also applied the hybrid TM-GRA approach to solve this laser welding MRO problem. By applying this approach these authors found the optimal parameter combination at the point
Case study 4
Acherjee et al. 31 reported MRO of Nd:YAG laser micro-channeling on poly (methyl methacrylate; PMMA) in underwater conditions. Four basic process parameters were taken into account, namely laser current (x1), pulse frequency (x2), pulse width (x3), and cutting speed (x4). Table 14 shows the values of all parameters at different levels.
Laser micro-channeling parameters and their levels.

Three quality characteristics were considered as output responses, namely, micro-channel depth (y1), burr width (y2), and burr height (y3). The experimental matrix was designed based on standard L16 (45) OA. It should be noted that this is a highly fractionated factorial design with only 16 trials.
The second -order polynomial model was used for fitting the following regressions:


Also, in this case study a weighting approach was used for calculating the GRG. The weighting ratios for responses were set as 2:1:1, respectively. Table 15 shows the GRG values for each individual trial.
Outline view of data after GRA - case study 4.

According to the GRA concept, the process parameter values associated with the highest GRG represent the best optimization result. In this case, trial No. 7 corresponded to such a criterion.
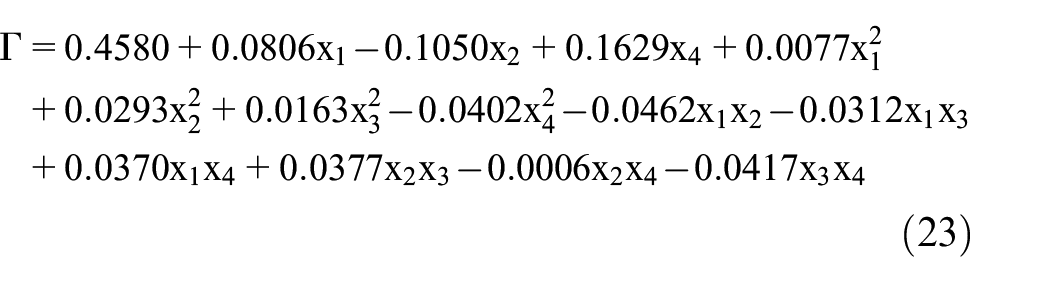
The data presented in Table 15 were exploited to fit the following second-order model:
Actual and predicted GRG values are graphically shown in Figure 5.
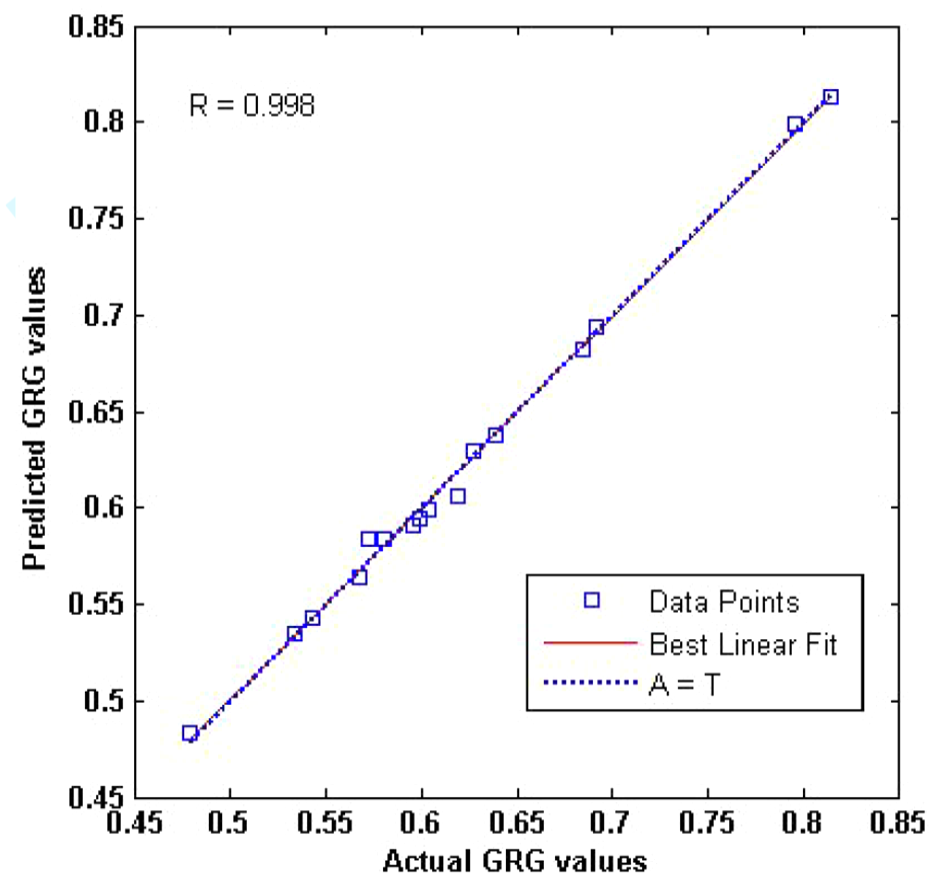
Graph of actual versus predicted GRG values - case study 4.
After the optimization procedure, by using equation (23), the optimal solution in the point
To apply the DFA optimization methodology, it is necessary to define the individual desirability functions for all responses as well as the corresponding bounds. In this example, the experimental data indicate that the observed responses lie in the following intervals: y1∈[33.43, 121.3] μm; y2∈[5.89, 99.72] μm; y3∈[33.05, 128.15] μm. The adopted bounds for different responses are listed in Table 16.
Response types and their bounds - case study 4.

The same shape parameters were selected for all one-sided individual desirability functions (
As a result of optimization, the point
The comparative results obtained by using the RSM-GRA and DFA methodologies are summarized in Table 17.
Comparison of the optimization results for case study 4 – laser micro-channeling process.

Better result is identified by underscore.
By applying the hybrid TM-GRA approach to solve this laser micro-channeling MRO problem, Acherjee et al.
31
found the (near) optimal process parameter setting
Case study 5
Lian et al. 32 applied TM-GRA for MRO of process parameters in laser cladding. In the experiment, four process parameters were taken into account: laser power (x1), scanning speed (x2), gas flow (x3), and tungsten carbide powder ratio (x4). Table 18 shows the values of all parameters at different levels.
Laser cladding parameters and their levels.

The clad quality characteristics investigated were micro hardness (y1), wear volume (y i ), and cladding efficiency (y3). The experiment was performed based on standard L16 (45) OA. In this study, the experimental matrix consisted of the first four columns of the original OA (fifth column is blank).
The second-order regression equations were fitted for each of the three responses:


The GRG values for each individual trial are presented in Table 19.
Outline view of data after GRA - case study 5.
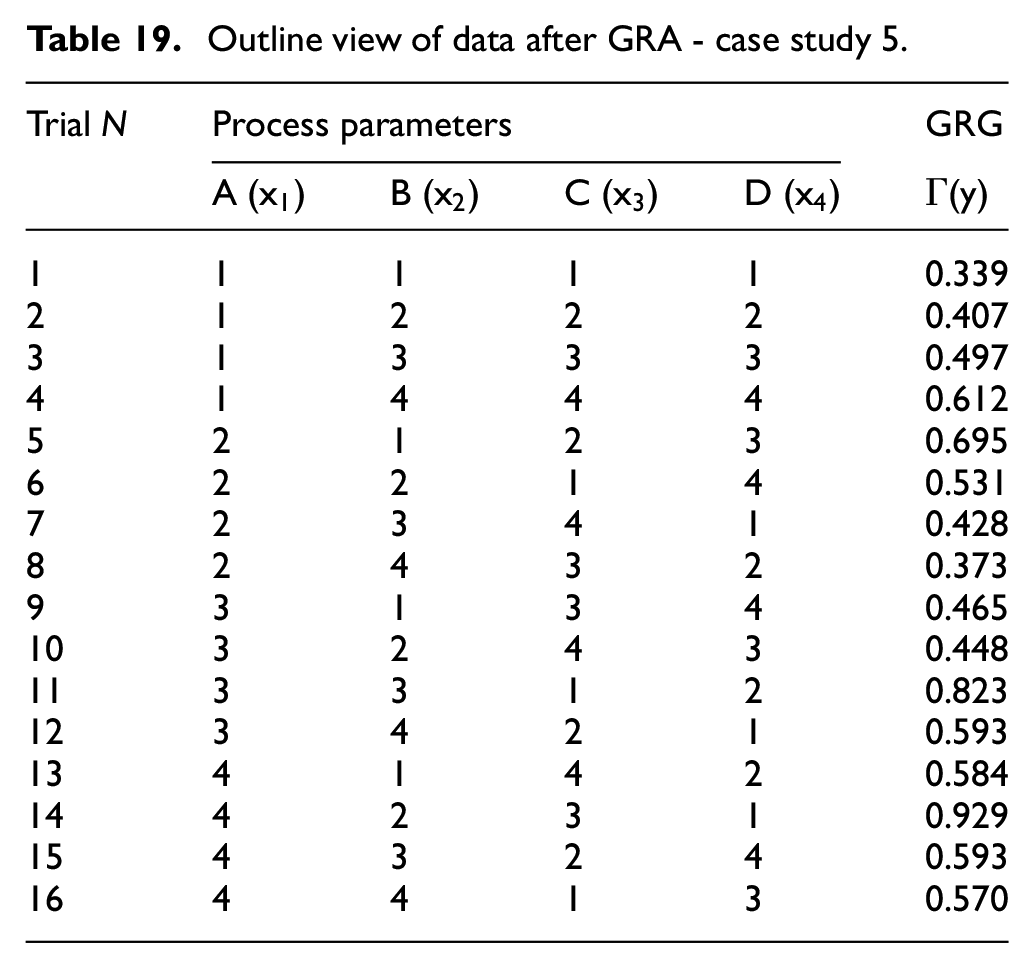
Since the higher value of GRG is more desirable, trial No. 14 in Table 18 indicates the best process parameters setup.
The data from Table 19 were used for fitting the second-order GRG model:

The graph of actual versus estimated GRG values is shown in Figure 6.

Graph of actual versus predicted GRG values - case study 5.
Applying the RSM-GRA approach and using equation (25), the optimization procedure in this case generated the optimal solution at the point
For the purpose of applying the DFA optimization methodology, from the experimental matrix in the original work the following intervals for each considered responses was observed: y1∈[34.4, 63.5] HRC, y2∈[0.0018, 0.0033] mm3, y3∈[36.2008, 43.9969] mm3/s. The adopted bounds for different responses are presented in Table 20.
Response types and their bounds - case study 5.

Also, in this case the same shape parameters were selected for all one-sided individual desirability functions (
The comparative results obtained by using the RSM-GRA and DFA methodologies are listed in Table 21.
Comparison of the optimization results for case study 5 – laser cladding process.
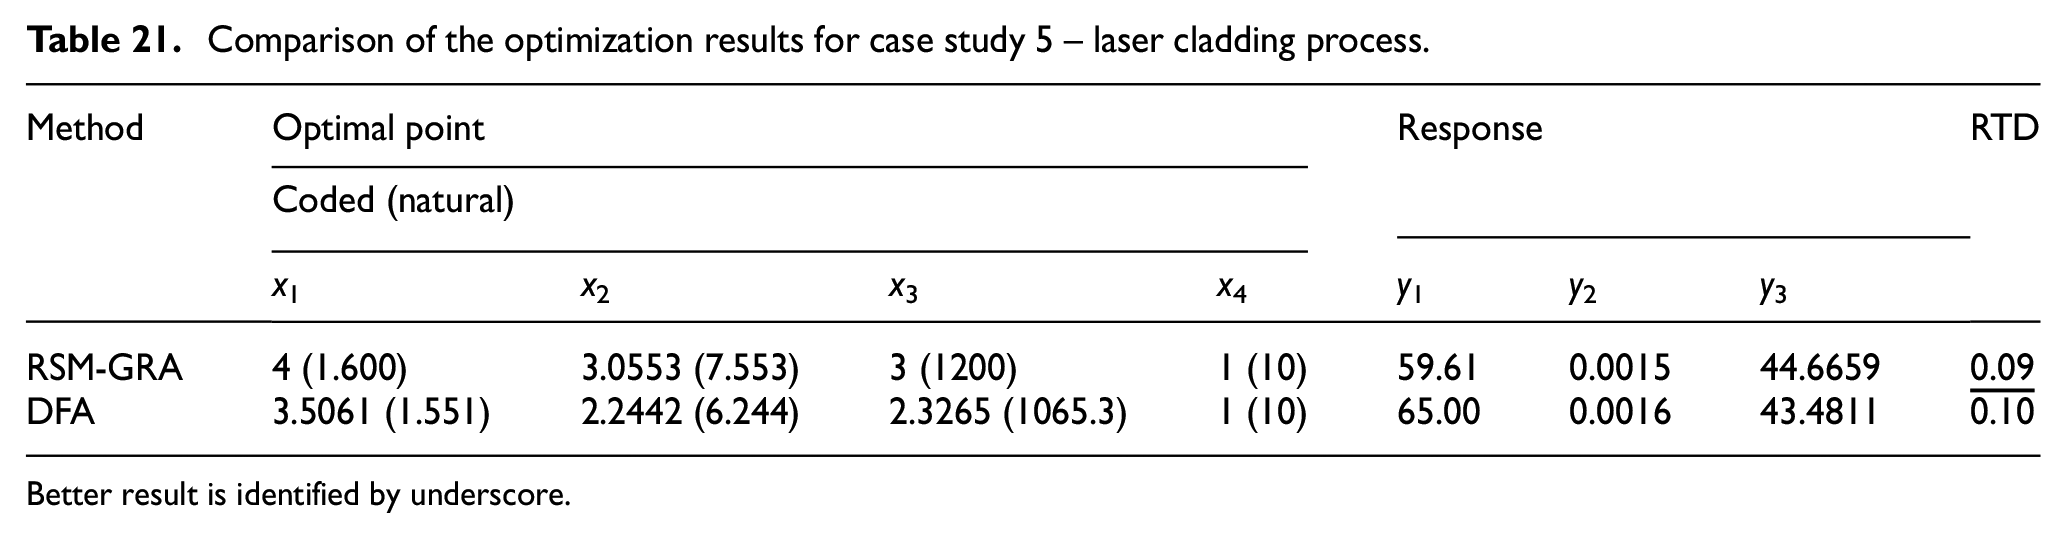
Better result is identified by underscore.
Using the TM-GRA approach to solve the laser cladding MRO problem, Lian et al.
32
found the (near) optimal process parameter setting
Discussion
The Taguchi method (TM) is a unique, powerful, and widely accepted and most frequently applied statistical technique among engineers and quality experts, because it is a simple, easy-to-use, time saving, less expensive method compared with the traditional DoE, especially with the full factorial design, and it also does not require any mathematical model. However, TM is applied only for solving a single-response problem; it cannot be used to optimize a multi-response problem. On the other hand, the optimal solution obtained by means of TM is a near optimal solution, because the result of optimization is limited to the previously selected factor levels, although another combination of factor values in the experimental space may yield a better solution.
Grey relational analysis (GRA) is used as a multi-response optimization technique with great success in many practical applications. To apply this technique, it is necessary to convert multiple responses (quality characteristics) into an equivalent single response (called grey relational grade, GRG), which is to be analyzed and optimized. In direct application, the optimal solution corresponds to such a combination of design factors among all experimental trials that produces the maximal GRG value. In that sense GRA belongs to the class of multi-criteria decision making (MCDM) methods. The disadvantage of this method is that the optimization approach comes down to choosing the best among the available experimental results. Therefore, many researchers utilize a hybrid TM-GRA methodology to solve MRO problems simultaneously. Although this approach outperforms the original TM in terms of performance, it cannot provide a global or conditionally optimal solution (see Case study 2). Related to the mentioned Case study 2, a general methodological approach, based on the use of DOE principles, was also proposed so as to gain new knowledge and additional insights into the effects of process parameters on the resulting overall desirability and MRO results.
By comparing the optimization results, it is evident that both RSM-GRA and DFA provide very similar optimal solutions for case studies 1 and 5. However, for the other case studies considered in this paper the DFA guarantees noticeably better solutions. In connection with this, it should be noted that the optimization results do not depend only on the optimization methodology used and the chosen mathematical model. Namely, it should be kept in mind that the problem of poor quality of experimental data in the statistical sense appears relatively often in engineering practice. The consequences of that can be nonconstant variance, often in conjunction with non-normal distribution of the response.
The summary of the obtained MRO results for both approaches, in terms of the average percentage difference in considered responses, is given in Table 22.
Summary of MRO results for RSM-GRA and DFA approaches.
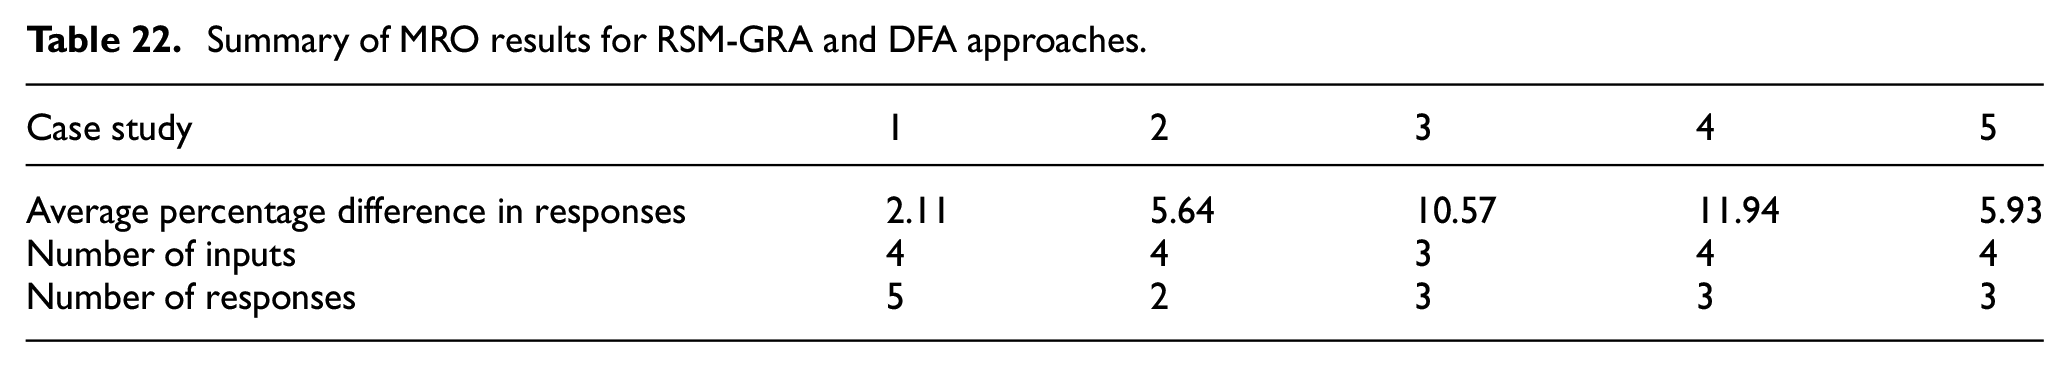
As could be observed from Table 22, the highest average percentage difference in response values of 11.94% for both approaches is obtained in case study 4. On the other hand, the lowest average percentage difference in response values of 2.11% was observed in case study 1. With respect to the number of inputs and responses, it turns out that one cannot assume that DFA would yield significantly better MRO results when the number of responses and inputs are increased. However, unlike the RSM-GRA approach, in applying the DFA approach one can change preference parameters (weights and shape factors), ideally through an automatic computational procedure, so as to determine a variety of optimal solutions, some of which are more receptive for a particular case study. This could be very beneficial given that some optimization solutions may lead to processing conditions that are more costly and hazardous, or are more difficult to implement and control. 22
Data transformation is an effective and appropriate way for simultaneous stabilization of the response variance and improvement of the mathematical model fit to the data.
33
The family of power transformation
In this study, the application of the Box-Cox procedure is done in case study 3. Although original data (see Table 10) do not deviate substantially from the normal distribution (skewness = 0.163, excess kurtosis = −0.832), the Box-Cox procedure yielded the parameter value
One can argue that even when applying the same optimization approach estimated responses from different mathematical models may differ. Therefore, the performance of DFA can depend to some extent on the model quality.
Conclusions
In the frame of multi-response optimization, different optimization approaches were applied, specifically, DFA, TM-GRA, TM-UF, TM-FL, LFA, and many other existing methods. In the context of laser processing technologies, additionally, a hybrid RSM-GRA approach was proposed.
The analysis in this paper revealed that RSM-GRA and DFA have good performances and both methods can certainly be useful and efficient for determining the optimal operational conditions in laser processing technologies, which can provide the best compromise between several quality characteristics.
In the context of multi-response optimization in laser processing technologies, different optimization approaches were applied, specifically, RSM combined with GRA and DFA. Both methods can be useful and efficient for determining the optimal operational conditions in laser processing technologies, which can provide the best compromise between several quality characteristics. Although both methods guarantee satisfactory compromise solutions, by comparing the two methods, it was shown that the DFA had better performance in general than the integrated RSM-GRA. In addition, the DFA is a less complicated and tiring optimization approach than the RSM in conjunction with GRA. On the other hand, the comparative analysis of the optimization results for the considered case studies in this paper shows that the RSM-GRA and the most commonly used in practice, hybrid TM-GRA, provide similar and comparable solutions. The first approach is slightly more promising than the second approach, if at all. Again, the DFA clearly outperforms both of these methods. In comparison with the TM-GRA approach, which actually permits only discrete optimization of process parameter values used in the experimental design, the two multi-response optimization approaches analyzed in the present study search and determine the optimization solution, which may consist of arbitrary process parameter values from a continual domain within the covered optimization space. Also, unlike RSM-GRA, DFA has its inherent flexibility, thanks to which an improved solution can be reached in an iterative manner in a reasonable number of iterations. Admittedly, this procedure can be tedious and time-consuming, especially for large-sized optimization problems, but the benefit of a better solution can cover this loss. Many executive (search) algorithms coupled with RSM-GRA and DFA methodologies may be very effective and efficient regardless of the problem at hand. It has also been shown that by using DOE principles one can gain new knowledge and additional insights into the effects of process parameters on the resulting overall desirability and MRO results.
When solving a particular multi-response optimization problem, researchers can always use different optimization methods, compare the results and then choose a better method for a given engineering problem. After all, no one can claim that any of the optimization methods is superior to the others in every real-world application.
Finally, the complexity of laser processing technologies and the existence of a number of uncontrollable and noise factors indicate that the consideration of response variations in the formulation of MRO problems is of utmost importance in an attempt to improve the overall process capability indices. This is a particularly important issue given that laser processing technologies are today omnipresent in high-volume production.
Footnotes
Appendix
Notation

| Parameters and variables | |
| design factor (input variable) | |
| vector of design factors | |
| response (output variable) | |
| vector of responses | |
| predicted response | |
| optimal predicted response | |
| ) | relative weight |
| grey relational coefficient | |
| deviation sequence | |
| grey relational grade | |
| dimensionless converting function | |
| ) | individual desirability function |
| shape parameters | |
| target value | |
| overall desirability | |
| grey relational grade regression function | |
| Abbreviations | |
| multi-response optimization | |
| desirability function approach | |
| grey relational analysis | |
| grey relational coefficient | |
| grey relational grade | |
| design of experiments | |
| orthogonal array | |
| response surface methodology | |
| relative target deviation | |
| Taguchi method | |
| Fuzzy logic method | |
| Loss function approach | |
| TM coupled with GRA approach | |
| RSM coupled with GRA approach | |
| TM coupled with FZ approach | |
| TM coupled with UF approach | |
Handling Editor: Aarthy Esakkiappan
Declaration of conflicting interests
The author(s) declared no potential conflicts of interest with respect to the research, authorship, and/or publication of this article.
Funding
The author(s) disclosed receipt of the following financial support for the research, authorship, and/or publication of this article: This research was financially supported by the Ministry of Science, Technological Development and Innovation of the Republic of Serbia (Contract No. 451-03-47/2023-01/ 200109).