
Abstract
This paper introduces an innovative spectral analysis control approach aimed at monitoring and diagnosing machine malfunctions to prevent potential failures. The research was conducted on a critical machine in a major industrial enterprise. The proposed method involves the use of a new indicator, called Overall Level (OL), that evaluates the machine’s condition before any operation. This study showcases practical methodologies for transitioning from time-based maintenance to predictive strategies, furnishing actionable insights into machine condition. This yields tangible advantages for the industry in terms of optimizing maintenance practices and enhancing asset productivity. Additionally, various methods, including vibration analysis, performance monitoring, and data analysis, are employed to identify the causes of issues and recommend solutions to enhance the reliability of the turbo compressor. The results provide a clear representation of the machine’s vibration state for diagnostic purposes. This noteworthy intervention underscores the potential of incorporating the measured and calculated values of the OL indicator across three specifically chosen frequency bands. To achieve this objective, the average value is employed as an indicator, contributing to the enhancement of reliability and longevity of critical industrial machinery. In this context, the novelty of the findings resides in the advanced diagnostic capabilities of the turbocompressor, thereby augmenting the efficacy of condition-based preventive maintenance for the BP 103 J turbine. The ultimate goal is to extend the equipment’s lifespan, improve the efficiency of the rotating machinery fleet, reduce maintenance costs, and enhance parameters such as availability and reliability through the support of an electronic maintenance system.
Keywords
Introduction
The imperative for an objective, reproducible, and dependable communication of subjective impressions or sensations in machine monitoring has mandated the quantification of vibration through amplitude measurement. To realize this, rapid determination of values, frequencies, and quantities of dominant components is essential. The integration of cost-effective analog-digital converters and specialized coprocessors for Fourier transform calculations in device vibration measurements has facilitated the correlation of vibrational frequencies of each component with distinct dynamic forces arising from normal or abnormal machine operations. This integration enables a more comprehensive diagnosis and interpretation of developments, notwithstanding the equipment’s intricacy. 1 Minimizing unnecessary interventions, reducing repair time, and delivering a reliable and easily interpretable diagnosis are vital elements ensuring the success and sustainability of the company. The practice of maintenance in operational conditions (MOC) is indispensable for overseeing the production system, guaranteeing the control of the desired end system throughout its operational phase to optimize overall performance.2,3
The contemporary focus in vibration analysis for maintenance of rotating machinery has transitioned from mere demonstration of its value to a profound comprehension of the fundamentals and limitations of diverse techniques. This shift is imperative due to the unacceptable nature of failures given the complexity and criticality of machines in the production process.4,5 Reliable and precise measurements of machine conditions are pivotal for effective predictive maintenance.6,7 The selection of the most pertinent indicators is a critical aspect of monitoring strategy.
Misinterpretation of operating conditions can lead to erroneous diagnoses, unwarranted repairs, and downtime, resulting in substantial economic losses. 8 Vibrations produced by machine operation may correspond to the fundamental frequencies of forces inducing harmonics. The vibration spectrum, depicting the amplitude and frequency of all components generated by machine operation, is a graphical representation. The vertical lines in the spectrum delineate distinct components, with frequency on the x-axis and amplitude on the y-axis.
In order to prevent excessive downtime and improve maintenance, condition-based preventive maintenance is employed.9,10 This method involves scheduling maintenance based on predetermined events such as signal levels from sensors, energy levels, noise levels, and vibration measurements. The system is only shut down when there is a high probability of failure, as determined by the analysis of indicator levels and established criteria.11,12
The research plan proposed in this paper aimed to identify the necessary components for designing a machine monitoring system in an industrial setting. 13 To achieve this, a set of functional solutions using technology is proposed. The goal of the system’s operational maintenance is twofold: to guarantee the smooth functioning of the current system and to adapt it to any necessary changes.14,15 In the final step, the data collected from the vibration measurements are processed and analyzed to determine the machine’s condition. The results of the analysis are then used to make informed decisions about maintenance and repairs, allowing for efficient and cost-effective operations. This approach helps extend the lifespan of the equipment, increase the efficiency of the rotating machinery fleet, reduce maintenance costs, and improve availability and reliability, leading to improved overall performance of the industrial enterprise.16,17
It is based on the principles of preventative maintenance, but its implementation is based on the condition monitoring and prediction of the machine’s state. Predictive maintenance is a proactive approach that aims to prevent machine failures by detecting and addressing issues before they cause significant downtime and damage.18,19 By using various monitoring techniques, such as vibration analysis, the state of the machine is constantly monitored, and early warnings are generated in the event of any potential failures. This leads to timely maintenance, resulting in increased machine availability, reduced maintenance costs, and improved machine reliability.
System dynamics indicate that a machine’s ideal rotation should not produce vibrations, and this notion is partially accurate in industrialized nations.20,21 Nevertheless, many machines experience failures due to: Incorrect installation; Adverse working conditions (environment, soil structure, etc.; Poor design or manufacturing faults and Interference from other machines in the vicinity.
This implies that in some instances, vibrations can occur in specific machines due to poor foundation, improper installation, flawed piping design, hydraulic imbalances caused by external factors, etc. Even after repairs, the aforementioned issues may diminish the machine’s inherent reliability. The vibration levels of these machines may not be completely eliminated, but if they meet the benchmark levels set for similar machines in the same environment and are within the acceptable range according to standards such as ISO 2372, 22 then the vibration levels can be considered satisfactory. To avoid misdiagnosis, the e-service model is implemented as suggested in Kebabsa et al. 11 This model employs surveillance techniques that enable the collection, storage, and analysis of additional parameters, such as the vibration speed (d), relevant to the current study. In this model, the diagnostic and prognostic benchmarks are not limited to the standard static load, but also incorporate feedback from similar machines and manufacturers. This allows the maintenance crew to make a more informed diagnosis based on the operating time, environment, and type of machine operation, leading to more efficient repairs and minimizing downtime and production costs. 23 Therefore, the interpretation of vibration data is a multifaceted process. The outcomes bear substantial and enduring consequences, as elevated vibration levels may signify compromised equipment condition. Analysis of the aerodynamic status of the system through double Fourier decomposition 24 can unveil the relationship between modes and temporal harmonics of the compressor, aiding in determining the necessity for repairs and costly revisions. Nevertheless, if the impact of these interventions is marginal, their justification may be questioned.
Many researches have focused on the vibratory diagnosis of industrial installations, particularly on analyzing indicators,12,25 to monitor equipment throughout its operational cycle. These analyses enable maintenance engineers to easily interpret results, often in the form of simple spectra, significantly enhancing the reliability and operational lifespan of critical machinery, a crucial aspect across various industries. Applying these decision-making references to machinery or other equipment, along with their inclusion in maintenance logs, helps avoid unnecessary repairs stemming from arbitrary decisions. The overarching goal remains to extend equipment lifespan and reduce production costs.
Note that vibration analysis has also been applied in the literature for the detection of specific defects occurring on rotating machines, like rolling bearing and gear defects. Several signal processing tools have then been developed and applied, namely cyclostationary analysis,26,27 time-frequency approaches using wavelet analysis and Empirical Mode Decomposition and its versions.28,29 The proposed approaches have shown to be very effective on laboratory test rigs, but remain not favored in industrial field.
Proposing a novel methodology for guidance monitoring
The conventional vibration monitoring parameters act as benchmarks for assessing the condition of large machines. However, relying on non-continuous indicators to gauge the severity of mechanical vibration across industries, without considering the actual context, is deemed insufficient. The rigid application of rules may prove impractical. The computation of these parameters involves processing data using Matlab, storing the acquired data, and conducting a diagnostic analysis.
The objective is to make accurate comparisons for the diagnosis and analysis of the overall system performance and enhance decision-making quality by integrating large amounts of real-time data to evaluate the current state of the turbocompressor. A diagnostic method has been developed specifically for the turbocompressor, which consists of various components such as the LP turbine, HP turbine, LP compressor, HP compressor, and other accessories. Neglecting proper maintenance and disregarding the manufacturer’s instructions can result in premature aging of the components and negatively impacts the performance of the turbocompressor.
This research work proposes a study of an approach to improve maintenance practices in an industrial company. In the first part, Weibull model is used to study the reliability of the machines. In the second part, vibration analysis is used to monitor the system and detect any failures, as well as evaluate the performance of all the machines in the industrial park.
Furthermore, an analysis of various failure modes, their consequences, and their criticality, utilizing a qualitative approach to examine operational safety in diverse fields is conducted. This technique provides an in-depth understanding of the system’s operation and interactions through a systematic analysis of cause-and-effect relationships. The acquired information is then integrated into a risk control framework,30,31 with the primary objective being to achieve a high level of operational safety for the functional system. This approach enables identifying key elements (functions and components), discover, evaluate, and classify system weaknesses, anomalies, and malfunctions.
Additionally, this approach facilitates:
Management of critical points and reassessment of the system’s design;
Recommendations for corrective actions;
Evaluation of the impact of these measures to ensure their effectiveness, enabling informed comparisons and decisions.
Therefore, reliability analysis plays a crucial role in optimizing maintenance practices as it enhances the system’s reliability while reducing the frequency of failures and improving its maintainability. By controlling the elements and their functions, it helps prevent losses and critical and catastrophic failures.
Investigating the reliability of turbo compressors
Turbocompressors 32 find widespread applications in diverse industries, owing to their capacity to elevate fluid pressure by manipulating fluid velocity. The operational energy required for compressor functioning is converted into kinetic energy, subsequently translated into pressure. Categorized based on fluid flow, turbo compressors can be classified as centrifugal, axial, and helical-centrifugal types.33–36 A centrifugal compressor operates by utilizing one or more impellers rotating within a casing, converting kinetic energy into static pressure through the expansion of a volute channel’s cross-section. It has been observed that enhancing the reliability of the 103J type turbomachinery operating in the industrial enterprise is imperative, as they manifest 92 deficiencies, constituting 51% of all identified deficiencies during the analytical period. 37
It seems that there is an issue with the maintainability of these machines, as the 11,700 h unavailability rate is greater than 47% of the total hours. It is then important to address this issue to improve the performance and reliability of the machines, the objective is to improve the availability of certain machines. Their artificial product “n.t” has a value of 539,127, with a reliability rate of 59%.
Reliability calculations offer valuable insights into the behavior and performance of equipment throughout its operational lifespan. The collected data facilitates the examination of equipment fault history using the “Relia Soft Weibull++7” software, and the resultant analysis provides a comprehensive understanding of the equipment.
The discussion references two types of analyses: Weibull Analysis and Exponential Analysis.
Weibull analysis
Weibull’s law holds considerable importance in the realm of reliability, finding widespread application in reliability calculations. Its notable flexibility renders it particularly adept for the statistical analysis of failures, allowing adaptation to diverse experimental outcomes. Governed by three parameters (η, β, and γ), Weibull’s law consistently yields accurate results across a broad spectrum of applications. This elucidates the comprehensive versatility and significance of Weibull’s law within the domain of reliability. After applying Weibull’s model, the following results have been obtained.
β: shape parameter:
γ: delay parameter:
η: scale parameter:

With A = 1.
MTBF = 1301.25 h
Graphical representation of reliability functions
This statement pertains to the graphical depiction of reliability functions on a Weibull chart. The data points are plotted with Time-Between-Failures (TBFs) on the X-axis and the approximated F (i) on the Y-axis. The resultant plot assumes the form of a curve exhibiting a negative γ, oriented to the right, as illustrated in Figure 1.

Representation of the TBFs on the Weibull paper.
Reliability function and probability analysis

With: R(t = MTBF) = 35.85%
The plotted data in Figure 2 illustrates the diminishing probability of the turbocompressor operating correctly over time. At t = MTBF (Mean Time Between Failures), the reliability value is established at 35.85%. This signifies that the turbocompressor maintains a 35.85% likelihood of operational functionality until reaching MTBF, thus categorizing it as not being in a weakened state.
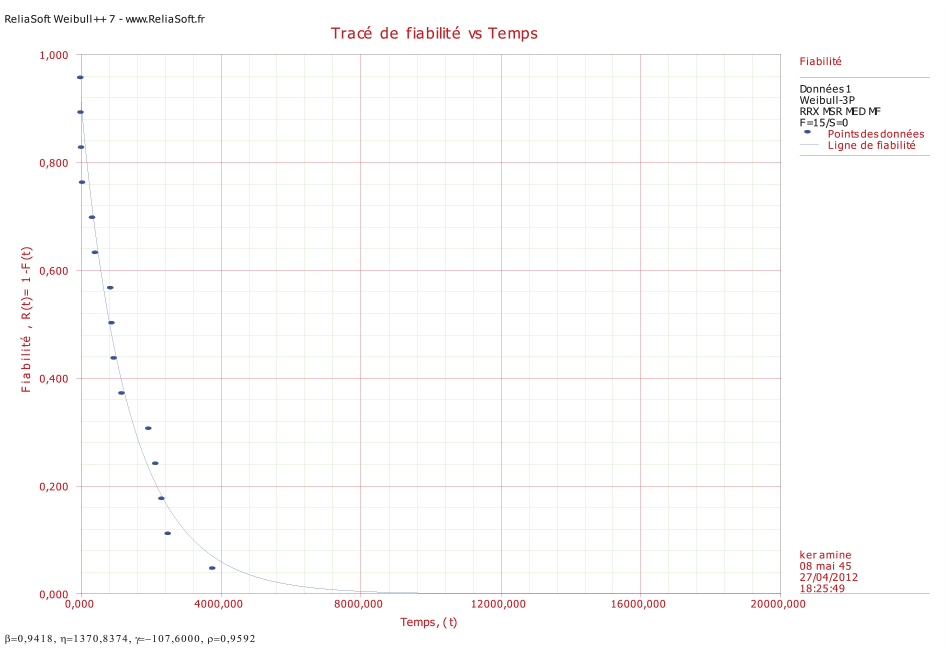
Representation of the turbocompressor probability.
Probability density of failure, expressed by the equation for f(t)

Figure 3 presents a graphical representation of the probability density of failure as a function of time (t). The plot illustrates a decreasing trend over time, indicating that failures can potentially occur before reaching the Mean Time Between Failures (MTBF) of 1301.25 h.
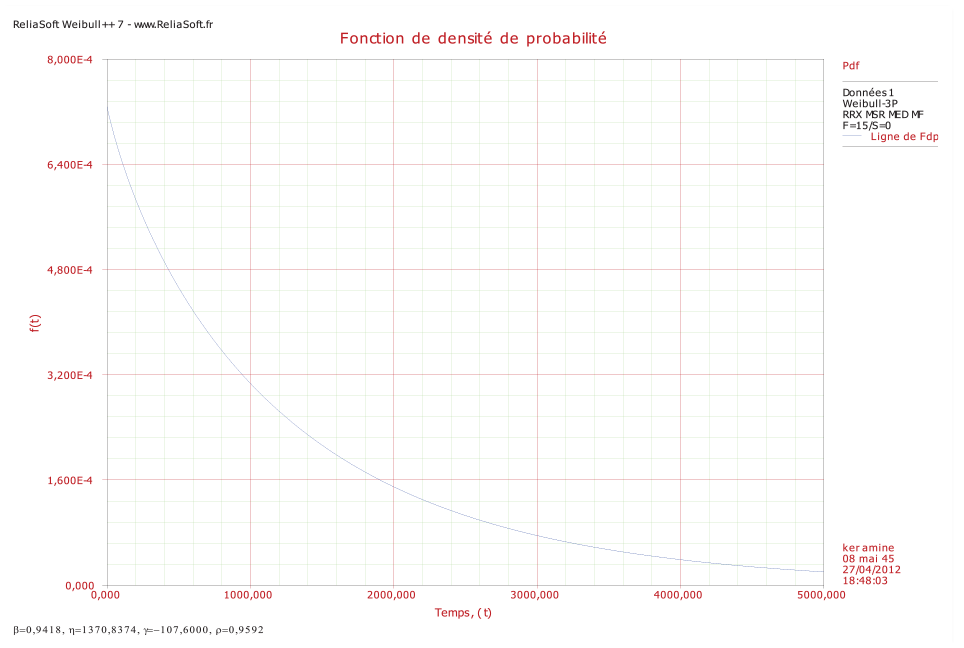
Density of probability of failure f(t).
Failure rate equation and reliability trends
The graphical representation in Figure 4 illustrates a discernible decline in reliability over time. This decrease is attributed to a diminished value of β, closely approximating one. The turbocompressor is presently in the transitional phase between its initial stages and full maturity. Consequently, a judicious maintenance policy featuring heightened monitoring is deemed necessary and will be implemented accordingly.

Failure rate λ(t).
The failure rate λ(t) is a reliability parameter of an entity (whether individual components or systems) is defined as the probability of failure of that entity during the interval [t, t + Δt], provided it has not already experienced a failure during the interval [0, t]. Mathematically, λ(t) represents the conditional probability of failure per unit time over the interval [t, t + Δt]. It can be demonstrated that the instantaneous failure rate is:

For the studied turbocompressor, the failure rate is given by:

Discussion
The result derived from R(t) reveals a decreasing trend, which is expected as the probability of optimal operation diminishes over time. The decline in reliability could stem from factors such as degradation (wear), suboptimal quality control, or inadequate maintenance. The function f(t) indicates that failures are prone to occur before reaching the Mean Time Between Failures (MTBF), suggesting an escalation in mechanical issues with the studied turbocompressor. Timely intervention is crucial to mitigate the risk of downtime.
State of the art
The company employs two distinct approaches in its vibration monitoring strategy:
Online System: The initial approach utilizes an online system, specifically Bentley Nevada, for monitoring the vibration of strategic machines such as turbo-fans and turbo-compressors.
Offline Approach: The second approach involves regular measurements of the overall vibration level and is conducted offline. Several issues have been identified:
Lack of Analysis: It appears to be a potential shortfall in the company’s comprehensive analysis of vibration data.
Inadequate Equipment: The equipment employed for the offline service, Vibrotest 60 (as depicted in Figure 11), may not be entirely suitable for monitoring large machines.
Lack of Personnel Training: The personnel may not have received sufficient training in the field of spectral analysis, encompassing interpretation and diagnosis.
Machine criticality and maintenance method selection
When selecting a maintenance method, it is imperative to consider the criticality of the machines. This ensures the optimal method chosen to uphold equipment integrity and minimize downtime.
Criteria for equipment criticality: PIEU method
Four criteria govern the determination of the maintenance method:
P (Incidence of Failure): Evaluates the frequency of equipment failures.
I (Importance of Equipment): Considers the significance of the equipment in terms of production.
E (Condition of Equipment): Assesses the state of the equipment, including factors like wear and tear.
U (Rate of Use of Equipment): Takes into account the frequency of equipment utilization, as outlined in Table 1.
Choice of maintenance politics.

The criticality index is computed using the formula:

Based on the calculated criticality value, equipment is categorized as follows:
C < 1: The equipment is deemed critical, requiring immediate attention and maintenance.
1 < C < 10: The equipment is considered moderately critical, necessitating regular monitoring and periodic maintenance.
C > 10: The equipment is categorized as ordinary or non-critical, warranting routine maintenance only.
Proposal of a maintenance strategy selection method
A maintenance strategy selection method is a systematic approach to identifying the most effective maintenance strategy for a given piece of equipment. The outlined steps in Figure 5 can guide the development of such a method.

Representation of results and proposals (KIVIAT diagram).
Different criteria influencing the risk of failure (RF)
Several factors should be taken into account to ascertain the most suitable maintenance method for each piece of equipment, considering its criticality and specific requirements. The objective is to ensure optimal equipment reliability and availability while concurrently minimizing maintenance costs. The influential criteria include:
Technological Aspect;
Calculated Lifespan;
Quality of Manufacture;
Variations of Use;
Conditions of Use;
Environmental Factors;
Feasibility of Maintenance.
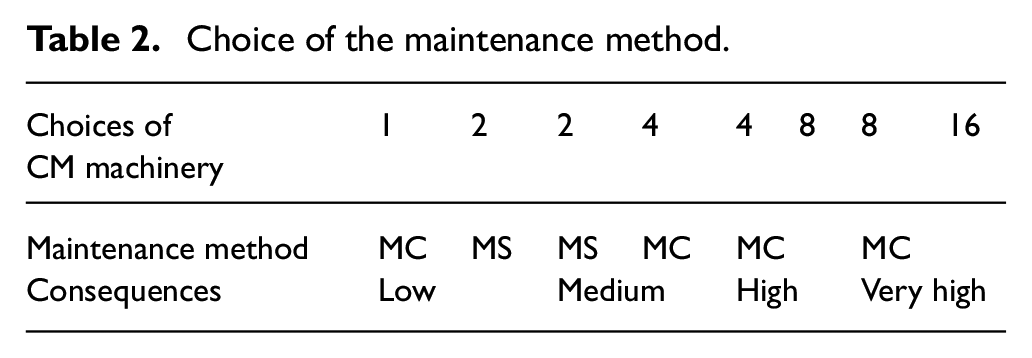
Criteria influencing the consequences of failure (CF)
Influenced by these criteria, the Maintenance Class (MC) is determined, leading to the selection of an appropriate maintenance strategy. The chosen strategy can range from preventive maintenance to predictive maintenance, contingent on the MC of the equipment. The overarching objective is to ensure the dependable operation of the equipment and to minimize the risks associated with downtime and unplanned maintenance.
The criteria encompassed in the evaluation of the consequences of failure (CF) are:
Indirect Costs on Production
Direct Costs on Materials
Security Concerns
The Maintenance Class (MC) is defined as the product of two criterion types, as delineated in Table 2:


With N: Number of Qualified Criteria.
Choice of the maintenance method.
Diagnosis of the maintenance function in the company
The questionnaire is structured into 12 sections, each comprising a set of questions. Participants are presented with five answer options for each question, each assigned a specific score. Upon completion of each section, the scores for individual questions are aggregated, as delineated in Table 3.
Proposed improvements in the park.

In the subsequent section, spectral analysis is employed as a diagnostic tool to implement conditional preventive maintenance. The primary objective is to enhance the return on investment by minimizing downtime resulting from turbocompressor shutdowns and concurrently improving its overall reliability. This application is exemplified in Table 4.
Statistical study of the industrial park.
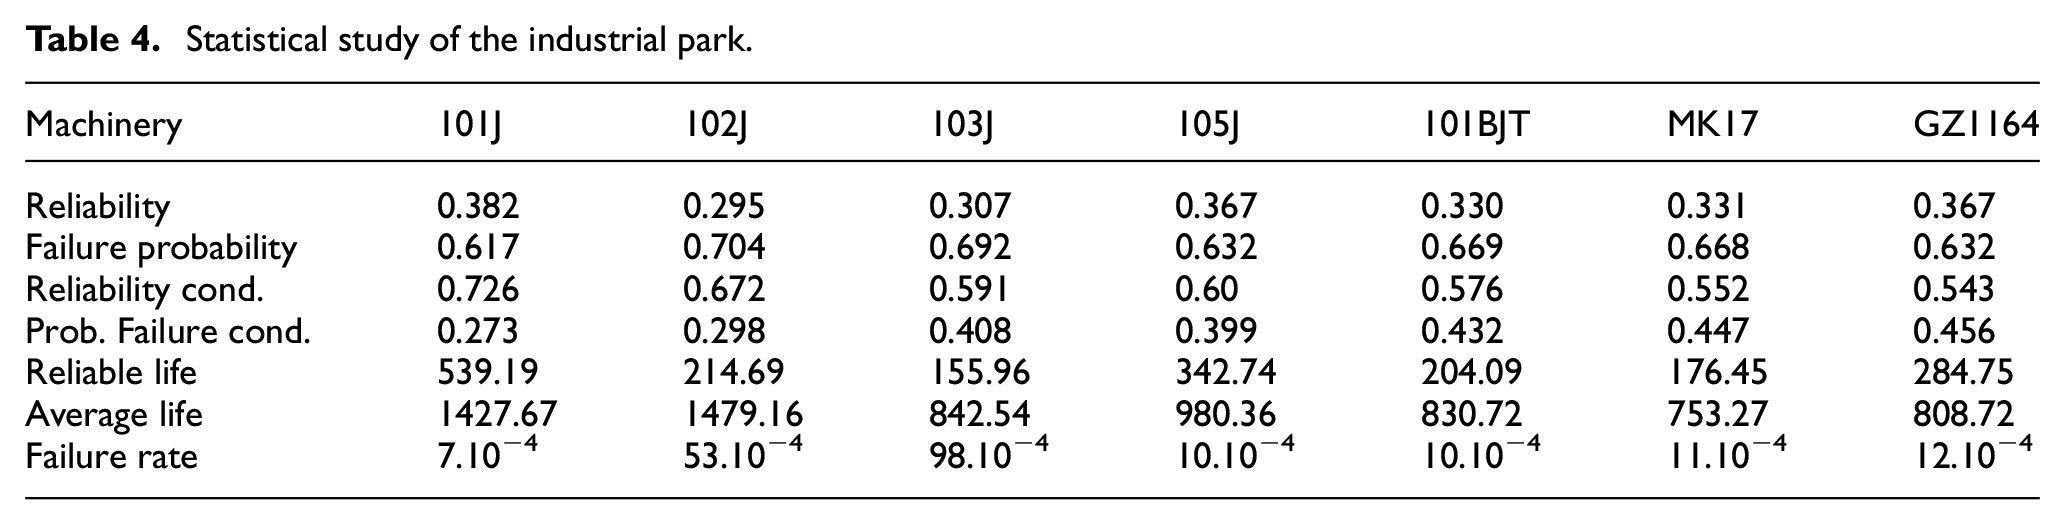
Findings based on the analysis of measurement results
Turbocompressor 103 J is subjected to monitoring through the measurement of its overall vibration levels, coupled with spectral analysis of two specific frequency bands, [0–200 Hz] and [0–1000 Hz], in terms of displacement and velocity. Notably, acceleration measurements, essential for evaluating the machine’s high-frequency condition, are absent from the assessment. The performance analysis of Turbocompressor 103 J involves measuring its overall vibration levels and conducting spectral analysis within two frequency bands, [0–200 Hz] and [0–1000 Hz], with displacement and velocity as parameters. Crucially, acceleration measurements, integral for appraising the machine’s high-frequency condition, are not presently incorporated into the evaluation. It is noteworthy that, despite the absence of vibration signal measurements by the maintenance department, signal filtering holds the potential to yield valuable insights.
Analysis of turbocompressor 103 J vibrational behavior
In this study, Turbocompressor 103 J underwent four trials within distinct frequency bands, [0–200 Hz], [0–1000 Hz], [0–5000 Hz], and [0–10 kHz], as detailed in Table 5. The current monitoring practice within the company’s maintenance department focuses on the frequency bands of [0–200 Hz] and [0–1000 Hz]. Upon scrutinizing the kinematics of the machine, it became apparent that the last two frequency bands did not yield satisfactory monitoring results. All units employ a predictive program for data collection and processing, utilizing the Schenk (VIBROTEST 60 38 ) device. 39
Measurement characteristics.

The monitoring of turbocompressors 40 is facilitated through a process control mechanism (Figure 6), enabling informed decision-making during adverse conditions. Insights into the maintenance department’s decision-making process concerning the machine’s state are presented in Figure 7.

Process of monitoring the turbocompressor 103 J.

Kinematic diagram of the turbocompressor 103 J.
Classification of turbocompressors based on operating variables (displacement, velocity, or acceleration) influences the type of rule applied, the frequency range for the analyzer, and other relevant factors. 41 Vibration analysis within the frequency range of [10–1000 Hz] is widely employed for measuring vibration rates. This parameter exhibits near independence from frequency within this range, simplifying measurement processes. Diagnostic vibration analysis in technical plants, particularly in powerful machines operating at speeds ranging from 7200 to 10,080 r/min, offers predictive maintenance benefits. 42
The commonly utilized indicators for vibration levels are peak and RMS, 43 aligning with prevailing regulations. The company employs a conventional method for diagnosing the 103J turbocompressor, as illustrated in Figure 8.

The traditional method followed by the company for the Turbocompressor 103 J.
The table with Figure 9 categorizes vibration severity into four classes: good, satisfactory, acceptable, or unacceptable. According to ISO 2372, the studied machine falls under Group 3, indicative of high-power machines (>300 kW) mounted on a rigid foundation (see Figure 9). This classification facilitates early fault detection and ongoing monitoring of their evolution. 44 Nevertheless, the reference values in the standard may not be universally suitable for older machinery or machines with installation defects.

Introduction to ISO 2372. 22
The traditional method of comparing vibration levels in turbocompressors (see Figure 7) involves scrutinizing the 24 measured speed values in three different directions (horizontal, vertical, and axial) against the values outlined in ISO 2372. 22 This point-by-point comparison determines severity based on the highest observed vibration level. However, this method has limitations as it disregards variations in vibrations across different areas, potentially leading to misdiagnosis.
Severity is associated with the point where the vibration is most pronounced based on this comparison. While this point-by-point approach acknowledges the potential influence of aging or installation problems on varying vibrations in different areas, 45 it also introduces the risk of misdiagnosis, rendering interventions ineffective.
Analysis of Turbocompressor 103 J based on overall levels
The analytical approach for Turbocompressor 103 J involves evaluating its overall levels against a reference standard. The machine’s overall levels are considered the most reliable indicator of its mechanical condition, offering insights into changes induced by vibrations. This diagnostic technique is visually represented through histograms. Measurements of the turbocompressor’s overall levels are taken at different operational stages-post-installation, intervention, or start-up. Crucially, assessing overall levels before the machine reaches a critical state is imperative, as these levels become more indicative of its operational condition. In summary, measuring the overall levels of the turbocompressor is essential for obtaining valuable insights into its mechanical well-being.
Analyzing the overall level of an aged machine that has been in operation for an extended period poses challenges, given the potential for the machine’s instability over time. Even after a comprehensive overhaul, certain normal frequencies of the machinery may persist. To mitigate this challenge, we advocate for utilizing average overall levels and conducting spectral analysis in both low and high frequencies during speed reductions or multiplications. The findings from this evaluation can significantly impact repair or intervention costs, as the turbocompressor’s state can be determined by the global vibration indicator, 11 measured within the frequency range of [Fmin–Fmax].
Before delving into a detailed spectral analysis across the four frequency bands, a preliminary analysis is conducted based on overall speed levels, both measured and calculated, utilizing the following formulas:


Bi represents the bearings of turbocompressor, Vi represents the measurement directions, Ni the number of specter lines.

N: is the total number of bearings turbocompressor.
H: Horizontal direction, V: Vertical direction, A: Axial direction
Through the computation of RMS values for both measured and calculated speeds, along with the average overall levels across all bearings within a turbocompressor, the overall levels can be established. Subsequently, these values are employed to calculate the OL in various frequency bands, visually represented in histograms (Figures 10–12). The computed average OL in each frequency band underscores their sensitivity. For instance, within the [0–200 Hz] band, the average OL is 1.3347 mm/s, escalating to 1.5377 mm/s in the [0–1000 Hz] band. Further, the [0–5000 Hz] band registers an average OL of 2.7266 mm/s, while the [0–10 kHz] band records an average OL of 2.4109 mm/s. The noteworthy doubling of the latter value signals a potential need for maintenance measures.

Histograms comparison between OL (measured, calculated, mean) [0–1000 Hz].

Histograms comparison between OL (measured, calculated, mean) [0–5000 Hz].

Histograms comparison between OL (measured, calculated, mean) [0–10 kHz].
A comparative analysis of OL unit NH3 with both measured and calculated overall OL reveals variations, accentuating the vibration levels’ sensitivity and facilitating a detailed machine condition assessment. This methodology’s advantage lies in its ability to detect issues before reaching a critical state, pre-emptively averting higher intervention costs and spare parts requirement. Additionally, it safeguards against consequential damage to other components of the machine. The in-depth insights offered by spectral analysis can elucidate the surge in average OL within turbocharger bearings, pointing to defects like rotor imbalance, oil swirling, or thermal imbalances leading to substantial oil leaks. 46 This comparative approach adds an extra layer of efficacy to turbocompressor monitoring (Figure 13).

Proposed methodology to monitor the state of the turbocompressor.
The analysis underscores that the system is operating beyond acceptable parameters, with exceptions noted for specific components in different frequency bands. This includes the low-pressure compressor LPCB 5 HD and LPCB 5 HD in the [0–200 Hz] band, the bearing LPCB 5 VD in the [0–1000 Hz] band, as well as LPCB 5 HD, LPCB 6 HD, and LPCB 6 VD in the [0–5000 Hz] band, along with low-pressure compressor LPCB 5 AD, LPCB 6 HD, and LPCB 6 VD in the [0–10 kHz] band. This outcome underscores the inadequacy of the current monitoring system employed by the company’s maintenance department.
Spectral analysis of the turbocompressor
Following a comprehensive examination of vibration levels across various components of the system, a noteworthy observation emerged: the low-pressure compressor exhibited elevated vibration levels within the frequency ranges of [0–5000 Hz] and [0–10 kHz]. Acknowledging that overall levels offer a broad overview of the machine’s condition without pinpointing specific defects, our next step involved conducting spectral analysis. This in-depth analysis aimed to discern potential bearing issues within four distinct frequency bands.
Analysis of spectra measured in displacement, velocity, and acceleration bands
In the initial spectral analysis, conducted within the [0–200 Hz] frequency range on the low-pressure compressor LPCB 6VD bearings in three directions, indications surfaced regarding oil instability and heightened friction in the compressor’s bearing shaft (refer to Figure 14).

Spectrum of the displacement of the thrust bearing 6. CB6 VD.
Subsequently, examining spectra within the [0–1000 Hz] frequency range on the low-pressure compressor bearings LPCB 5VD (a), LPCB 5AD (b), as well as LPCB 6HD (c), LPCB 6VD (d) in three directions, uncovered evidence of shaft misalignment. This was evidenced by a notable increase in the amplitude of the second and third harmonic of the rotation frequency compared to the main rotation frequency (RPM) (see Figure 15).
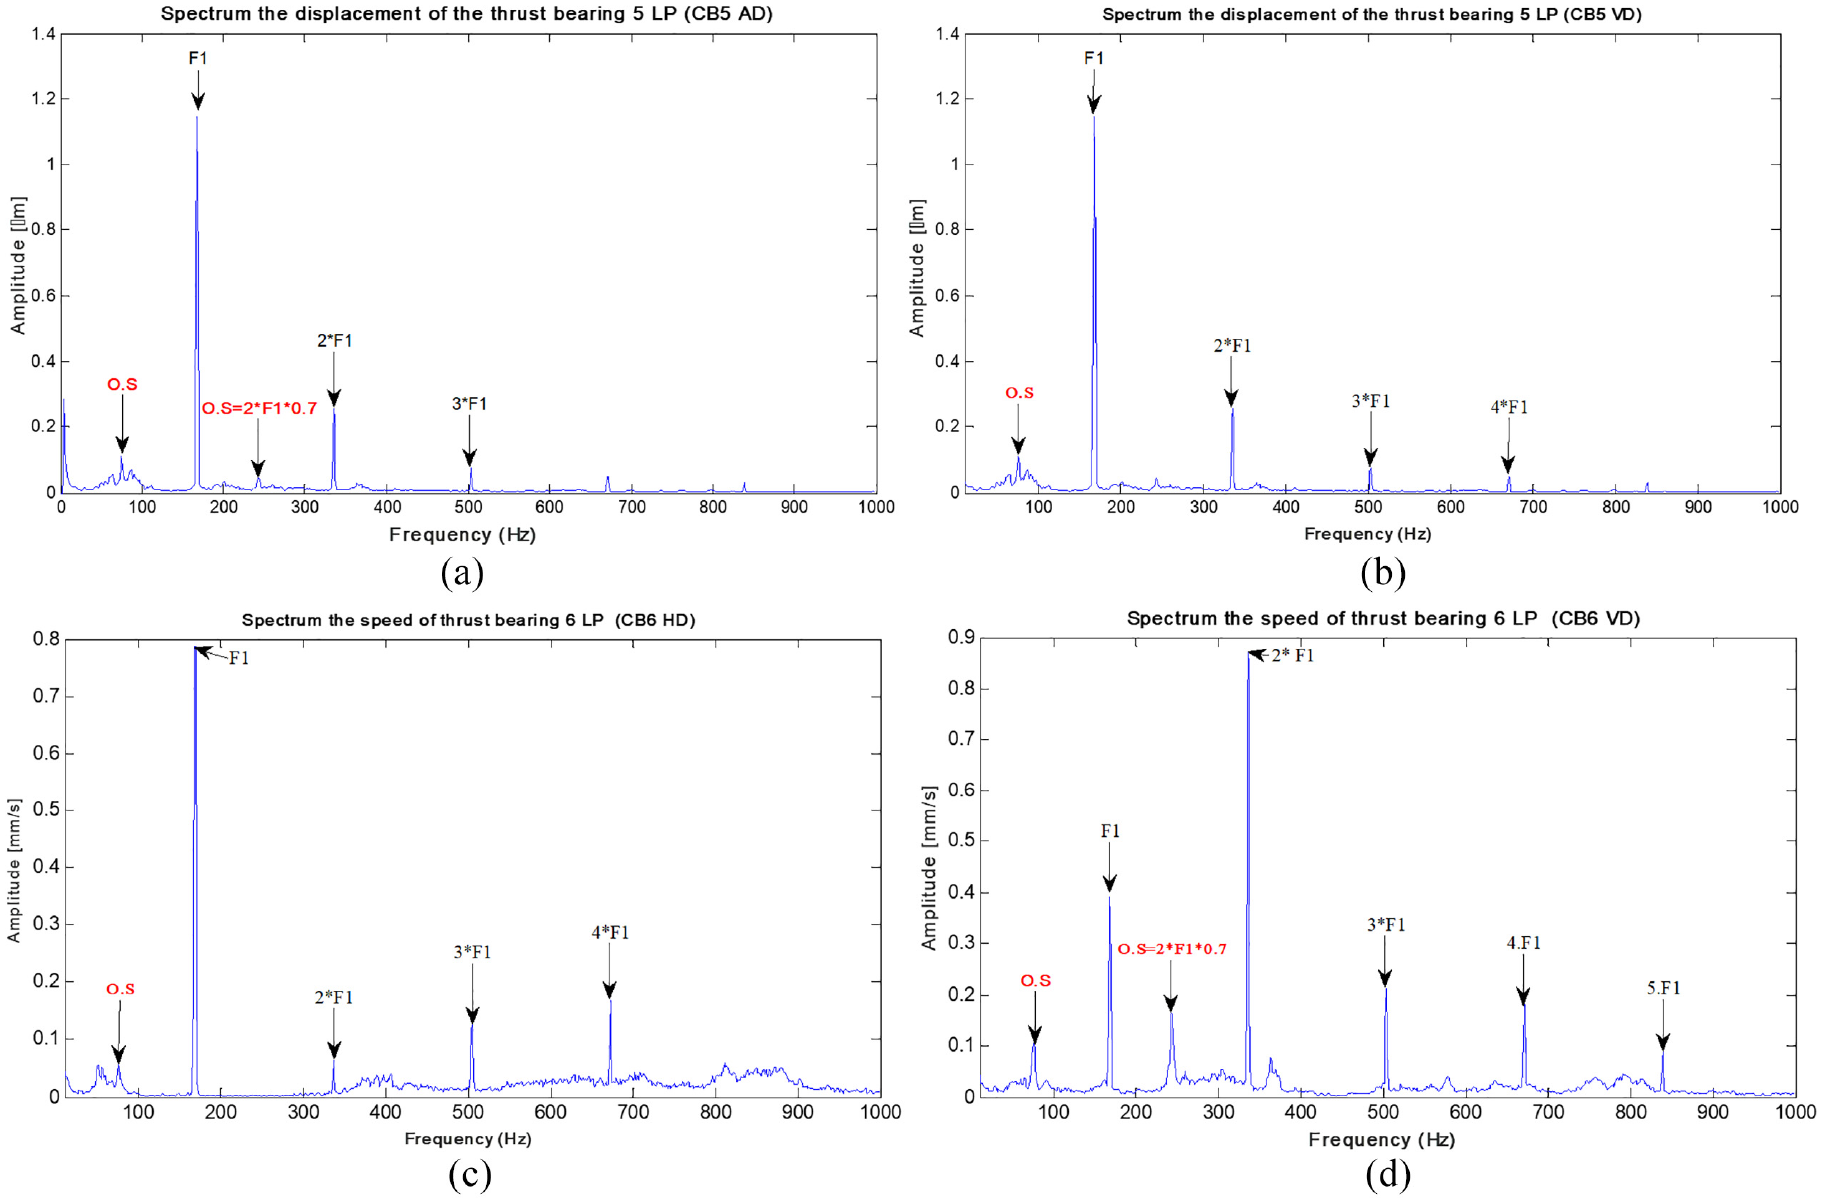
(a) Spectrum of the speed of thrust bearing 5, CB5 AD, (b) spectrum of the speed of thrust bearing 5, CB5 VD, (c) spectrum of the speed of thrust bearing 6, CB6 HD, and (d) spectrum of the speed of thrust bearing 6, CB6 VD.
Expanding the analysis to the [0–5000 Hz] frequency range revealed, in three directions, the presence of shaft misalignment in the low-pressure compressor LPCB 6VD (a), LPCB 6AD (b) levels, and the high-pressure compressor HPCB 7HD (c), HPCB 8AD (d). This was manifest in a substantial rise in the amplitude of the second, third, and fourth harmonic of the rotation frequency relative to the main rotational frequency (RPM) (see Figure 16).

(a) Spectrum of the speed of thrust bearing 6, CB6 AD, (b) spectrum of the speed of thrust bearing 6, CB6 VD, (c) spectrum of the speed of thrust bearing 7, CB7 HD, and (d) spectrum of the speed of bearing 8, CB8 AD.
Further exploration in the [0–10 kHz] frequency range on the low-pressure compressor bearings LPCB 6VD (a), LPCB 6AD (b) in three directions confirmed evidence of shaft misalignment. This was illustrated by a significant surge in the amplitude of the second, third, and fourth harmonic of the rotation frequency in relation to the main rotational frequency (RPM) (refer to Figure 17).

(a) Spectrum of the acceleration of thrust bearing 6, CB6 AD and (b) spectrum of the acceleration of thrust bearing 6, CB6 VD.
The analysis results point to spectra dominated by a robust harmonic series of the rotation frequency, substantiating considerable wear and tear in the low-pressure compressor bearing. In accordance with the typological spectrum of the defect (Figure 18), the presented phenomenon aligns with a friction defect in the journal bearing.

Typological spectrum of oil whirl defect (Brüel & Kjær Vibro).
Conclusively, the current methodology employed by the maintenance department for monitoring rotating machinery lacks reliability. As an alternative, we advocate a vibration monitoring approach based on measuring overall levels at various points and directions (horizontal, vertical, and axis) of the machine, boasting a reliability range of 40%–50%. The OL average indicator, derived from multiple scans and comparisons with reference values and ISO 2372 standards, serves to assess the machine’s overall health. A machine within the norm is considered in good working order, while a significantly higher OL value prompts a comprehensive diagnosis through spectral analysis. This advanced analysis can pinpoint rotor imbalances, oil vortex issues, thermal imbalances, etc., contributing valuable insights to the decision-making process for maintenance interventions. This approach enhances reliability, diminishes time and cost, and minimizes the need for spare parts by detecting faults before the machinery reaches a critical state.
Following the maintenance crew’s intervention, which involved dismantling Turbocompressor BP 103 J, the findings are outlined as follows:
The regulation of degradation (wear) on the rotor at the bearing holder and the pressure-side sealing ring is meticulously managed through a comprehensive revision of the turbo compressor rotor. This process involves the replacement of components such as mazes (wheels, shaft, and piston balancing), a complete set of seals (Asp/Ref), truck bearings (pads), and a full stop (external and internal).
The methodology employed in this study includes measuring overall vibration levels and comparing them with the global average in accordance with ISO 2372 standards. In instances where the analysis of vibration diagnostics identifies faults, subsequent repairs are carried out on the equipment. The effectiveness of these repairs is then validated through measurements of the overall system levels. The obtained results affirm that the system is in optimal working condition post-revision, as evidenced by the trend lines before and after the repair, illustrated in Figures 19 and 20.
The study discussed here is based on spectra that were recorded on December 1st, 2020. One year later, on February 2nd, 2021, an overhaul was performed on the turbocompressor. The overhaul confirmed significant wear in the inlet and outlet LP bearings of the turbocompressor, as confirmed by our analysis are shown in Figure 21.
The degradation of the rotor at the bearing support and the sealing ring on the pressure side was effectively addressed by overhauling the turbocharger rotor. Notably, the impeller blades and spacers at the upper section, degraded due to the pump rotor, were replaced with new components. This overhaul encompassed changes to the blades (impeller, shaft, and balancing piston), complete clearance adjustments (buffers), and a thorough stoppage of operations (both external and internal).

Trend curve of the compressor CLPB 5 HD, CLPB 5 VD.
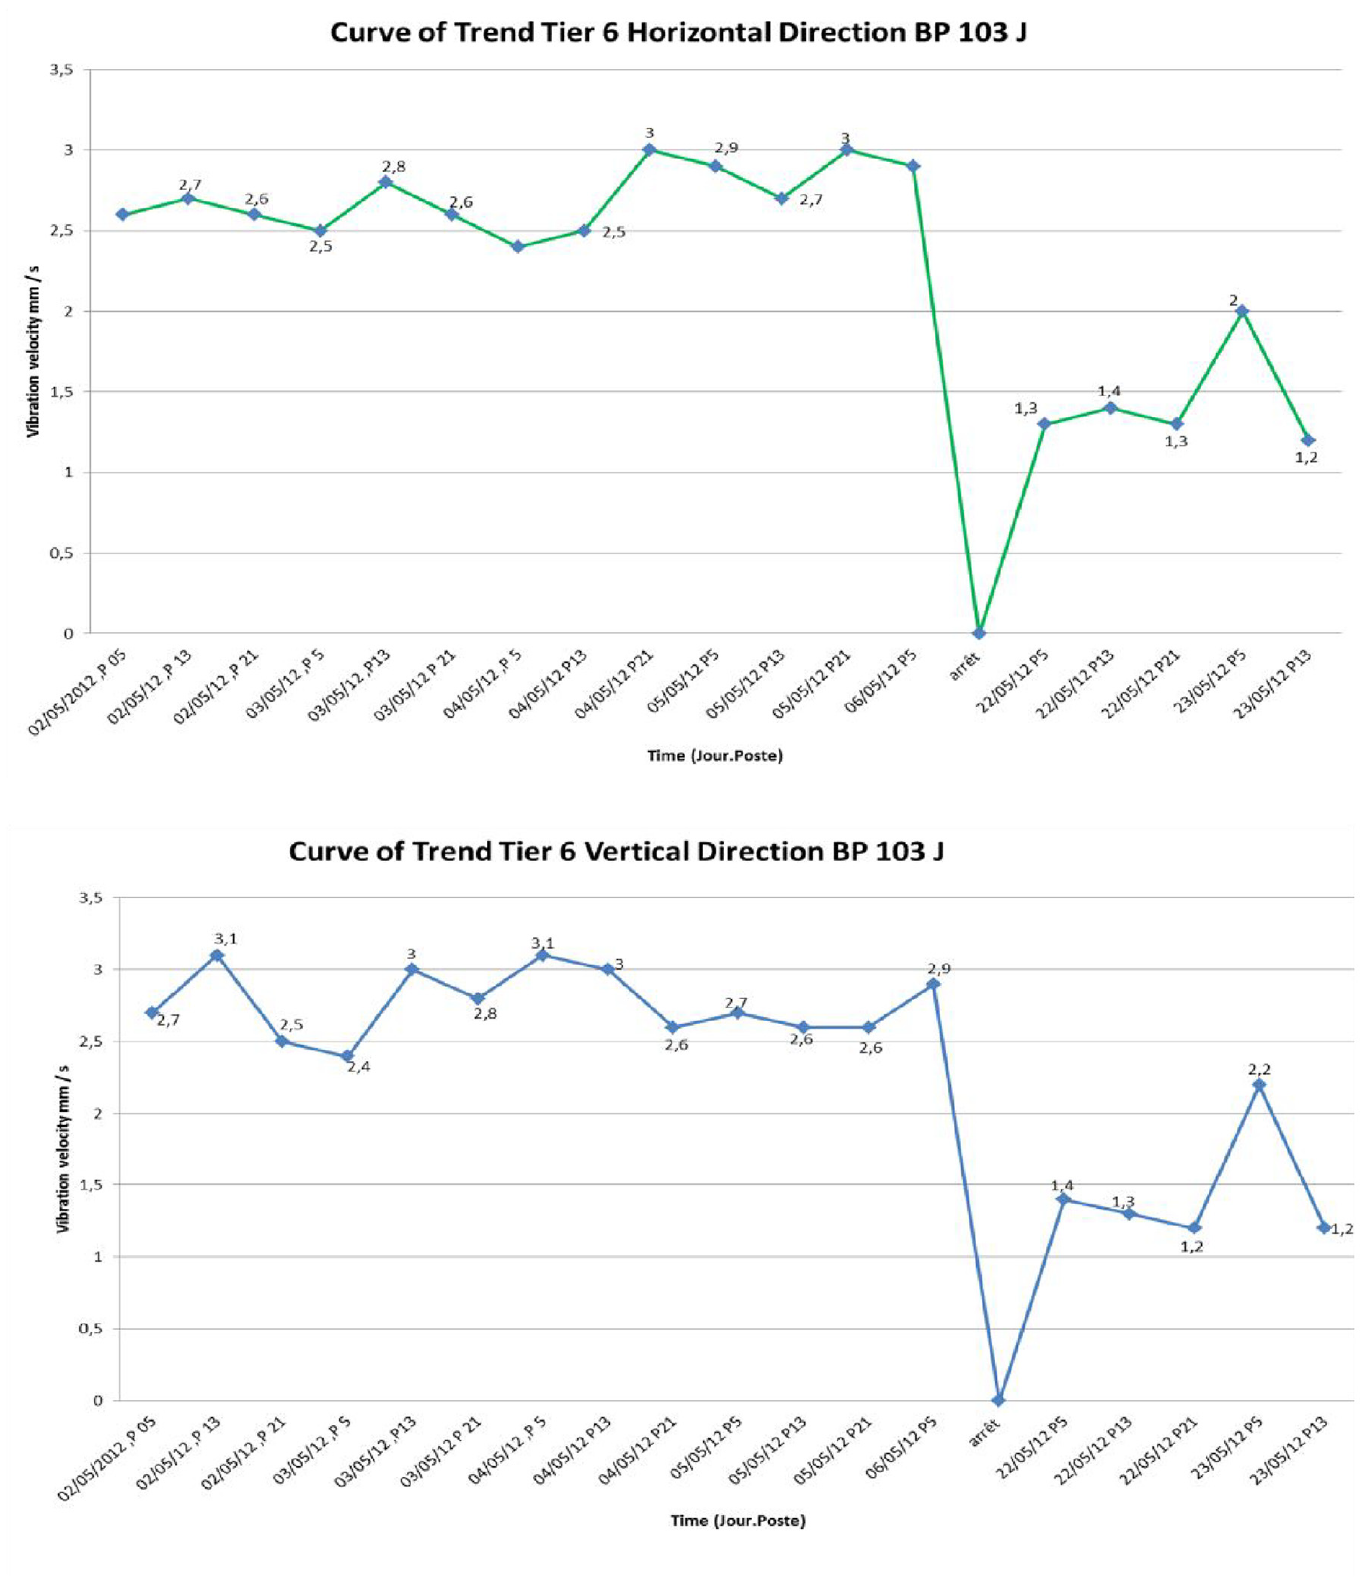
Trend curve of the compressor CLPB 6 HD, CLPB 6 VD.

Aspects of the turbocompressor failures.
Comparative analysis with recent techniques
To evaluate the effectiveness of the innovative control approach involving spectral analysis and the utilization of the new indicator OL in this study, a comparative analysis was conducted in Table 6. The analysis, based on signal processing tools and the contribution, reviews the proposed methodologies and explores their contributions to monitoring critical equipment failures, potentially extending the lifespan of the turbine equipment (BP 103). The results illustrate the effectiveness of integrating the measured values of the proposed indicator (OL) with vibration analysis, demonstrating its efficacy in detecting various faults in rotating machines at an early stage.
Comparative analysis between the proposed methodology and recent techniques.

Conclusion
The degradation of industrial machinery poses a significant threat to productivity and elevates the risk of accidents involving both physical assets and human resources. This scenario can culminate in the failure of critical equipment within a designated control system. The amalgamation of both measured and calculated OL values, coupled with the utilization of the OL average as a pivotal indicator for vibration analysis, establishes a framework for predictive maintenance. This sophisticated approach surpasses traditional maintenance methods, which predominantly rely on damage detection through measurements.
Through the synergistic application of the OL average indicator and vibration analysis, potential faults in machinery can be identified at an early stage, thereby enhancing operational efficiency and averting unplanned downtimes. This methodology takes into account various influencing factors, including environmental conditions, operational dynamics, age considerations, as well as the machinery’s speed and power parameters.
The efficacy of the proposed method has been empirically substantiated through diverse measurements, affirming its capability to delineate a balanced system based on the turbo compressor’s behavior, as evidenced by the OL values post-interventions. The dynamic implementation of these benchmarks offers a more streamlined, cost-effective approach to maintenance, mitigating the need for unwarranted interventions and concurrently elevating the efficiency and reliability of the equipment.
We can draw the following conclusions from the study:
The application of the indicator OL integrated with average values on a substantial number of vibration signals has effectively demonstrated the enhancement provided by vibration analysis.
The application conducted on the turbine (BP 103) within a validated industrial environment verifies the reliability of the proposed approach in detecting specific defects, such as wear of the turbocharger rotor at the bearing support and seal ring.
The primary contribution of the spectral analysis approach to preventive maintenance confirms its validity and suggests potential extension to identify other mechanical defects. This capability enables the detection of the nature and severity of defects, facilitating useful, efficient, and reliable interventions.
The forthcoming investigations aim to scrutinize and authenticate the acquired results by broadening the scope of the study to encompass wind turbine engines within the Green Power Monitoring System. The primary objective of this study is to enhance the monitoring of equipment condition reliability through the identification of novel health indicators pertaining to the elements of wind turbine motors. This endeavor is anticipated to contribute to the refinement of the efficacy of future condition-based and predictive maintenance practices.
Footnotes
Appendix
Acknowledgements
This research was conducted utilizing the material resources of the Laboratory of Mechanics and Structures at the University of 8 May 1945 Guelma. We extend our gratitude to the Algerian Ministry of Higher Education and Scientific Research, specifically the Delegated Ministry for Scientific Research, for their support through the PRFU project (Code: A14N01EP230220220002). Additionally, we acknowledge the invaluable assistance provided by the maintenance team of the company.
Handling Editor: Dr Sharmili Pandian
Author contributions
Tarek Kebabsa: Conceptualization, Investigation, Methodology, Supervision, Writing – Review & Editing. Mohamed Khemissi Babouri: Conceptualization, Methodology, Investigation, Writing – Review & Editing. Abderrazek Djebala: Investigation, Writing – Review & Editing. Nouredine Ouelaa: Investigation, Methodology, Writing – Review & Editing.
Declaration of conflicting interests
The author(s) declared no potential conflicts of interest with respect to the research, authorship, and/or publication of this article.
Funding
The author(s) received no financial support for the research, authorship, and/or publication of this article.
Ethics approval
The work contains no libelous or unlawful statements, does not infringe on the rights of others, or contains material or instructions that might cause harm or injury.
Consent to participate
The authors consent to participate.
Consent for publication
The authors consent to publish.
Code availability
Not applicable.
Data availability
Not applicable.