
Abstract
To investigate the effect of various factors on bearing stress response, Huber-Hencky-von Mises stress serves as a bridge, the equivalent interrelation between radial loading, axial loading, and temperature of bearing is studied using finite element method (FEM). Symbolic regression (SR) algorithm is employed to analyze simulation results, establishing a functional expression between independent and dependent variables by optimizing combinations of variables, constants, and functional forms. The results showed that within the specified force and temperature values, the curved surface of the equivalent correlation function, trained using the SR algorithm, demonstrates smoothness. Both training and validation data exhibit a strong correlation with this curved surface. Among the three factors, temperature exerts the greatest influence on bearing stress values, followed by radial loading, and axial loading components had the smallest impact.
Introduction
The design of bearing reliability for a high-speed railway transmission system necessitates consideration of key factors such as loading, temperature, vibration, and flow field. To verify whether the bearing meets the reliability design standard, stand testing of the high-speed rail transmission systems is imperative. However, effectively simulating equivalent multi-field coupling service conditions poses a challenge. The bearing stand test is an essential experiment link before the actual service of the bearing. Only through the stand test can the safety and reliability of the bearing during operation be guaranteed.
The finite element method (FEM) is extensively utilized in structural engineering strength analysis due to its convenience, practicality, and effectiveness. However, extracting key information and establishing correlation functions from limited data analysis poses a current challenge.1–7 Addressing the dynamic coupling effect of the radial force, axial force components, and bending moment of the bearing, Zhao et al. 8 proposed a prediction method for the service life of the hub bearing under multi-axis loading conditions. Hu et al. 9 introduced an energy method to solve address shock absorber lifespan concerns under different types of loading, with test results correlating with actual service mileage. Lang et al. 10 established a coupling analysis model for the thermal effect of sliding bearing and accurately determined the equivalent temperature of the bearing’s flow field.
It is necessary to obtain linear or nonlinear fitting expressions for calculation and analysis when dealing with multi-factor interaction problem of in engineering. Machine learning offers a valuable tool for deriving more accurate fitting functions from limited samples. Serving as a significant post-processing analysis method, machine learning effectively addresses the challenge of maximum likelihood estimation with small specimens and enhances generalization performance. Leveraging powerful nonlinear analysis and multivariate processing capabilities, machine learning technology has enabled the widespread application of predictive models across various fields.11–16 Liao et al. 17 utilized a genetic wavelet neural network to investigate the behavior of fatigue short crack propagation, conducting experiments at two loading frequencies. They calculated the effective short crack density and its propagation rate. The findings demonstrated the reasonable and effective nature of the genetic wavelet neural network in studying fatigue short crack evolution behavior. Zheng et al. 18 established prediction models using four machine learning algorithms, including random forest, ridge regression, and support vector regression based on radial basis kernel function and linear kernel function. These models aimed to predict the density, formation energy, band gap, and crystal volume of perovskite material datasets. The results indicated that various machine learning algorithms exhibited strong prediction capabilities for the given data samples. However, most of the current machine learning methods such as neural networks, random forests, and support vector regression models are black box models that are difficult to explain, and they only show good prediction performance in the range of data sets used for training, with poor extrapolation and interpretability. Establishing a machine learning prediction model that can be extended beyond the training data set is the current focus and difficulty. Schmidt and Lipson 19 derived the equations of motion of a simple pendulum and double pendulum by symbolic regression (SR) algorithm, and they found that even if the sin and cos terms in the initial function of the equation are removed, the final results of SR would appear Taylor expansions of sin and cos, respectively. In contrast to traditional machine learning algorithms, the SR algorithm operates under a single assumption: that there exists a functional relationship between the input and output data. Importantly, the symbolic algorithm serves as an explanatory white box model, with its output being an equation represented by variables, constants, and functions.20–22
In assessing the service reliability of transmission system bearings, numerous factors come into play. The impact of these factors on bearing stress response is investigated using a random forest algorithm, which is commonly employed to assess the importance of features in a dataset. This algorithm creates multiple decision trees by randomly selecting subsets of features from the data and integrates the results from these trees to determine the contribution of each parameter to the overall accuracy of the model.23,24 The key to accurately evaluating the service performance of bearings lies in determining whether the life of transmission system bearings under operating conditions is equivalent to that under bench test conditions. Simplifying the stand test loading scheme and equivalent multiple factors to a single factor through the equivalent method is crucial, as it provides essential technical support for the stand equivalent test and comprehensive evaluation of the transmission system bearing’s service performance.
In this paper, a multi-factor and multi-level simulation scheme was designed using an orthogonal test method. The Huber-von Mises-Hencky stress of the concerned part was used as the bridge, and a finite element calculation data set was established. The SR algorithm was then applied for data analysis and processing. This approach aimed to explore and establish the equivalent correlation function between radial and axial loading components, as well as their changes versus temperature values. The technical route of the simulation research is illustrated in Figure 1.

Research technical route.
Principle and algorithm
Loading-temperature equivalence principle
The internal contact state of the high-speed train bearing is extremely complex in the actual service process, and it is difficult to accurately grasp, which directly affects the safety of the train operation. Therefore, the thermal-mechanical coupling model of the bearing is established to analyze the change in the internal contact state of the bearing by setting different loading-temperature fields. Based on the second law of engineering thermodynamics, heat can be transferred from a high-temperature region to a low-temperature region, while a low-temperature region cannot spontaneously transfer heat to a high-temperature region. Heat transfer always occurs when there is a temperature difference. Temperature differences in objects are widespread in nature, and the heat transfer phenomenon is very common in practical life. 25 Heat transfer occurs through three primary modes: conduction, convection, and radiation, which collectively constitute all heat transfer processes. Compared with the approximate calorific value model, the Palmgren calorific value model is closer to the experimental results and has higher accuracy. Therefore, the Palmgren calorific value model is selected to calculate the heating power of the axle box bearing of the high-speed train. The equation is as follows:


where M i and M v are the friction torque caused by the external load and the viscous friction of the lubricant respectively. f1 is the load coefficient, and f1 = ¢ (Fs/Cs) £, ¢ and £ are the coefficients related to the bearing structure type, F s is the equivalent static load, C s is the basic rated static load, d m is the diameter of bearing pitch circle. For tapered roller bearings, Fβ = 0.4Fr + 0.4cosαF a , F a is the radial force, F r is the axial force, α is the contact angle. v0 is the kinematic viscosity of the lubricant, n is the bearing speed. For the entire bearing, the heat source continuously passes through the contact area. Therefore, the heat flux density can be calculated on average based on the heat generated on the surface of the contact area. The equation is as follows:


where H is the calorific value, S is the contact area, μ1 and μ2 are the Poisson’s ratio of the outer ring (inner ring) and the roller material, respectively, E1 and E2 are the Young’s modulus of the outer ring (inner ring) and the roller material respectively, l is the contact length between the roller and the outer ring (inner ring), 1/ρ∑ 1 is the comprehensive curvature radius, F is an external load. At present, the bearing convection heat transfer model is mainly Harris convection heat transfer model. 25 The heat transfer coefficient between the traditional bearing cavity and the lubricant given by the Harris convection heat transfer model is as follow:

where k is the thermal conductivity, p r is the Planck constant, u is the following velocity of lubricating oil relative to the heat exchange surface, v is the viscosity of lubricating oil, x is the characteristic length. For the inner raceway, u takes the speed of the inner ring, x takes the diameter of the inner raceway. For the outer raceway, u takes the cage speed and o takes the bearing pitch diameter.
In summary, the corresponding stress, strain, and displacement components can be obtained after applying loading or temperature to the bearing. Taking the Huber-von Mises-Hencky (HMH) stress of the concerned part as the equivalent bridge, the equivalence between radial force and axial force can be realized. The effect of the temperature field caused by the existence of grease between the roller and the rolling road inside the bearing varies with speed. The internal temperature of the bearing is set as a fixed temperature when establishing the thermo-mechanical coupling model, and the internal contact characteristics of the bearing are studied by setting different temperatures. Similarly, the HMH equivalent stress of the concerned part is used as the equivalent bridge to realize the equivalence between radial loading and temperature.
SR algorithm
Orthogonal experimental design is an effective approach for multi-factor experiments, several representative points are selected from the comprehensive test according to the orthogonality of the orthogonal table, and these points have the characteristics of uniform dispersion and neat comparability, but the data are limited and it is difficult to determine the trend of the test. The symbolic regression algorithm can establish a symbolic model for nonlinear systems without relying on prior knowledge or models, so the mathematical relationship expression between various factors can be established by using the SR algorithm.26,27
SR does not require the assumption of a specific functional form between independent variables and dependent variables and only assumes that their relationship can be expressed functionally. SR searches for the optimal solution by combining variables, constants, and various functions. 28 The essence of SR is based on gene programming technology, which is similar to Darwin’s natural selection principle. As shown in Figure 2(a), any formula can be expressed in the form of a binary tree. The structure of the SR tree includes terminal nodes and internal nodes. The terminal nodes represent constants and variables, and the internal nodes represent functional relations.

SR binary tree, crossover, and variation: (a) symbolic regression binary tree, (b) crossover, and (c) mutation.
The initial population of SR is randomly generated according to the defined function, and the individuals are screened according to their fitness. Individuals with higher fitness are more likely to be selected for the next generation, where they evolve through crossover and mutation. As shown in Figure 2(b) and (c), crossover refers to the random exchange of subtrees between the previous generation equations to generate new offspring individuals. Mutation means that one or more nodes in the equation are randomly adjusted to ensure population diversity to explore better data-fitting equations. Fitness evaluation, selection, crossover, and mutation occur in each generation to generate new individuals. In this continuous iterative process, the complexity of the equation increases with the number of iterations. Concurrently, the mean squared error (MSE) gradually decreases. However, the score improvement will gradually diminish, become more variable and lead to instability after a certain complexity level. The equation may also exhibit singular terms. Therefore, the criterion for terminating the algorithm is when the MSE is less than a certain value, the score improvement is stable, and the equation does not exhibit singular terms. By setting the individual complexity and function’s form to control the iterative solution process, the higher the complexity means the more complex the solution function. The function form setting can be set by referring to the function contained in the prior formula, and can also be set artificially.29,30
Abaqus 2020 commercial finite element analysis software was used for the simulation test, simulation result data and a data set were collected. Randomly select 80% of the data in the data set, use the SR algorithm for training, randomly generate the first generation of individuals, and then use the remaining 20% of the data in the data set as the test set to test the accuracy of the training model. The training model is reasonably evaluated by setting the complexity of the correlation function and judging the MSE value.
To facilitate the practical application of engineering, we defined the function involved in the result expression in the early stage, that is, addition, subtraction, multiplication, and division in this study. The complexity of the model was set to 20. Individuals with higher fitness can generate new individuals through cross-mutation, and then evaluate their fitness. The number of cycles was equal to 1500. After completing the cycle, the equation with the highest fitness was finally output as the correlation function, the SR algorithm process is shown in Figure 3. The characteristic variables are input, the input variables are random combinations of radial and axial force or temperature, and the output variables are the maximum stress value at a certain point or structure.

SR flow chart.
Numerical process
Finite element model
The tapered roller bearing is a widely used type of bearing in various mechanical equipment. It is known for its strong bearing capacity, high-temperature resistance, and high rotation accuracy. According to the size of the CRH380 axle box bearing provided by Luozhou LYC Co. Ltd., the main geometric parameters of the bearing are shown in Table 1. The three-dimensional model and finite element model were established by commercial software, as shown in Figure 4. Figure 4(a) is the geometric model of axle box bearing, and Figure 4(b) is the finite element model of axle box bearing. The material properties of each part of the finite element model are shown in Table 2. The material of the inner ring and outer ring is G20CrNi2MoA, and the material of the roller is GCr15. To ensure efficiency and accuracy in calculating the HMH stress values under varying operational conditions, a sub-model was used in the numerical process. In the finite element modeling, the outer surface of the outer ring of the bearing was fixed, the inner ring end face was axially constrained. The circumferential motion of all rollers is constrained, the bearing force of different types of loading ARE applied to the inner surface of the bearing inner ring. The temperature boundary is applied to the roller surface and the raceway, and the convective heat transfer coefficient is applied to the remaining surface.
Main geometric parameters of axle box bearings.


CRH380 axle box bearing schematic diagram: (a) geometric model, (b) finite element model, (c) bearing sub-model, and (d) focus position.
Finite element model material information.

Considering the characteristics of the finite element model of tapered roller bearing and the configuration of the computer, the inner and outer rings were divided by the Hex dominant method, and the global mesh size was defined as 1.2 mm. The roller is meshed by Multizone, and the global mesh size is defined as 1.0 mm. The unit type is C3D8R three-dimensional linear hexahedral unit. Most of the numerical models are hexahedral meshes, and also contain a small number of tetrahedral meshes. The order of the finite element is second-order and quadratic. The final bearing finite element model consists of 896,752 mesh elements and 942,815 mesh nodes. Because the maximum stress position on the same contact line can change under different working conditions, two situations are distinguished in data processing, namely: (1) The maximum stress on the contact line. (2) The stress of a fixed point on the contact line, as shown in Figure 4(c) and (d). For the convenience of analysis, each contact line position was named A/B/C/D, and the arrow direction in the figure was the load loading direction. The fixed point is the maximum stress position on the contact line under only radial loading. After the fixed point is determined, the stress value of the fixed point and the maximum value of the equivalent stress on the contact line are extracted for analysis when the radial loading-axial loading-temperature factors are equivalent.
In the process of bearing temperature field analysis, it is necessary to define the appropriate contact mode. 31 Otherwise, it is difficult to accurately reflect the internal temperature characteristics. According to the actual working conditions of the bearing, two sets of contact pairs need to be set up, which are the contact pairs between the roller surface the outer ring raceway and the inner ring raceway. In the roller-outer ring contact pair, the outer ring raceway is selected as the target surface, and the conical surface of the roller is selected as the contact surface. In the roller-inner ring contact pair, the inner ring raceway is selected as the target surface, and the conical surface of the roller is selected as the contact surface. The contact types are all non-separating contacts, and the contact algorithm uses the augmented Lagrangian algorithm. The contact area settings are shown in Table 3.
Finite element model contact attribute information.

Working condition setting
The orthogonal experimental design method was adopted by many researchers because of its high efficiency, rapidity, economy, and statistical background.32–34 In the design process of the simulation scheme, the influence of axial, radial loading components and temperature on the HMH stress of each contact line position inside the bearing is focused on.
The orthogonal experiment method selects some representative points from the comprehensive experiment according to the orthogonality, which has the characteristics of uniform dispersion, neat, and comparable, and is an efficient and rapid test method. When considering the equivalence of radial and axial force components or the equivalence of radial loading and temperature, the traditional orthogonal method was used to set the working conditions, and 25 working conditions can be set. When considering the three-factor five-level design, 25 working conditions can be obtained by using the DOE design method, as shown in Table 4. Factors 1–3 in the table represent radial load (30/40/50/60/70 kN), axial load (−15/−10/0/10/15 kN), and temperature (40°/60°/80°/100°/120°) respectively, and 1–5 represent five different levels.35–37
Orthogonal design scheme.

Results and discussion
Radial loading-axial loading equivalence
The traditional test bench for axial loading-radial loading dynamic actuators is complex and expensive. Establishing a reasonably designed test bench with limited funds is a challenge. Understanding the equivalent relationship between radial loading and axial loading is crucial for establishing a simplified single-bearing test bench.
To facilitate comparison, the complexity and MSE value of all the training models obtained by the SR algorithm are placed in Table 5. The subscripts FP and MP in the table represent fixed points and maximum points, respectively. 80% of the training data and 20% of the verification data were drawn in the correlation function surface map. The drawing results are shown in Figure 5, where (a)–(h) are the A/B/C/D data of the contact line, Figure 5(a) to (d) is the stress of the fixed point on the contact line, and Figure 5(e) to (h) is the maximum stress on the contact line.
Correlation function complexity and mean square error value.


Radial-axial loading equivalent correlation function surface: (a–d) corresponding to fixed point results and (e–h) corresponding to maximum point results.
The stress value in Figure 5(f) is observed to be 600 MPa, significantly lower than the stress value in Figure 5(g) (1000 MPa). These positions correspond to the contact lines of the roller with the outer and inner rings, respectively, with identical mechanical parameters. The difference in stress values is attributed to the roller’s force. As per the contact line diagram in Figure 4(d), the tapered roller experiences three contact forces from the inner and outer raceways and the guiding large rib, that is, the roller-ring raceway and the roller-inner ring rib load. During actual service, the maximum force occurs at the roller-inner ring contact point, so the observed results can be explained. All the equivalent correlation function surface obtained by the SR algorithm was smooth, and the training data and verification data scatters had a good correlation with the correlation function surface in Figure 5. With the increase in value of axial loading, the stress value of the fixed position of each contact line does not change significantly, and the maximum value of each contact line increases approximately linearly. The roller shape of the axle box bearing is conical. After the axial loading is added, the roller slides slightly in the axial direction, resulting in a linear gradient change of the stress value.
After obtaining the correlation function between the radial and axial loading components, the axial force equivalent to the radial one using the stress value as the intermediary. This is achieved by maintaining the Γ value before and after the equivalent, with modifications made to either the x or y value. The modifications serve the purpose of achieving the equivalent loading. The engineer only needs to clarify the magnitude of the radial and axial force, and then substitute it into equations (8)–(15) to obtain the stress value of the concern point. If the axial force is expected to be equivalent to the radial force, only the axial one (y value) is regarded as 0, the Γ value is unchanged, and the x value is adjusted to be equivalent.
The expression of the correlation function trained by the SR algorithm is shown in equations (8)–(15), where Γ is the contact line stress value (MPa), x and y represent the radial force (kN) and the axial force (kN), respectively. The MSE values of BMP and CMP in Table 5 were larger than other points. The reason is that the stress value on the B contact line and the C contact line corresponding to the maximum point is larger than the stress value of the contact line in other working conditions. The stress values on the B contact line and the C contact line are 600 and 1000 MPa, respectively. The MSE value in this paper is defined by the mean square sum of the error between the simulation value and the training value. Taking the CMP value as an example, CMP = 822.649, the average error between the simulation results at the maximum point of contact line C position and the training results of the SR algorithm is √822.649 = 28.682 MPa, which is only 2.868% of the maximum stress value of contact line (the maximum stress value of contact line is 1000 MPa), and the error range is acceptable in engineering practice. Therefore, the mathematical relationship fitted by the SR algorithm can approximately describe the equivalent relationship between the radial loading and the axial loading. After the single stand test of the bearing is calibrated, the above expression can be used to equivalent the radial loading-axial loading.
Contact line AFP:

Contact line BFP:

Contact line CFP:

Contact line DFP:
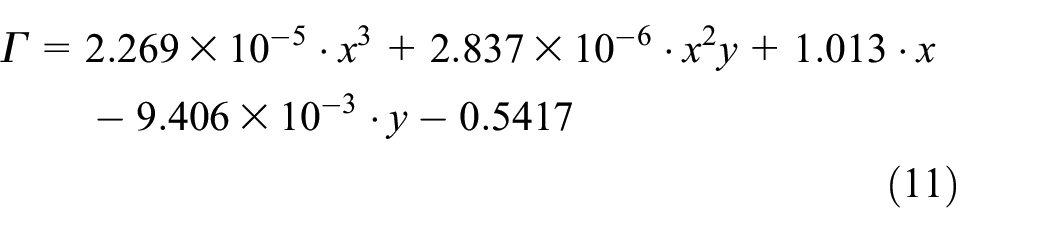
Contact line AMP:

Contact line BMP:

Contact line CMP:
Contact line DMP:

Radial loading-temperature equivalence
To simulate the temperature rise effect, the environmental box needs to be set up when establishing a single bench test bench. If the influence of temperature on the contact line stress inside the bearing can be equivalent to the radial force, it can be much easier to design a single-bearing bench. Considering that the internal temperature of the bearing fluctuates significantly at different speeds, the nonlinear influence of the internal temperature rise of the bearing is not considered when establishing the thermal-mechanical coupling model. The internal temperature of the bearing is set as a fixed value, and the influence of nonlinear temperature rise is considered in the later research. The existence of internal defects in the bearing makes the stress value near the contact line position rise sharply. In this study, the abnormal temperature rise caused by the damage to the inner ring raceway, outer ring raceway, or roller is not considered.
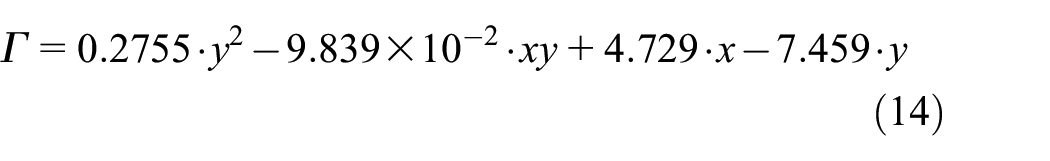
The contact stress corresponding to each contact line is different under different damage degrees in the bearing. Therefore, the temperature range is set to 40°C–120°C in this study. In the later stage, the change of the stress value of each contact line under different damage degrees in the bearing under higher temperature conditions can be studied. Based on the above assumptions, a total of 25 groups of radial loading-temperature conditions were set up. Using the method described in Section “Finite element model,” when the radial loading-temperature is equivalent, the complexity and MSE value of the training model can be obtained by the SR algorithm. The model expression obtained by training is shown in equations (16)–(23), and the surface fitting effect and verification results of the equivalent correlation function are shown in Figure 6. In the formula, Γ is the contact line stress value (MPa), and x and z represent the radial force (kN) and temperature (°C) respectively.

Radial loading-temperature equivalent correlation function surface: (a–d) corresponding to fixed point results and (e–h) corresponding to maximum point results.
The results in Figure 6(a) to (d) depicted the radial loading-temperature HMH stress outcomes at a fixed position along the contact line. The HMH equivalent stress values range around 400 MPa, while the values can reach 2000 MPa at the maximum point. Compared to the axial loading (the HMH equivalent stress values can reach 1000 MPa), temperature exerts a greater influence on the HMH stress values at the maximum point position. This may be because the temperature change will lead to a change in the length or volume of the material, thus causing the change in stress. 38 High temperatures causing the material’s internal structure to loosen and grains to grow, which reduces strength and hardness. Additionally, higher temperatures make the material more susceptible to deformation, thus enhancing its toughness and plasticity. 39 The red scatter points in Figure 6(e) to (h) represent the HMH equivalent stress values under specific working conditions. Due to the complexity of dynamic simulation modeling of geometric shape, motion, and lubricant characteristics of rolling elements in bearings, this study does not consider the dynamic changes of boundary conditions and the influence of lubrication methods, which is also the focus of future research.40,41
The surface of each equivalent correlation function was smooth in Figure 6, the scatter points of training data and verification data had a good correlation with the surface of the correlation function, and the surface of the equivalent correlation function was non-uniform and gentle. It is mentioned in the thermodynamic theory that high-temperature conditions can affect the thermal expansion coefficient of the material, causing the volume change of the roller, and the stress value can change accordingly. Compared with the radial force-axial force equivalence results, the MSE value of the radial force-temperature equivalent correlation function was on the rise as a whole, and it can be inferred that the temperature has a more significant effect on the contact line stress value.
Contact line AFP:

Contact line BFP:

Contact line CFP:

Contact line DFP:

Contact line AMP:
Contact line BMP:

Contact line CMP:

Contact line DMP:

Radial loading-axial loading-temperature equivalence
In the analysis of multi-index orthogonal simulation results, intuitive analysis and variance analysis are generally used. The intuitive analysis method is simple and easy to understand, and the variance analysis method has high accuracy. Combining the advantages of the two methods, the simulation results were analyzed to distinguish the primary and secondary factors.42,43 The intuitive analysis method is used for analysis in this study.
Among the three factors, the temperature had a great influence on the experimental results, and the primary and secondary relationship of the other two factors needs to be determined by combining range analysis.44–46 The results of the range analysis are shown in Table 6. To facilitate analysis, the range data in the table retains 0 valid digits. At position C or D, whether it was a fixed point or a maximum point, the primary and secondary relationships of the influencing factors were temperature, axial, and radial force components. At position A and B, there was no uniform law between the primary and secondary factors affecting the fixed point and the maximum point. Although the axial force in the primary and secondary relationship of the influencing factors was before the radial force, the range level of the radial and axial types of loading in the table was approximately at the same level.
Range analysis results and Đ value calculation results.
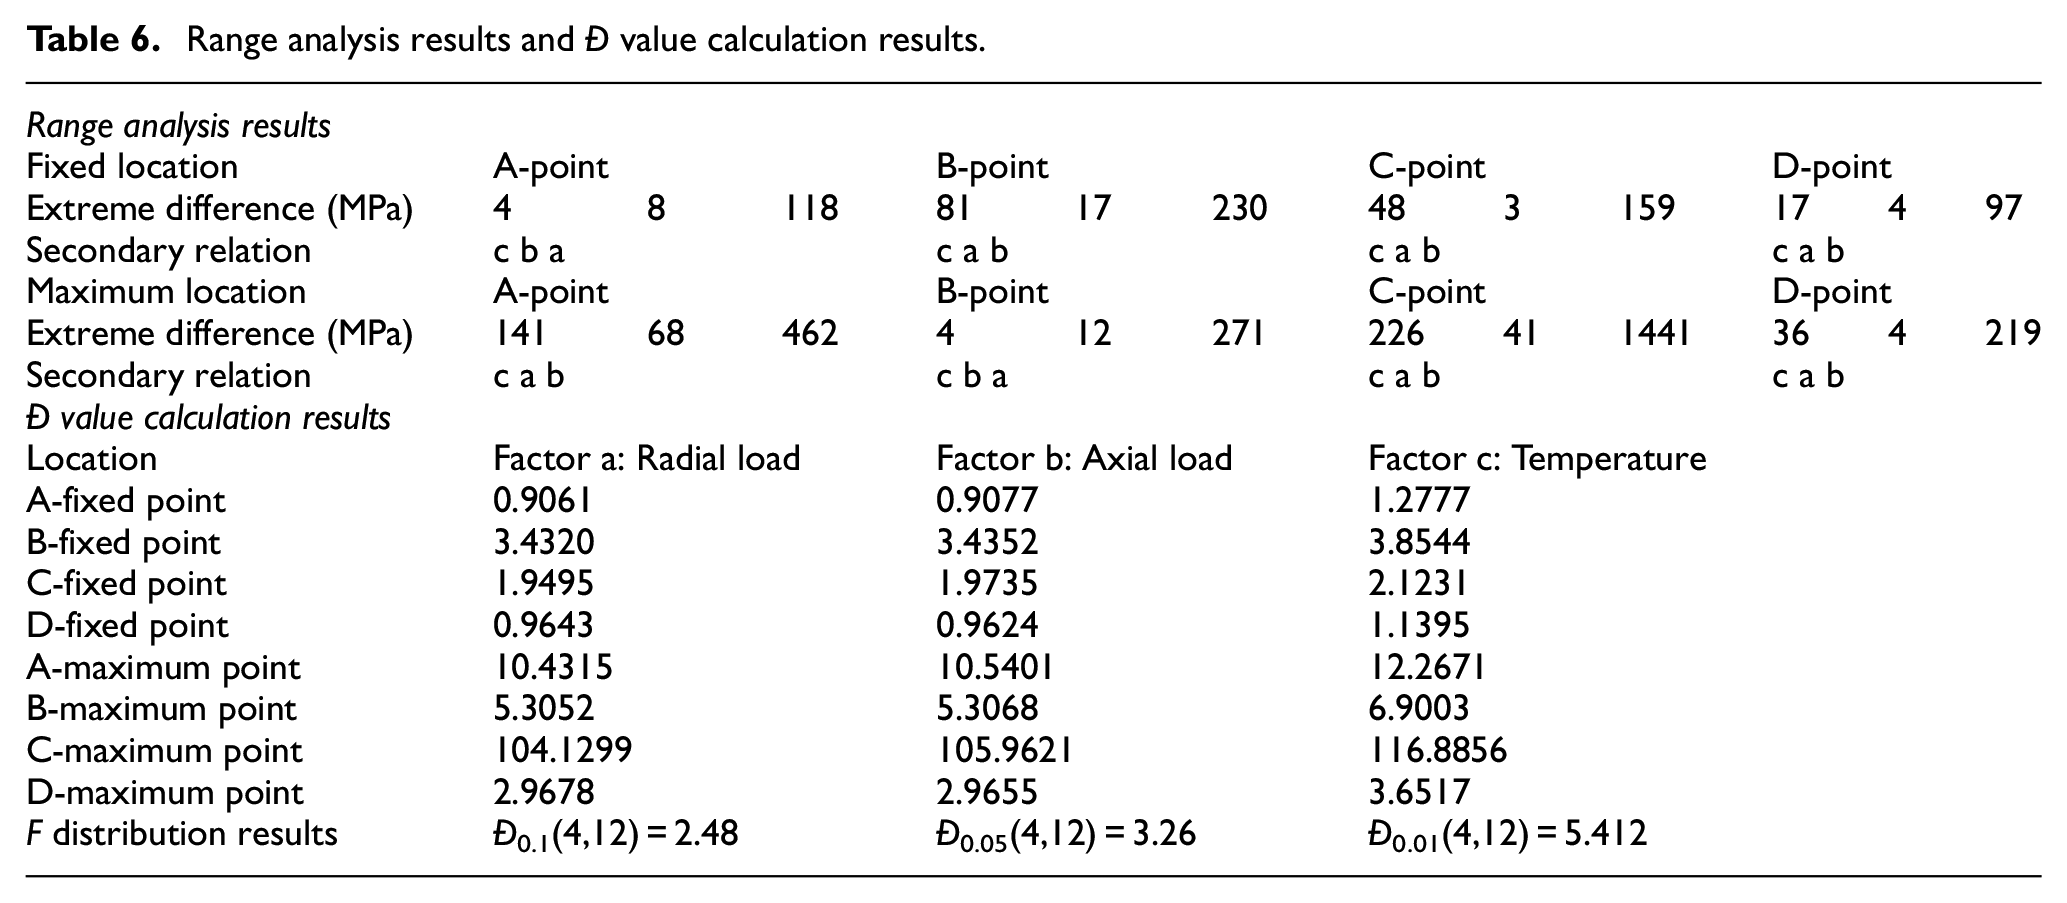
Taking the factor level as the abscissa and the average deviation of the simulation result as the ordinate, the trend diagram of each working condition factor index is drawn. As shown in Figure 7(a) and (b), the trend diagram of each contact line position factor and index was drawn. The abscissa a1–a5, b1–b5, and c1–c5 in the diagram represent the five horizontal values of radial force, axial force, and temperature respectively. To accurately estimate the importance of the influence of each factor on the simulation results, the above data were analyzed by variance analysis. In F statistics, the value of Đ is defined as the ratio of inter-group fluctuation to intra-group fluctuation. The value obtained from F statistics was compared with the probability graph obtained from the degrees of freedom of factors and random errors, and the influence degree of each factor was obtained.
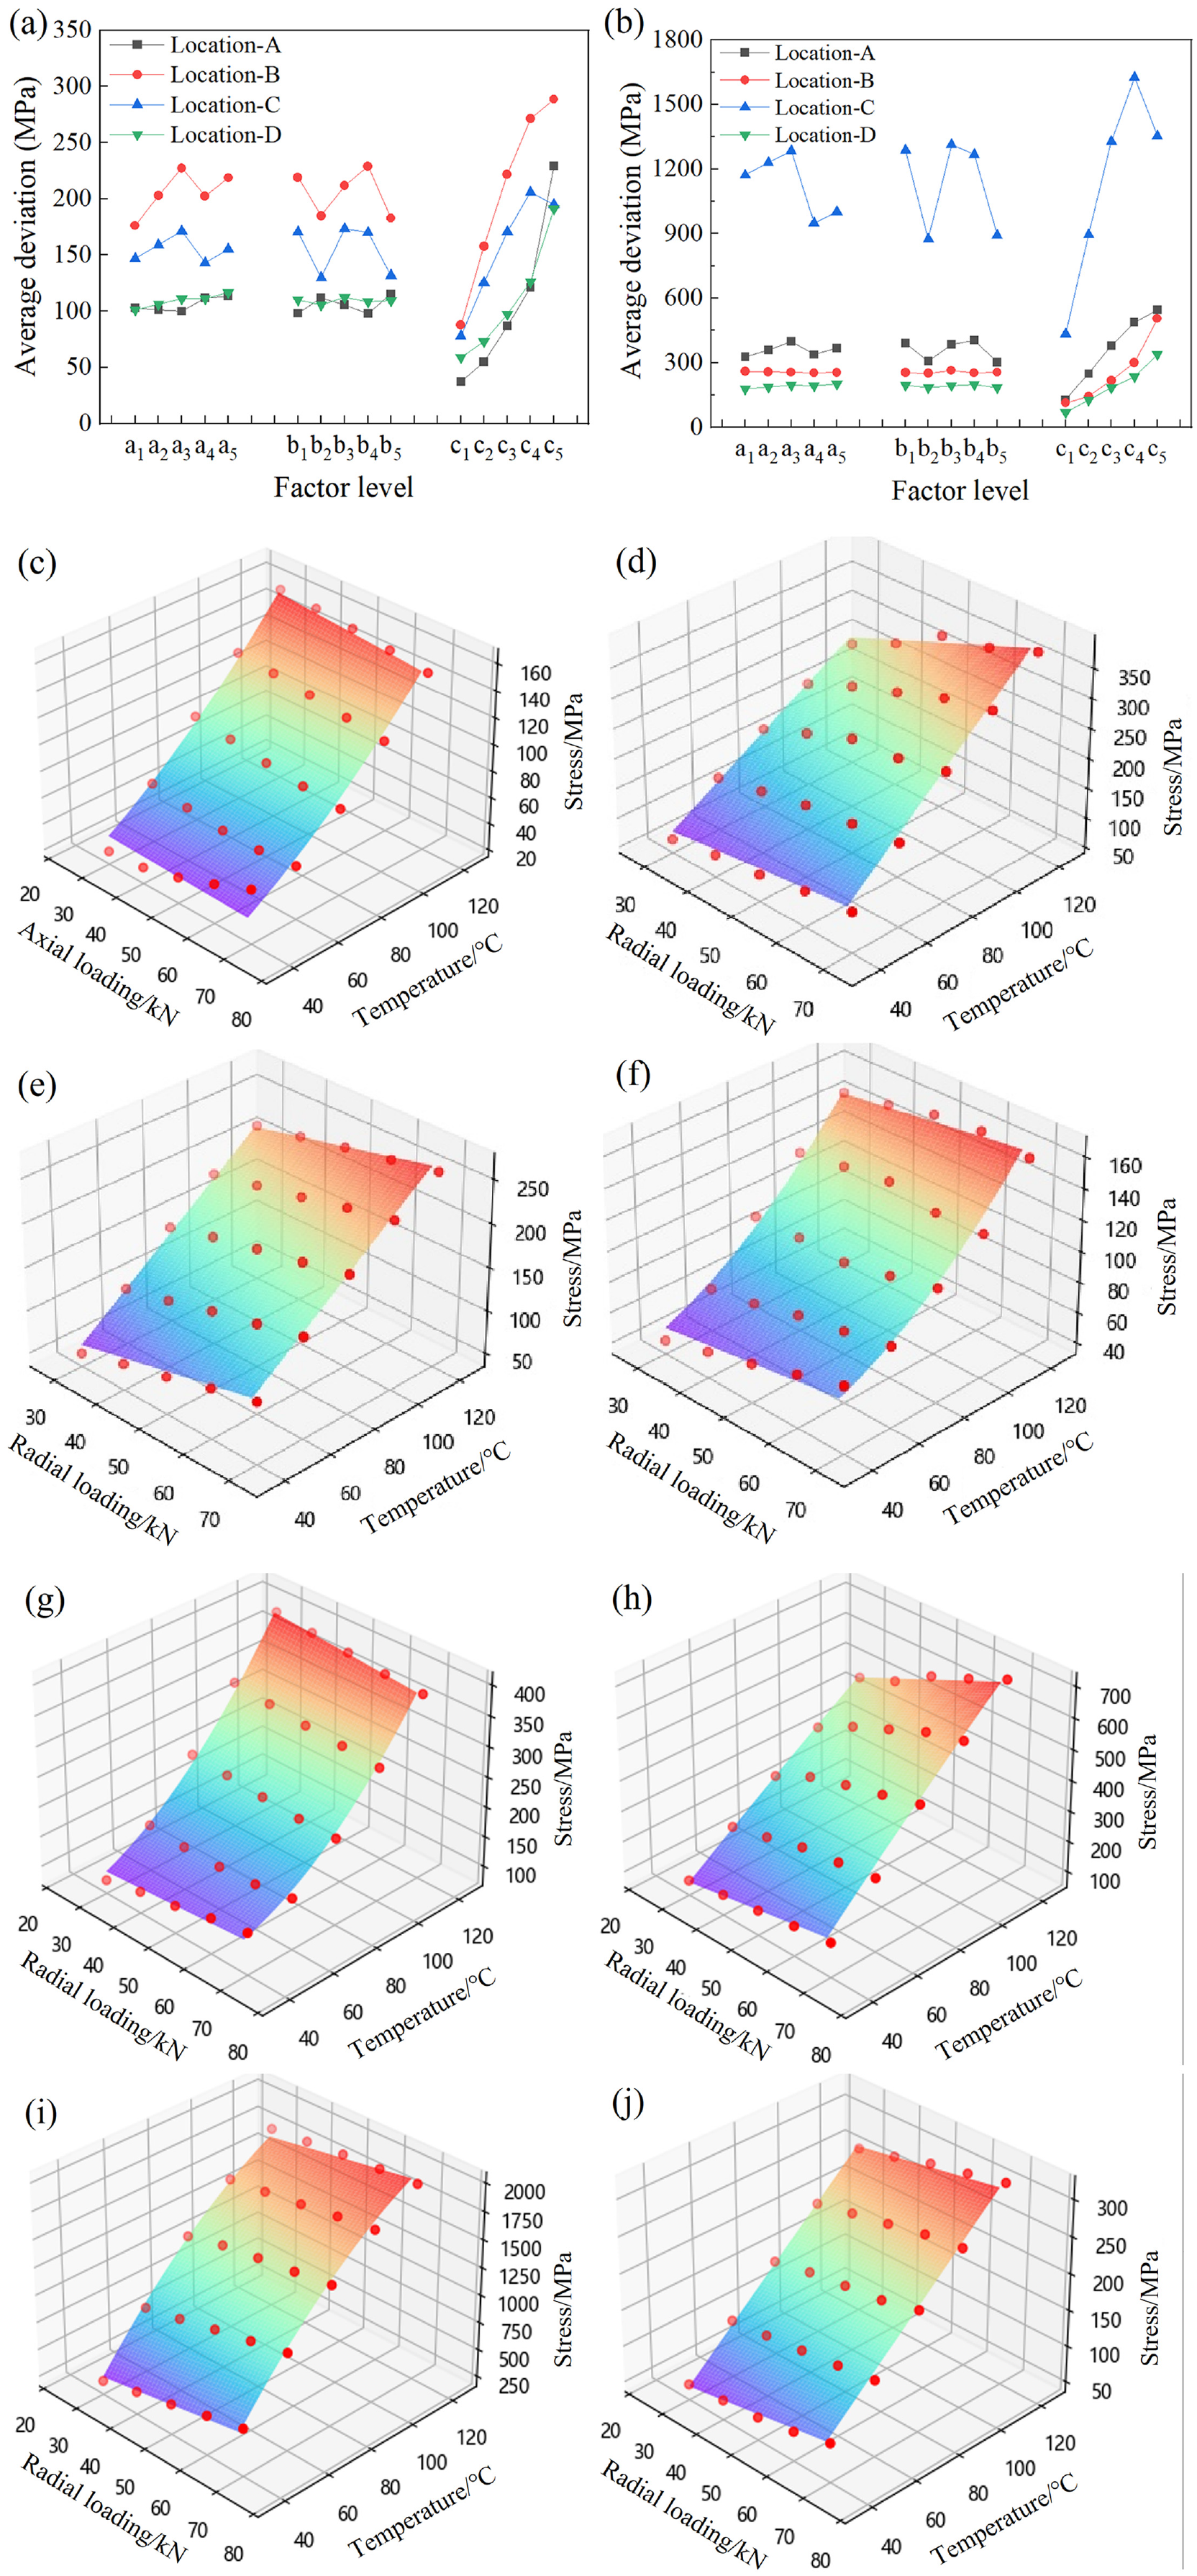
Equivalent results: (a) and (b) is the factor and indicator trend chart and (c–j) is the radial loading-axial loadingtemperature equivalent correlation function surface.
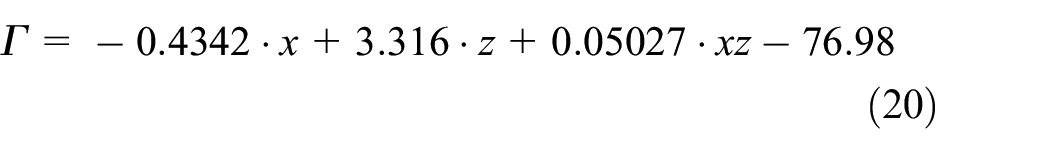
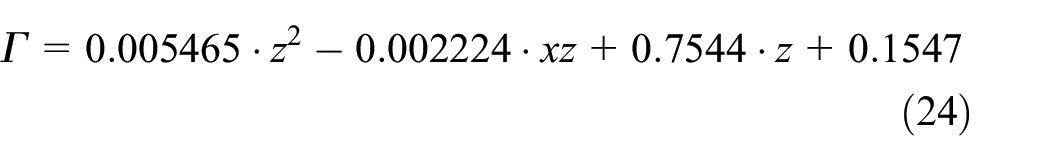
The calculated Đ value is listed in Table 6, and the F distribution table is consulted for the significance test. From the data in Table 6, it can be seen that because Đ0.01(4,12) = 5.412 was greater than the Đ value of the fixed point, the significance of the factors a, b, and c cannot be distinguished by the data. The SR algorithm is used to evaluate and screen the main influencing characteristics in combination with the random forest model. It is found that the axial force was not sensitive to the stress result. Therefore, the radial force-temperature-stress value data was used to draw the correlation surface. When the radial force-temperature is equivalent, the complexity and MSE value of the training model can be obtained by the SR algorithm. As shown in Figure 7(c) to (f), the training data and verification data were all in the radial force-axial force-temperature equivalent correlation function surface, and the fitting effect was good. The correlation functions corresponding to each position are shown in equations (20)–(23). In the formula, Γ is the contact line stress value (MPa), x is the radial force (kN), and z is the temperature (°C).
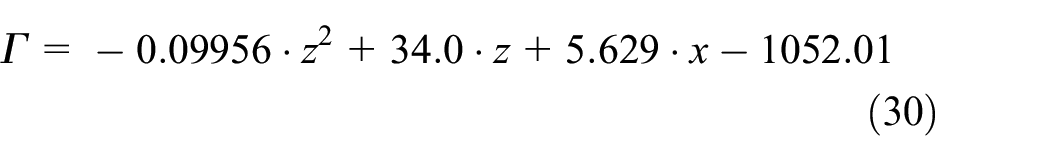
Combined with the analysis of the maximum data in Table 6, for the A-maximum point, due to Đ0.01(4,12) = 5.412 < ĐA = 10.432, Đ0.01(4,12) = 5.412 < ĐB = 10.54, Đ0.01(4,12) = 5.412 < ĐC = 12.27, the change of factor a, b, and c levels had a highly significant impact on the simulation results. The difference between the Đ values corresponding to the radial force and the axial force in the table was small. The results obtained by combining the random forest feature screening again show that the axial force was insensitive to the stress value. The model trained by the SR algorithm is tested. The results are shown in Figure 7(g) to (j). The training points and verification points in the figure were evenly distributed in the equivalent correlation function surface of the SR algorithm. The contact line stress value changes approximately linearly with the increase of axial load and temperature. The trained model expression is as follows: equations (24)–(31), where Γ is the contact line stress value (MPa), and x and z represent radial force (kN) and temperature (°C), respectively.
The above results show that temperature is the most important factor affecting the stress value of the contact line. The order of temperature terms in the correlation function obtained by the SR algorithm is relatively higher than that of other influencing factors, and the order of influencing factors in the correlation function corresponding to different attention parts is different. Compared with the results in Table 5, the MSE value of CMP at the contact line position between the roller and bearing inner ring was larger than that at other points, due to the larger maximum stress value extracted at this position. For example, the maximum stress value in Figure 7(i) is 1750 MPa, which is about six times that of the latter (DMP = 300 MPa) in Figure 7(j), so the MSE value calculated by CMP is larger.
Contact line AFP:
Contact line BFP:

Contact line CFP:

Contact line DFP:

Contact line AMP:

Contact line BMP:

Contact line CMP:
Contact line DMP:

Discussion
Based on the above analysis, the SR algorithm can better process the simulation test data and provide the mathematical equivalent correlation function of each contact line. Combining the SR algorithm with the finite element analysis, this method has certain feasibility from the perspective of simulation. Through linear interpolation, training, and verification, the original limited data is extrapolated to obtain more data, which provides simulation support for the realization of a single-bearing bench design.
From the perspective of engineering, the increase of stress value at any contact line position inside the bearing can affect the reliability analysis results of the bearing. Combined with the simulation results, whether it is a fixed point or a maximum point, the stress value at the contact line between the inner ring of the bearing and the roller is generally higher than the stress value of other contact lines, which is the focus of attention. In the above results, it is pointed out that the temperature has a great influence on the stress value of the contact line position inside the bearing. The grease can reduce the friction between the roller and the raceway to a certain extent, reduce the temperature between the contact surface of the bearing, and the same effect can also be achieved by reducing the bearing speed. The changing trend of stress value after exceeding the normal temperature range remains to be studied. In the bearing stand test, the infrared thermometer is set up on the upper part of the bearing box to monitor the internal temperature of the bearing. The normal operation state monitoring data and the abnormal temperature rise monitoring data are imported into the finite element software for analysis. The symbol regression method is also used for data processing to establish the bearing health state data set and the abnormal temperature rise data set. The training mathematical correlation function can be used for data screening and bearing temperature alarm device trigger limit, which provides a basis for bearing health state monitoring and evaluation.
In summary, the results showed that the axial force has less influence on the calculation results than the radial force in the process of axial force-radial force-temperature HMH stress equivalence. By referring to the expression of the fixed points correlation function at the contact line position in the outer ring of the roller, the axial load can be equivalent to the radial load. The equivalent effect can be verified by the calibration test of the strain gauge arranged in the outer ring of the bearing. It is meaningful for designing or simplifying the scheme of the bearing stand based on the life consistency equivalent model.
Conclusion
By establishing the sub-model of CRH380 axle box bearing, the radial force-axial force-temperature equivalence is studied, and the Huber-von Mises-Hencky stress is used as a bridge to exploring the equivalent relationship between different factors. The Symbolic regression algorithm is applied for data analysis and processing. The main conclusions of this study are summarized below.
(1) The equivalent correlation function trained by the SR algorithm can well express the equivalent relationship between the equivalent parameters, and 20% of the data of the database is randomly selected to verify the training model, the effect of data randomness is not included in the study.
(2) The axial loading can be equivalent to the radial load through the equivalent correlation function, and the temperature in the three factors has a great influence on the stress value of the contact line position inside the bearing.
(3) It is feasible and generalizable to analyze and process the finite element results with an SR algorithm from the perspective of simulation.
Footnotes
Handling Editor: Sharmili Pandian
Declaration of conflicting interests
The author(s) declared no potential conflicts of interest with respect to the research, authorship, and/or publication of this article.
Funding
The author(s) disclosed receipt of the following financial support for the research, authorship, and/or publication of this article: The authors sincerely thank the support from the National Key Research and Development Program of China (2021YFB3400703), the National Natural Science Foundation of China (Grant No. 52375159), the National Railway Administration of China (KF2023-025), and the Independent Research Project of the State Key Laboratory of Traction Power (Grant No. 2022TPL_T03).