
Abstract
With the rapid growth of the new energy vehicle industry, the number of end-of-life power batteries, which serve as the technological core, is also increasing significantly. Unfortunately, this rise in retired power batteries has led to severe environmental pollution and resource wastage. The detection of shell bolts in power batteries has thus become a crucial step in the recycling and disassembly process. To address this issue, this research proposes a detection method for end-of-life power battery shell bolts. Based on market analysis, the target bolt for the retired power battery shell was identified. The bolt images were collected and preprocessed to create a custom dataset on the experimental platform. Four popular object detection algorithms were compared, and the YOLOv8 model is selected to improve with EMA module. The improved YOLOv8 model achieves 98.9% for mAP_0.5, which increases more than 2 percentage points. Based on the repeatability of bolt recognition, this detection method can be used for the identification of bolts in other battery shells, providing a theoretical foundation for promoting the robotic disassembly of battery shells.
Introduction
The global new energy vehicle industry is currently experiencing significant growth, with China being the world’s leading producer and seller of new energy vehicles for seven consecutive years. 1 As of June 2023, China had sold 3,400,000 new energy vehicles, which is a 15% increase from the full year sales in 2021. These figures account for a global market share of 55%. 2 However, the rapid increase in electric vehicles poses a challenge in terms of retired power battery recycling management. Retired power batteries tend to deteriorate within 5 years, making them unsuitable for use in electric vehicles. 3 Consequently, a substantial number of retired new energy vehicles and their power batteries have accumulated since the development and production of new energy vehicles began in 2014. In the first half of 2023, China had retired 216,000 new energy vehicles, resulting in the generation of 94,000 tons of retired power batteries, 4 as shown in Figure 1. This trend indicates that the volume of retired power batteries is expected to continue increasing in the future. It is important to note that these retired batteries still hold significant value. They can be used through cascade utilization after health prediction, 5 facilitating reuse in new energy buses, battery charging stations, and other applications. Moreover, the extraction and recycling of metals such as lithium and cobalt from these batteries further strengthen the circular utilization of non-renewable resources. 6 Apart from its positive impact on environmental protection, the recycling of power batteries aligns with the sustainable and low-carbon principles of new energy vehicles. Regardless of whether the batteries are reused or recycled, the key step involves opening the battery shell to remove the battery cells. And the identification and removal of the shell bolts is a prerequisite for opening the battery shell. Therefore, ensuring the thorough inspection and detection of the bolts mounted on the battery shell is of paramount importance during the recycling procedure.

Development and retirement situation of new energy vehicles (adapted from IEA 1 ).
Bolts serve as essential connectors during the assembly and disassembly process. 7 In the assembly process of power batteries in the industry, the conventional method involves manually operation of an electric torque wrench. The operator inserts the screw into the threaded hole and tightens it with the electric wrench until the torque reaches the desired value, at which point the wrench automatically stops. 8 Currently, the disassembly of retired power batteries is commonly carried out manually. However, disassembly is not a simple reverse of the assembly process. Different power batteries employ various screw brands, models, and exhibit different retirement statuses, often resulting in screw deformations during disassembly. 9 Manual screw disassembly is more time-consuming and labor-intensive compared to assembly, thereby adversely affecting efficiency. Consequently, researchers have started investigating the use of robots for disassembly purposes. 10 Tan et al. 11 proposed a mixed disassembly framework that incorporates improved robot arms and manual workstations to achieve human-robot collaboration and reduce disassembly time. Kay et al. 10 simulated manual and robotic disassembly of PBS through offline simulation, where human-robot collaborative disassembly proved the most efficient. Various disassembly strategies were proposed to address complex disassembly objects. Zhang et al. 12 proposed a neural- symbolic approach for disassembly path planning of vehicle power batteries, which was validated through simulation. Alfaro-Algaba and Ramirez 13 developed a model for optimizing the disassembly sequence based on economic benefits and disassembly environment.
The reliability and effectiveness of the model were verified using an Audi A3 power battery as a case study. Ke et al. 14 proposed a framework-subgroup structure combined with a genetic algorithm to optimize the disassembly sequence. In their framework, an improved disassembly relationship mixed graph and matrix were used to describe the disassembly priority and connection relationship between components. Among various disassembly strategies, the initial step often involves the disassembly of the battery shell bolts, which is typically assigned to robots due to the low efficiency of manual bolt disassembly. However, currently, there is no mature algorithm for detecting retired power battery shell bolts to support this process.
Although research on the bolts of power battery is still at early stage, some researchers have made progress in recognizing bolts in other equipment. However, many of these algorithms heavily rely on specific application scenarios, making it challenging to transfer the acquired knowledge to different contexts. For instance, Bdiwi et al. 15 achieved bolt detection in motors based on grayscale, color depth, and HSV values. However, due to the unique structure of motors, their algorithm cannot be directly applied to other fields. Similarly, Cruz-Ramirez et al. 16 utilized a visual system combined with lighting feedback to detect and disassemble ceiling bolts, but this approach requires assistance from robots and specialized lighting systems. Other methods efficiently recognize bolt heads but require bolt movement. 17 Wegener et al. 18 focused on using a robotic system to assemble electric vehicle batteries and employed a Haar-type cascade classifier to identify M5 bolts on battery terminals. However, when false positives from the classifier were added to the negative set, the detection accuracy only reached 50%, rendering it unsuitable for industrial applications. Previous algorithms 19 relied on specific bolt characteristics for recognition and detection, limiting their performance to certain domains. In recent years, neural network algorithms have been applied in various fields. Dong et al. 20 and Yang et al. 21 used neural network algorithms to achieve reliability analysis of structures. Some scholars have also applied this algorithm to the field of bolt recognition. Yildiz and Wörgötter 22 employed the Hough transform and D-CNN algorithm to identify bolts on hard disk devices, achieving satisfactory results. Li et al. 23 used the Faster R-CNN algorithm to detect small bolts on mobile phones, but its accuracy is easily affected by bolt edges and cannot be easily transferred to other industrial fields. In the rare research on bolt detection in power batteries, some researchers 24 adopted the approach of adding smart tags to the battery shell and scanning them to obtain shell bolt data. However, the retired power battery shells are prone to wear and tear, which compromises the integrity of the smart tags. Li et al. 25 utilized a robot adaptive system and an improved YOLOX model to effectively identify the hexagonal bolts inside the battery components.
According to the analysis above, it seems that neural network algorithms demonstrate great performance in the current field of bolt recognition, making them suitable for detecting bolts in retired power battery shells. Therefore, this article employs the YOLOv8 algorithm on a self-built dataset. Also, this method imports the p2 module and EMA attention mechanism based on the characteristics of bolts as small targets. This enables the recognition of bolts with multiple models and varying retirement states. Experimental results demonstrate that this method significantly improves detection accuracy.
The rest of this article is organized as follows. Section 2 presents the process of developing the datasets and describes the methods employed for bolt detection. In section 3, the datasets are applied in a case study, and a comparison is made between mainstream algorithm models. lastly, Section 4 presents the key conclusions derived from the research and highlights potential directions for future research.
Materials and methods
This article employs object detection methods to identify bolts on retired power battery shells. The research begins with a thorough analysis of the various types of bolts present on retired power battery shells, which is accomplished through market research and article collection. Following this, a customized dataset is generated by simulating shell environment that replicates the recycling process. Images of non-magnetic broken materials are collected under optimal environmental conditions, pre-processed, and labeled accordingly. Four mainstream object detection algorithms are chosen for comparative analysis, and the model that demonstrates the best overall performance is selected. The framework of this section is illustrated in Figure 2.

Research technology roadmap.
Analysis of retired power battery shell bolts
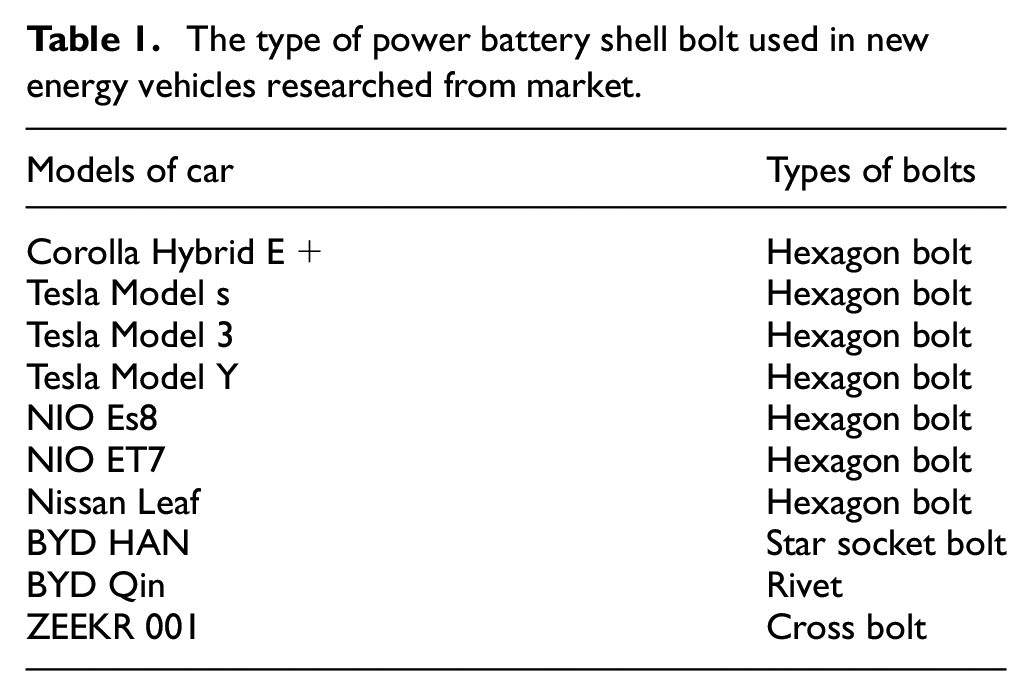
The electric vehicle market encompasses a wide range of vehicle models, each utilizing distinct power battery standards. As a result, the bolts used for shell attachments also exhibit significant variation. These bolts include hex bolts, cross bolts, spline bolts, and even challenging-to-remove rivets. Moreover, the sizes of these bolts are often different even within a specific power battery model. To address this variability, this research conducted a data collection process involving retired power battery shell bolts that are currently present in the market. After conducting a thorough investigation, a selection of 10 representative models of battery shell bolts is chosen for analysis. Table 1 provides an overview of these models, where hex bolts constitute the majority, with one cross bolt, one star socket bolt and one rivet included for reference. However, due to the challenging nature of disassembling rivets, their identification may not significantly assist in the actual disassembly process.
The type of power battery shell bolt used in new energy vehicles researched from market.
Li et al. 25 primarily investigated the detection of hexagon bolts and hexagon nuts. In addition, Zhang et al. 26 conducted experiments involving cross bolts and star bolts. Consequently, this article has selected two types of hexagon bolts, two types of cross bolts, one type of hexagon socket bolts, and one type of star bolts, each varying in size and type, as illustrated in Figure 3.
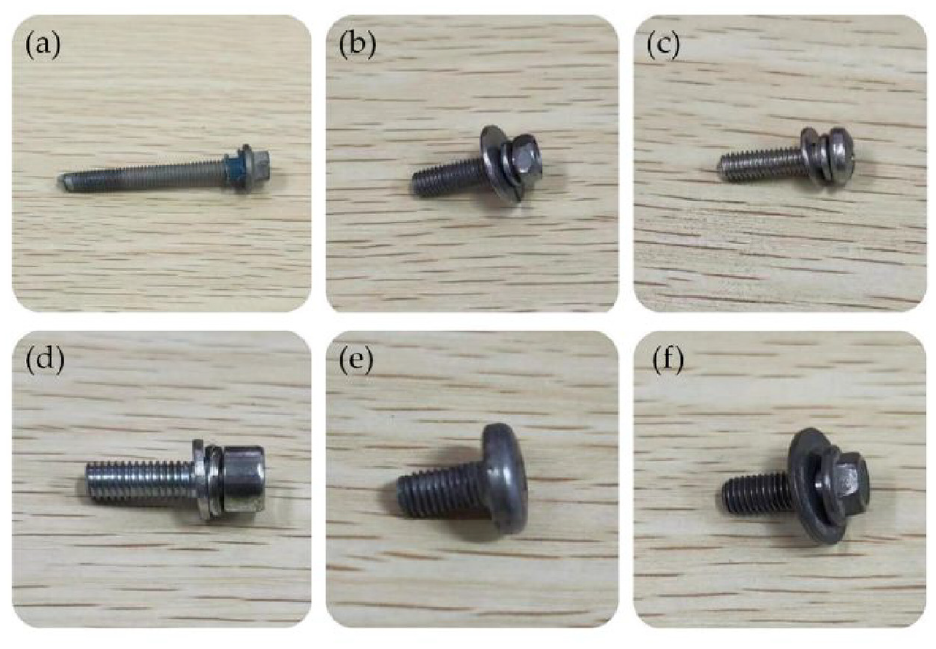
Selected retired power battery shell bolts: (a) hexagon bolt with cushion M6x50, (b) flat washer outer hexagon cross bolt M5x20, (c) round head flat washer cross bolts M4x16, (d) hexagon socket flat washer bolt M6x20, (e) round head star socket bolt M5x10, and (f) hexagon bolt with cushion M5x14.
To enhance the effectiveness of fastening and prevent damage during disassembly, bolts used on battery shells are commonly paired with washers to form combination bolts. In this article, the dataset includes not only single bolts but also more complex combination bolts. This approach ensures that the dataset closely resembles real-world scenarios, where combination bolts are commonly encountered. Considering that the typical service life of power batteries, which is approximately 5 years, the bolts included in this dataset are those used for the battery shell of retired power batteries within the last 5 years. However, it is worth noting that bolt types generally undergo minimal changes over time. Therefore, this dataset can also be applied to identify bolts on more recent retired power battery shells, even accounting for any potential improvements that may have been made.
To construct a bolt detection model based on deep learning, it is essential to gather a sufficient number of retired power battery shell bolt images for training and testing the deep learning models. However, due to the absence of a well-established system for recycling retired power batteries, there is limited existing research in this area, and no datasets specifically related to shell bolts are currently available. So, it is necessary to independently collect data and create datasets that align with the actual requirements. In this regard, a sample collection workstation has been designed based on practical needs. Intel’s D435 camera was used to collect the images. Some researchers23,25 use an eye-to-hand approach to capture images, which can provide higher accuracy for subsequent disassembly tasks. Other researchers 26 use an eye-in-hand approach to capture images, which offers a wider field of view. In the task of disassembling retired power battery shell bolts, both a wide field of view and sufficient accuracy are required. Therefore, a combination of eye-on-hand and eye-in-hand methods were employed to capture images, aiming to enrich the dataset. The eye-to-hand method fixes the camera on the screwdriving, which is installed on the end of the robot; the eye-in-hand method fixes the camera on a tripod. Both methods can effectively capture images of retired power battery shell bolts. Figure 4 illustrates the setup of the sample collection workstation.
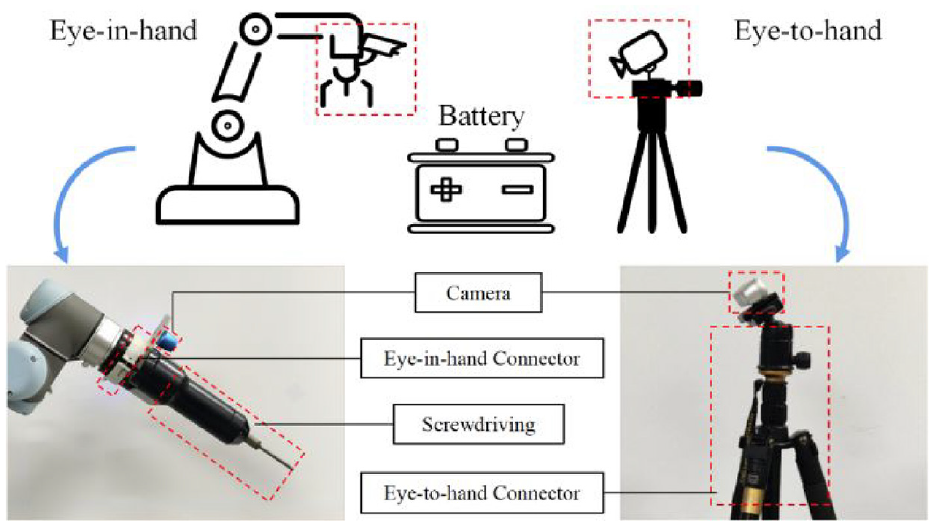
Details of image capture workstation.
Establishment of dataset for retired power battery shell bolts
After determining the target bolt and collection workstation, it is necessary to establish the collection environment. Due to the large size of the battery shell, it is difficult to collect a variety of shells. To address this, a hybrid approach is employed, leveraging both existing real shell environments and carefully constructed artificial metal environments to enrich the dataset with a wider range of data.
To closely simulate real-world situations, three types of metal stickers were chosen as the background for the dataset: silver, dark gray, and brown. Each sticker represents a different surface treatment process commonly applied to the metal shells of power battery packs found in various vehicle models. Specifically, the silver sticker represents metal spray painting, the dark gray sticker represents metal anodizing, and the brown sticker represents metal rusting. To further enhance the realism of the dataset, paint was applied to the metal stickers, and deliberate debris was placed on them. These additionally elements simulate the presence of special dirt and foreign objects that may commonly appear on the surface of metal shells during their operational lifespan. The real shell environment and simulate metal environments is illustrated in Figure 5.
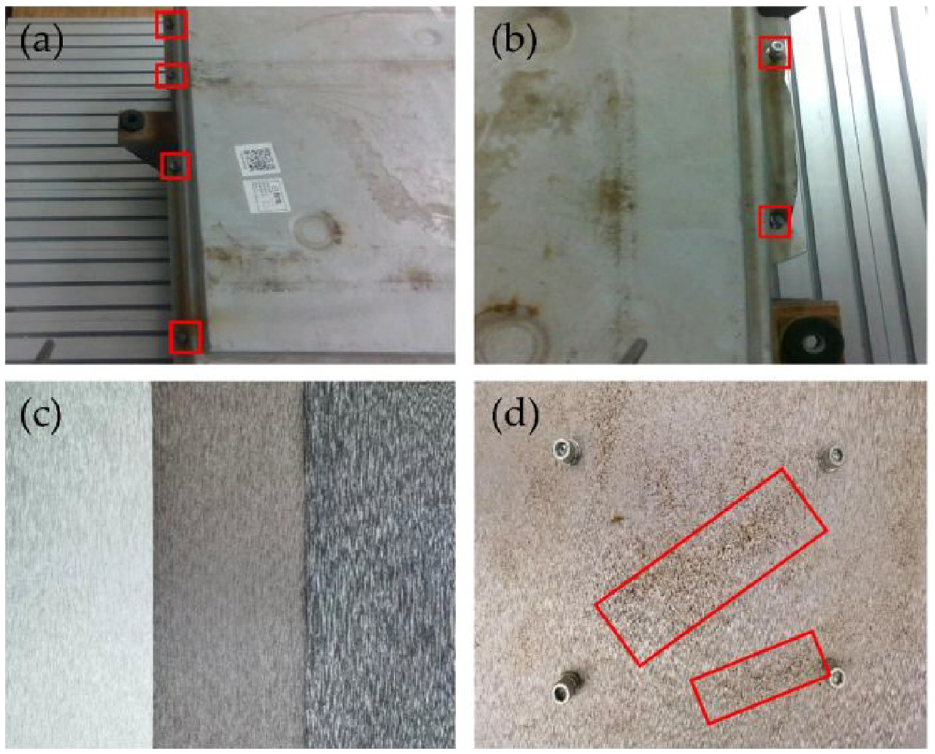
Practical environment and artificial environment: (a) bolts in the one side of real shell, (b) bolts in the other side of real shell, (c) simulate different metal environments, and (d) simulate surface dirt and foreign objects.
The dataset for environmental simulation comprised a total of 500 bolt images. Among these, 300 images were categorized as multi-target samples, while 200 images were classified as single-target samples. To conduct a comprehensive evaluation of the model’s performance, the dataset was divided into three parts, following a ratio of 7:2:1. The training set (Tr1) consisted of 350 images, the validation set (Val) contained 100 images, and the test set (Te) included 50 images. To facilitate the utilization of the algorithm model, all images in the dataset were uniformly processed to have a resolution of 640 pixels × 640 pixels. This standardization ensured that all images had a consistent input size during both the training and testing phases of the deep learning model. By employing the same resolution for all images, any potential inconsistencies related to image size were eliminated, leading to improved model performance and consistency across the dataset.
In order to enhance the diversity and variability of the datasets, this study employed data augmentation techniques, which included:
(1) Geometric transformation: A mapping relationship between original image pixels and transformed image pixels was established, through which the pixel coordinates of one image can be calculated from those of another. 27 The expression is shown in formula (2). The process of mapping image coordinates to output is typically referred to as forward mapping, while the reverse is known as backward mapping. Geometric transformations typically include image translation, scaling, rotation, skewing and so on.

(2) Adding noise: Disturbances from random signals can often occur during image acquisition or output, resulting in the appearance of certain randomly dispersed pixels on the image. These pixels are known as noise, which can interfere with the model’s analysis of image information 24 Common types of noise include Gaussian noise salt-and-pepper noise.
(3) Random brightness: The lighting intensity in the disassembly environment for power batteries cannot be uniformly controlled. Therefore, increasing the diversity of the dataset can be achieved by altering brightness. The expression for this is shown in formula (2):

α: Controls contrast.
β: Brightness parameter.
(4) Random hue: Hue refers to the overall appearance of color in an original image. By adjusting the hue, the effects of different color temperature lighting on experiments can be simulated.
The bolt images underwent a combination of different transformations and enhancements. As a result, the initial training set of 350 images is augmented threefold, resulting in a total of 1050 augmented retired power battery shell bolt training images. Both the processed and original images are depicted in Figure 6.
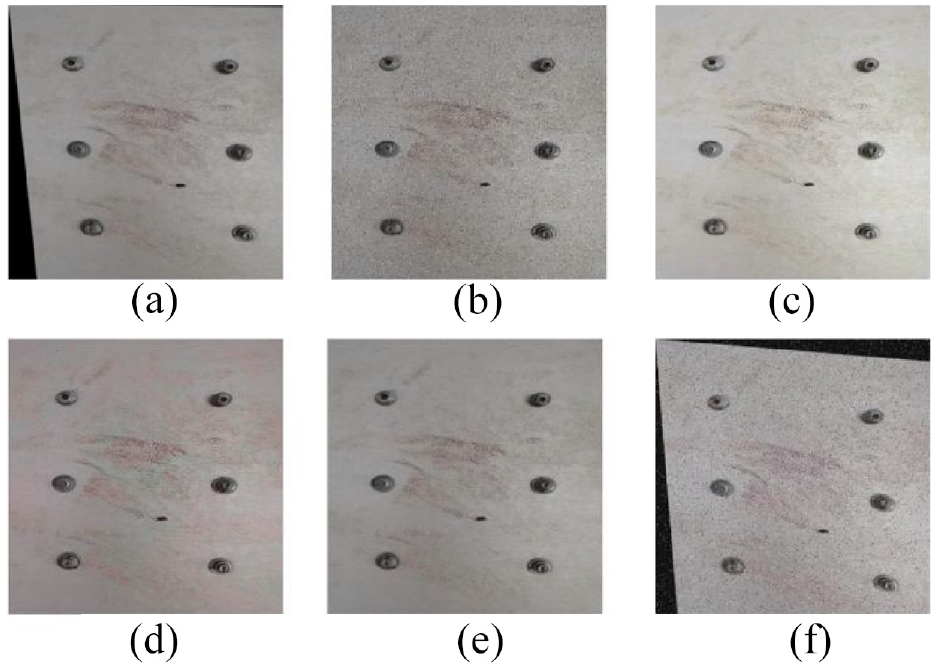
Processed images: (a) geometric transformation processing, (b) adding noise processing, (c) random brightness processing, (d) random hue processing, (e) original image, and (f) image after comprehensive enhancement processing.
In 6.a, geometric transformation processing is performed; in 6.b, noise is added; in 6.c, random brightness processing is performed; in 6.d, random hue processing is used; 6.e is the original image and 6.f is the image after comprehensive enhancement processing. Finally, the dataset comprises a total of 1200 images, with 1050 images for training, 100 images for validation, and 50 images for testing.
In this article, the Roboflow software was utilized for the labeling of bolt images. The labels assigned to the bolts include information about their sizes, as documented in Table 1. The labeling process primarily involved annotating the target position and target type of each image. These labels were saved in PyTorch format, which is commonly used for deep learning tasks. And normalization involves transforming the coordinate values of an image to a range between 0 and 1. This scaling down of pixel coordinate values simplifies the model computation and enhances the model’s processing speed. As a result, the model can effectively handle the data and make accurate predictions.
Deep learning-based object detection methods
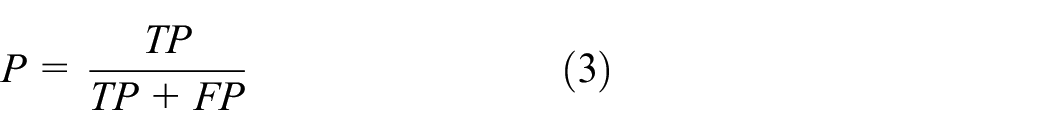
In this research, the performance of the models is evaluated based on various metrics including precision (P), recall (R), average precision (AP), mean average precision (mAP). These metrics provide a comprehensive assessment of the models’ detection accuracy and speed. The specific formulas are as follows:

P: Precision. Represents the proportion of correctly predicted positive samples among all samples that are predicted as positive by the model.
R: Recall. Represents the proportion of correctly predicted positive samples among all true positive samples.
TP: True Positive. Represents the number of positive samples that are predicted correctly.
FP: False Positive. Represents the number of negative samples that are predicted as positive.
FN: False Negative. Represents the number of background samples that are incorrectly detected as positive.

AP: Average precision. Represents a metric used to measure the detection accuracy of a single category.
P: Model accuracy – Represents the accuracy of the model.
t: Detection time – Represents the time taken for detection.
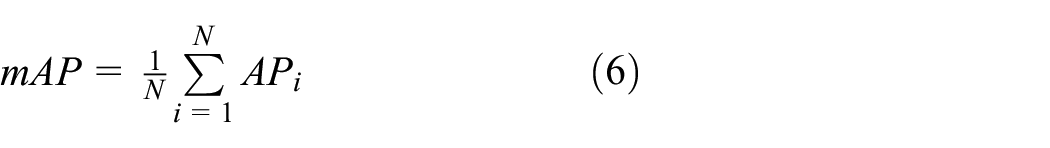
mAP: Mean average precision. Represents the average of all class APs, used to evaluate the performance of the system.
N: Number of object categories being detected, which in this case is the number of bolts.
APi: Average Precision of the model for the i-th class of target objects.
In the article above, Yildiz and Wörgötter 22 and Li et al. 23 used the R-CNN algorithm to recognize bolts, while Li et al. 25 used the YOLO algorithm. Based on this, this article selects the R-CNN and YOLO algorithms with exceptional performance in object detection: Mask R-CNN, Faster R-CNN, YOLOv5 and YOLOv8. Experimental comparisons are conducted on these four models with an IoU threshold set to 0.5. The comparison experiment results are shown in Table 2.
Comparison of four object detection algorithms.

The latest YOLOv8 model outperforms other models in terms of precision(P), recall rate(R) and mean average precision(mAP_0.5). Therefore, this article will finally use the YOLOv8 model as the baseline model to conduct experiments on the retired power battery shell bolt dataset.
Model optimization
The YOLOv8 model consists of three parts: Backbone, Neck and Head. The original YOLOv8 model has three output layers: P3, P4 and P5, as shown in the Figure 7. However, bolts are typical small objects, in order to improve the detection capability for small objects, an additional P2 layer is added to the original model, forming YOLOv8-P2 model. The P2 layer has fewer convolution operations and larger feature map size, which allows for better recognition of small objects. Additionally, an EMA attention module is introduced in the P2 layer to enhance the final recognition performance. Moreover, methods for model enhancement include updating performance functions, 28 optimizing loss functions 25 and so on. This article enhances the model by attention mechanism. Ouyang et al. 29 modified the sequential processing approach based on the CA attention and proposed a new Efficient Multi-Scale Attention Module (EMA). The EMA module first uses two 1 × 1 branches to perform global average pooling operation to encode channels and fits a 2D binary distribution on linear convolutions using two non-linear sigmoid functions. The attention maps of the two branches are then aggregated using multiplication. A 3 × 3 branch is used to capture local cross-channel interactions to expand the feature space. Finally, 2D global average pooling is used to encode global spatial information in the branches for cross-space learning to handle short-term and long-term dependencies, achieving the combination of channel attention module and spatial attention module. Since the attention module can be seamlessly integrated, so it is integrated into the P2 module of YOLO v8-P2, which emphasizes small object detection. And this integration improves the precision and recall rate of model.

Improved YOLOv8 model with EMA module.
Case study
This section focuses on presenting the experimental results of the improved YOLOv8 model. It includes information about the main devices used for the experiments and the analysis of the results obtained.
Train of improved YOLOv8 model
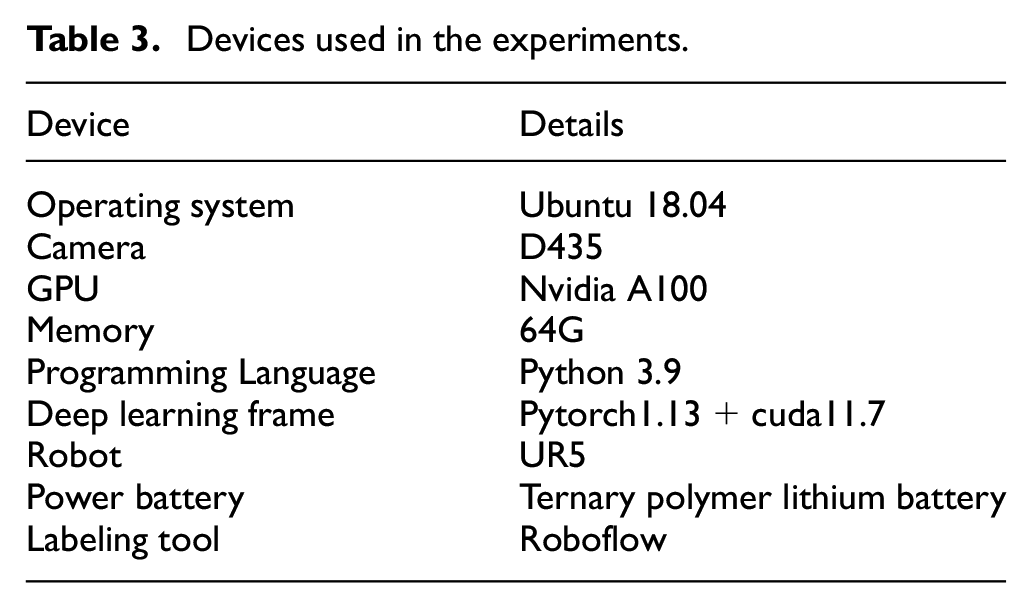
The experiments in this research were conducted on a Linux operating system, utilizing a NVIDIA A100 GPU. The development of the model was carried out using Python 3.9 programming language and the deep learning framework Pytorch 1.13+cu11.7. The input image feature sizes were set to 640 × 640 pixels in the training process. Table 3 performs the devices which are used in the experiments.
Devices used in the experiments.
The training employs an initial learning rate of 0.001, a cyclic learning rate of 0.01, a batch size of 16, a model’s threshold of 0.5 and a training duration of 400 epochs. The model is saved after each training round for future use. The losses of the training and validation gradually converge over the course of 400 epochs, as shown in Figure 8.

The loss curve of improved YOLOv8 model.
In order to control variables for conducting ablation experiments, besides the improved YOLOv8 model (YOLOv8s-P2+EMA), other models will also be trained using this approach. The results obtained from these models will be compared. The models included in the comparison are YOLOv8s, YOLOv8s-P2, and YOLOv8s + EMA.
Analysis of results
The results of the case experiments are in the Table 4. Furthermore, the evaluation is based on precision (P), recall (R), and mean average precision with an IoU threshold set to 0.5 (mAP_0.5). The results are presented in Table 3. Firstly, YOLOv8s-P2 model, which includes the added P2 module, achieves the better precision and mAP_0.5 than YOLOv8s model. Its precision and mAP_0.5 both increased by 0.9%. This proves that adding the P2 module is beneficial for recognizing smaller targets, such as bolts on retired power battery shells. However, the recall of the YOLOv8-P2 model decreased by 0.2% compared to the original YOLOv8 model, indicating that the reduced number of convolutions in P2 module also reduced the model’s robustness.
Experiments results of different YOLOv8 models.

Furthermore, the added EMA module produced significant effects by optimizing the model through the combination of channel attention mechanisms and spatial attention mechanisms. The precision, recall, and mAP_0.5 of the model with the EMA module showed significant improvements compared to the model without the EMA module. It also compensated for the reduced recall in the YOLOv8-P2 model. Ultimately, the YOLOv8-P2+EMA model yielded the best results, with precision increasing by 2 percentage points, from 95.9% to 97.9% compared to the original YOLOv8, recall increasing by 0.5 percentage points, from 97.6% to 98.1%, and mAP_0.5 increasing by 2.4 percentage points, from 96.5% to 98.9%. These results indicate a significant improvement in the enhanced model.
Table 5 shows the performance of the model on the test with a threshold of 0.5. There are 50 images and 173 labels in the test. Also, precision(P), recall rate(R), and mAP_0.5 for each type of bolt are presented. In the table, although most of the bolts achieved high recognition rates, cross bolt-1 and star bolt have lower precision and recall compared to other bolts. Because cross bolt-1 has a smaller diameter (M4) which requires higher recognition ability. As for star bolt, its surface texture presents a star-shaped pattern, which is less distinct than hexagon bolts and cross bolts. Particularly, when both the bolt and the shell certain stains or dirt, the difficulty of recognition increases significantly. This will be an area for further research in future studies.
Comparison of three object detection algorithms.

Conclusion and future works
The proposed methodology for identifying bolts on the shell of end-of-life power batteries introduces a sophisticated target detection approach that effectively addresses the shortcomings associated with conventional bolt detection techniques. This novel method surpasses previous limitations by enhancing detection efficiency, reducing operational costs, and minimizing resource expenditure.
(1) A target bolt for the retired power battery shell was identified based on analysis of market and article. Images of the target bolt were captured and a dataset was built on the established experimental platform. To enhance the dataset, the images underwent preprocessing. Four popular object detection algorithms were compared, and YOLOv8 model was selected as the baseline model. The P2 module and the EMA attention mechanism are added to improve the original YOLOv8 model.
(2) Through case validation, the improved YOLOv8 model achieved a precision of 97.9%, a recall rate of 98.1%, and a mAP_0.5 of 98.9% on the test set, meeting the performance requirements.
(3) The practical significance of this method lies in its ability to streamline bolt recognition and disassembly processes, ultimately improving efficiency, productivity, and cost-effectiveness. Moreover, the broader implications of this research extend beyond the realm of retired power batteries, offering valuable insights for the development of automated disassembly processes in various industries.
Future endeavors will be focused on the deployment of cameras with enhanced precision to facilitate comprehensive inspection of bolts across the entire battery shell, aiming to significantly boost detection efficiency. Concurrently, efforts will be made to enrich the dataset by incorporating a wider array of bolt types and quantities, thereby elevating the model’s robustness.
Footnotes
Handling Editor: Chenhui Liang
Declaration of conflicting interests
The author(s) declared no potential conflicts of interest with respect to the research, authorship, and/or publication of this article.
Funding
The author(s) disclosed receipt of the following financial support for the research, authorship, and/or publication of this article: This work was supported in part by the Municipal Natural Science Foundation of Shanghai (21ZR1400800).