
Abstract
The main purpose of this paper is to explore the importance of external flow field circulation of hydraulic torque converter assembly in analysis. Compared with simply considering the internal flow field characteristics, it has influence on the internal flow field analysis, external characteristics and structural stress of hydraulic torque converter assembly. This paper models the flow path of the torque converter with different Schemes, the flow field pressures distribution on the impeller are analysed using computational fluid dynamics method (CFD). Scheme A adopts the traditional idea, which simply considering the influence of internal flow field on the performance. Scheme B contacts the external flow field especially including the auxiliary cavity, and comprehensively studies the influence of it on the performance. The results show that with the addition of an auxiliary chamber, the overall flow field pressure of the torque converter is lower than that without the auxiliary chamber. The external characteristics of the torque converter assembly were tested on experiment equipment, which has been verified that the CFD simulation results with the addition of the auxiliary chamber are closer to the experiment data, proving the accuracy of the method for the pressure simulation of flow field. On this basis, the stresses and deformations of the torque converter considering the auxiliary fluid chamber are compared and analysed in relation to the displacement limitations of the impellers. The results show that the maximum stress in the turbine is reduced by 57%–12% compared to the scheme A without considering the auxiliary fluid. In the case of special operating condition, the maximum stress was 137.06 MPa before considering the auxiliary fluid, while the maximum stress was 60.625 MPa after considering the auxiliary fluid, and the reduction is 57%. The effects of input speed, speed ratio and impeller structure on the stress and deformation were also analysed, and the results show that the impeller structure and input speed have a great influence on the stress and deformation.
Keywords
Introduction
The torque converter is the core component of the automatic transmission (AT), As a product with a high market share in automatic vehicle transmissions, which has unparallelled advantages in the construction machinery sector. 1 The torque converter changes speed and torque according to the external load on the turbine shaft automatically and steplessly. 2 The torque converter consists of three main components: the pump, the reactor and the turbine. The power from the engine is transmitted from the flywheel, which rotates the pump to input the power. The pump drives the fluid to rotate and impact the turbine blades to output the power 3 , and the torque converter used in article has shown in Figure 1. The addition of a lock-up clutch in the torque converter allows the turbine and pump to be connected as one part at high speed ratio. The transmission condition changes from hydraulic to mechanical which improves the efficiency. With the increasingly stringent requirements for energy saving and emission reduction, it has become a trend to instal lock-up clutches in torque converters. AT usually uses hydraulic transmission in first gear only, and the rest of the gears adopt mechanical transmission directerly. 4 In this mean, the study of the relevant characteristics of torque converters with lock-up clutches has become a research priority.

Introduction to torque converters: (a) mine truck vehicles, (b) automatic transmission and (c) torque converter assembly and main components.
The design of the impeller structure is the main focus. The design of the circulating circle parameters, as well as the inlet and outlet angles of the blades, the thickness of the blades, the deflection angle and the number of blades can make the designed torque converter achieving the required performance. At the same time, the strength of the impeller is related to the working life strongly. A reasonable design must meet the performance requirements and the strength requirements. A thin impeller structure is prone to the dangers of blade breakage, impeller deformation and output hub breakage during operation. A thick impeller structure will squeeze the fluid space, which will making the torque converter too heavy and the output inertia too large and affecting the launching performance. When designing torque converters for high power density and light weight, the strength and stiffness of the blades should be fully considered.
Xu et al. 5 studied the structural excitation interaction inside the torque converter, and tested the pressure pulsation characteristics at the fixed point position of the blade. Baghban et al. 6 studied the characteristics of the loader’s torque converter after lock-up and build the dynamics model of the torque converter during lock-up, and also studied its characteristics after matching with the engine. Gupta et al. 7 studied the torsional vibration characteristics of the torque converter before and after locking, and simulated its torsional vibration characteristics in each gear. Yong et al. 8 focussed on the slip control method of lock-up clutch while launching, which effectively reduces the fuel consumption of automatic transmission. Maduka and Li 9 studied the rebound characteristics of stamping-type torque converter blades and numerically simulated the weld strength of stamping-type torque converter based on fluid-structure coupling method. Ran et al. 10 has proposed a new parametric design method for a hydrodynamic torque converter cascade. The new parametric design method of the blade shape and the integrated optimization design system of a three-dimensional cascade of torque converter proposed in this paper significantly reduces the design costs and shortens the design cycle of the torque converter, which will provide a valuable reference for engineers of turbomachinery. Simão and Ramos 11 predicts the blade strength of welded torque converter based on the fluid-structure coupling method, and proposes to add reinforcement in the middle of the blade to effectively improve the mechanical properties of the blade.
Current research on fluid-structure coupling in torque converters is based on the study of the internal flow field characteristics in closed flow channels. With the use of lock-up clutches, the overall flow field analysis of the torque converter can be more accurately characterised including the auxiliary fluid. It is particularly important for the turbine, 12 which is the component about power output. Because the auxiliary fluid follows the pump wheel on one side, and rotates with the turbine on the other, which is impeded by components such as the lock-up clutch. This fluid has an influence on the internal flow field and generates pressure on the back of the turbine, which affects its stress-deformation characteristics specially. 13
CFD simulations are carried out for a flow path containing an auxiliary cavity fluid to derive an accurate flow field pressure distribution, and compare the CFD results without an auxiliary cavity. 14 Based on this, a fluid-structure coupling analysis is carried out to compare the differences in impeller deformation studied based on the two different flow field pressure distribution. The prediction extent to the external characteristics of the torque converter is demonstrated with a significant improvement compared to the previous one. The effects of different speed ratios, different input speeds and different configurations on stress-deformation are investigated separately. References are provided that the impeller structure and input speed have a great influence on the stress and deformation.
Numerical equations for fluid-solid coupling
Fluid control equations
Fluid flow follows the general laws of physical conservation: including the law of conservation of mass, the law of conservation of momentum and the law of conservation of energy. The fluid in a torque converter is an incompressible viscous fluid. In numerical simulation its control equations include the continuity equation and the momentum equation. The specific mass conservation laws and momentum conservation laws are as follows:
Fluid continuity equation.

where
Momentum equation.

where
Energy equation.

where

where
Large Eddy Simulation (LES) subgrid model
In the LES model, small-scale eddies need to be filtered out and then modelled through the subgrid scale model to solve for the small-scale eddies. The filtering function is calculated as follows. 15
where
For incompressible flow, the control equation after filtering by the filter function is follow:

where

where
Different definitions of
Solids control equations
The conservation equation for the solid part can be derived from Newton’s second law as follows 18 :

where ρs is the solid density, δs is the Cauchy stress tensor, fs is the bulk force vector and ds is the solid domain local acceleration vector.
The basic equation for the dynamics of an ideal elastomer with small deformations is follow:


Where
Fluid-solid coupling equations
A complete set of control equations has been established for the fluid and solid domains respectively, providing the necessary theoretical basis for the analysis of fluid-solid coupled systems. In addition to satisfying the two sets of control equations for fluid and solid, the corresponding boundary conditions must also be satisfied for the solution of fluid-solid coupled systems. In particular, the kinematic and dynamic boundary conditions on the fluid-solid interface must be satisfied.
Similarly fluid-solid coupling follows the most basic conservation principle. So at the interface of the fluid-solid coupling should be satisfied. The fluid domain solid stress (τ), displacement (d), heat flow (q), temperature (T) and other variables are conserved. So the following four equations are satisfied 19 :

The essence of the numerical solution is an iterative process. Considering the flow field under the action of a dynamic load in a non-constant case and proposing an iterative process for the mutual coupling of fluid and structure in the flow field is necessary. The steps of the iterative calculation are as follows
21
: (1) given the deformation of the boundary of the solid structure in the perturbed flow field as
Flow field analysis and performance prediction
Processing model and setting boundary condition
Two different methods of fluid model are adopted respectively. Method A is to treat the pump, turbine and reactor as a closed cavity, which consisting of three different flow field through three interaction surfaces P-T, T-R and R-P to form a whole, as shown in Figure 2(a). Method B is to add auxiliary cavity fluid at the pump outlet and turbine inlet, consisting of four different flow field P-C, C-T, T-R and R-P to form a whole, as shown in Figure 2(a).

Fluid model and grid model: (a) fluid model scheme A and B and (b) grid model: (I) cross section of scheme B, (II) Impeller dense layer grid and (III) grid independent analysis.
In order to simplify the calculation process, the fluid domain is considered as a closed body. No mass or energy exchange with the outside world is generated, so there is no inlet or outlet wall. 20 Also the oil temperature changes little during the operation of the torque converter, so the temperature of fluid is considered to be constant in study process.
The speed of the pump fluid is set at 1800 rpm, and the inner and outer rings and vanes are set as opposed to the stationary wall. The turbine fluid domain is set to different values from 0 to 1800 rpm according to the speed ratio, and the inner and outer rings and vanes are set in the same way as the pump. The turbine fluid domain was set to 0 rpm and the speed of the inner and outer ring walls were set to 0 rpm. The auxiliary cavity fluid domain was set to the average of the speeds of turbine and pump, the other settings of the CFD model are shown in Table 1.
Boundary condition settings for CFD calculations.

All the impeller in the torque converter were modelled as shown in Figure 2(I). A higher quality hexahedral mesh was also generated using ANSYS ICEM and a boundary layer mesh was added around the blade. The mesh model is shown in Figure 2(II). The verification of mesh irrelevance was also carried out, and it can be obtained that the more the number of meshes, the smaller the calculation error of the torque ratio, which is shown in Figure 2(III). However, the error no longer decreases significantly at a certain value of the number of meshes, but the computation time increases exponentially. Considering the limited computational resources, it is appropriate to adopt a 6.8 million grid.
Flow field analysis for braking conditions
Flow field analysis of scheme A
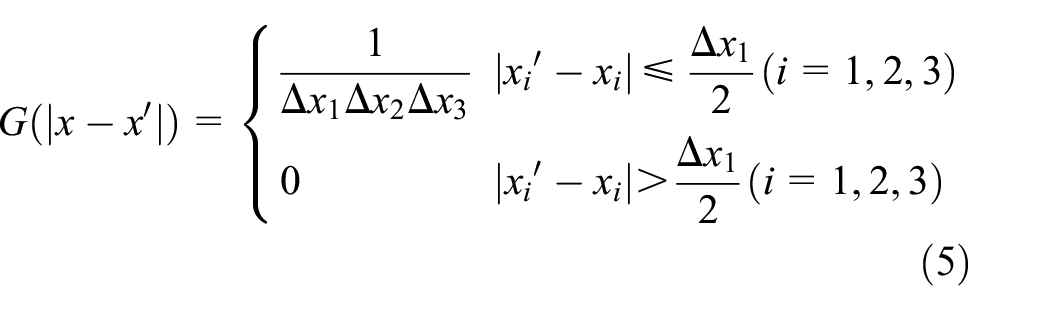
When the input speed is 1800 rpm which is in the braking conditions, there is a local low pressure at the blade root at the pump inlet, and a high pressure at the pump outlet with a maximum pressure of 1.37 MPa. The liquid flow impinges on the turbine blades with high speed and high kinetic energy, which forming a high pressure area on the pressure side of the turbine blades with a maximum pressure of 2.27 MPa, and a low pressure area at the head of the turbine blade inlet. The large angle between the turbine outlet and the reactor inlet creates a high pressure at the pressure side of the reactor with a maximum of 2.14 MPa, and a low pressure at the head of the reactor inlet. The pressure distribution of the runner A impeller is shown in Figure 3(I)–(III).
Comparison of pressure between scheme A and B: (a) impeller pressure comparison: (I)–(III) scheme B impeller pressure, (IV)–(VI) scheme A impeller pressure, (b) pressure of scheme B: (I) overall pressure, (II) auxiliary chamber pressure and (III) turbine back pressure.
Flow field analysis of scheme B
Scheme B contains the fluid from the auxiliary chamber and differs from scheme A that mainly in the area, where the auxiliary fluid meets between the pump and turbine. The fluid flowing from the pump partially impacts the turbine vane pressure surface and partially flows through the intersection into the auxiliary chamber. The maximum pressure is 1.18 MPa for the pump, 1.63 MPa for the turbine and 1.81 MPa for the reactor. The maximum pressure in the auxiliary chamber is 0.39 MPa, which occurs near its junction with the pump and turbine. Comparing the pressure distribution in scheme A with B which has shown that: the overall pressure in the flow field drops after considering the fluid in the auxiliary chamber, with the turbine pressure dropping most significantly. The pressure distribution of the impeller in scheme B is shown in Figure 3(IV)–(VI).
Analysis of the flow field in the turbine
During the operation of the torque converter, the flow field of the internal fluid is very complex especially during stall conditions. Figure 4 shows the distribution of the internal fluid of the turbine during stall operation, including the distribution of pressure flow lines, vortex volume and velocity inside the turbine. In the stall condition, the oil flow inside the pump flows through the impeller vane and then flows to the outlet. Due to the continuous pushing effect of the pump, the oil has a certain speed before flowing out of the pump outlet and into the turbine inlet. Because of the turbine vane obstruction, it force the oil into the turbine vane between the channel and the oil flow direction has changed dramatically. The oil enters the turbine and violently impacts the pressure surface of the turbine, thus forming a high pressure zone near the turbine inlet. At the same time, small areas of low velocity occur near the pressure surface inlet of the turbine blades due to the violent impact of the oil. This is graphically illustrated in Figure 4(a). Because of the large entry angle of the turbine blades during the cut into the turbine, a low pressure phenomenon of de-flow can form at the suction side of the turbine blades. Thus a high pressure side (pressure surface) and a low pressure side (suction surface) are formed at the entrance of the passage between the two turbine blades, and at the same time a large pressure gradient is formed in the oil in the passage between the blades.

Comparison of flow fields about turbine in stall conditions: (a) pressure comparison, (b) turbulent intensity comparison and (c) velocity comparison.
A higher pressure will inevitably result in a higher torque in Figure 4, which effectively explains the large increase in torque ratio at stall conditions. In addition, the flow velocity and pressure in the high vortex region are relatively low, which is quite evident in Figure 4(b) and (c). This phenomenon is due to the fact that the flow in the high vortex region has a greater velocity spin, and large areas of high vortex may have larger scale vortices. The necessary factor for the formation of vortices is the pressure differential. The vortex is formed in the area of high differential pressure and the vortex centre is located in the low pressure area. From the flow lines in Figure 4(b), it can be seen that the original model has a clear vortex formation at the entrance to the turbine blade pressure surface. This vortex can be seen from the flow lines to cause the oil at the turbine entrance to backflow and flow back to the no-grate area until it is pushed into the back of the grate channel by the upstream oil.
Experimental performance and simulation prediction
The torque converter experiment equipment consists the oil compensation system, the main system (including drive/load motors, torque sensors, shaft angle encoders etc.), data acquisition and control system. The layout of the torque converter equipment is shown in Figure 5(b). The constant speed test is carried out in accordance with the requirements of GB/T7680-2005. The drive motor drives the pump of the torque converter, replacing the engine with an electric motor as the power source, which input power to the torque converter pump. A speed and torque sensor is connected to the rear to measure the torque and speed of the turbine. 21 When the torque converter is operating, the turbine generates torque to the load motor. The torque and speed at the input and output are recorded, and the original characteristic curve is plotted. The experiment equipment principle is shown in Figure 5(a).

Schematic diagram of the facility: (a) principle of the torque converter experiment facility and (b) physical photograph of the experiment facility.
Constant speed experiments were carried out with an input speed of 1800 rpm and output speed at intervals of 0.05 speed ratio. The input speed np, input torque Mp, output speed nt and output torque Mt are recorded simultaneously, after which the data is processed to obtain the parameters related to the overall performance.
22
The main parameters include efficiency (
CFD simulations were carried out to obtain the pressure distribution on the impeller and the blade surface, and the impeller’s torque was calculated later. A comparison of the numerical simulation results with the experimental data is shown in Figure 6, where it can be seen that the CFD results calculated using scheme B are better than the CFD results calculated using scheme A in terms of prediction accuracy. The formula for efficiency is shown below. So the results of the error analysis for efficiency are the same as those for the torque ratio.

where

Comparison of simulation data and experiment for two schemes: (a) torque ratio comparison, (b) error comparison of torque ratio, (c) energy capacity comparison, (d) error comparison of energy capacity of pump, (e) efficiency comparison and (f) error comparison of efficiency.
Fluid-solid coupling analysis
Bilateral fluid-solid coupling analysis method
In the fluid-solid coupling process, the interaction between the fluid and the solid in two-phase medium is very non-linear. Not only the fluid equation of motion is non-linear, but the characteristics of the coupled motion will vary with the vibration amplitude of the structure. This makes the mechanical behaviour of the coupling process very complex. 24 From a general point of view, fluid-solid coupling problems can be divided into two main categories according to their coupling mechanisms. The first major category is interface coupling, also known as unidirectional fluid-solid coupling. This problem is characterised by the coupling of two-phase medium, occurring only at the interface between the two phases of fluid and solid. 25 In the equation coupling is introduced by the equilibrium and coordination relationship between the two phase coupling surfaces. Through the coupling interface, the fluid dynamics affects the solid motion, which in turn affects the distribution of the flow field. 26 The second major category is intra-domain coupling, also known as interactive fluid-solid coupling. It is characterised by the partial or complete overlap of the two phases about the fluid and solid media, which is difficult to separate unambiguously. So that the equations describing the physical phenomena need to be established for specific physical phenomena, especially the instantonal equations. The coupling effect is reflected by the differential equations which describing the problem.
In the study of the impeller structure and fluid excitation effect about torque converter, the calculation of two-way fluid-solid coupling requires the flow field (CFD) and solid deformation (FEA) to be solved simultaneously, which increases the calculation time. In practical terms, the deformation of the impeller of the torque converter is usually small generally within 0.1 mm, while the mesh size of the impeller solid structure is around 1–2 mm. In the case of small structural deformation and considering only the influence of fluid loads impact on the solid structure, it is feasible to use the unidirectional fluid-solid coupling technique for structural strength analysis, and save a lot of computational resources at the same time. The specific flow of the unidirectional fluid-structure coupling is shown in Figure 7.

Principle of unidirectional fluid-solid coupling.
Load application of static analysis
As the hydraulic torque converter is a flexible transmission element, the torque transmission between the input shaft and the output shaft is through the interaction of oil. Under normal circumstances when the external load changes dramatically, the rotational speed of the input shaft, the pump wheel and the engine remains unchanged. While the rotational speed of the turbine and the output shaft increases rapidly. At this time, the torque on the turbine is reduced due to the decrease of the rotational speed difference between input and output components.
Under unstable working conditions, if the influence of mechanical loss is not considered, the torques on the pump wheel and turbine of hydraulic torque converter are respectively as follow:


Where the sum is the hydraulic torque on the pump wheel and turbine of the hydraulic torque converter under unsteady working conditions; JBZ and JTZ is inertia torque of main rotating parts such as pump wheel and shaft, turbine and turbine shaft. From previous practical experience, it can be concluded that the dynamic characteristics of hydraulic torque converter have the following characteristics:
(1) Under the strong unstable working condition caused by the rapid change of external load, the change of pump shaft speed ω B is extremely small. Therefore, the vehicle transmission system equipped with hydraulic torque converter can make the engine work in a stable working condition when the external load changes sharply, even if the hydraulic torque converter has great penetration.
(2) Under various unstable working conditions with different change intensities caused by different external loads, the difference between the dynamic impeller torque coefficient of torque converter and the static value is less than 3%.
(3) Under different unsteady working conditions, the relationship between dynamic flow rate and time in the working chamber Q = Q(i) is not much different from that in the static state. Therefore, at the same speed ratio, the torque acting on the guide wheel is the same under both dynamic and static conditions.
(4) According to the actual working conditions of the hydraulic torque converter, when the vehicle starts, the speed difference is the largest, and the torque borne by the turbine is the largest. With the increase of load speed, the torque transmitted by the turbine gradually decreases. Therefore, the stress and strain at 0 working condition is the most dangerous situation.
Static deformation analysis
The impeller model of the torque converter was selected from the assembly noting that the impeller is cast in aluminium alloy throughout. The load and deformation on the impeller are analysed in relation to the assembly. The pump is subjected to the flywheel that torque transmitted from, which generates a rotational motion that drives the fluid inside the pump through and inputs the power. Displacement limits include flow field pressure, restrictions at the flywheel input and hub output, and centrifugal forces. The turbine is impacted by the fluid flowing out of the pump, creating a rotational motion that outputs the power. Flow field pressure loads, auxiliary cavity flow field pressure, turbine hub at deformation, and centrifugal force loads need to be applied in it. The reactor is impacted by the fluid flowing from the turbine. Only the flow field pressure, the restriction on the contact surface with the freewheel need to be applied. The restrictions subjected to the specific impellers are shown in Figure 8.

Displacement limitations and flow field pressure loads: turbine’s loads and limitations, reactor’s loads and limitations, pump’s loads and limitations.
Because the whole impeller needs to be analysed in the static analysis, the torque converter cascade is not equal in thickness, there are many complex spatial surfaces, and the diameter of the circular circle is small, and the impeller contains blades, fillets, outer rings, inner rings and other structures. So tetrahedral grids should be adopted. Therefore, the minimum grid size should be appropriately reduced to ensure the grid density, and the grid size should be encrypted at structural transitions. At the same time, considering the influence of different grid sizes on the analysis results, the influence of different grid sizes on the maximum stress value and the location of the maximum stress is analysed and studied by taking the maximum stress of the turbine in Scheme B as a reference, as shown in the following Table 2. Considering that too many grids in non-stress concentration positions will obviously increase the calculation time, and the overall grid size is set to 2 mm.
Grid independence analysis.

Comparison of stresses under fluid-solid coupling
A specific working condition was selected for the comparison analysis of the two schemes. The speed of the engine matched with the heavy vehicle is always in 1800 rpm, the condition at an input speed of 1800 rpm and output speed of 0 rpm was analysed. As can be seen from the pressure distribution between scheme A and B in Figure 4(a), the overall pressure in the flow field has decreased in scheme B. The highest pressure in scheme A at the turbine surface is 2.27 MPa. While some of the fluid flows that have entered the turbine should into the auxiliary chamber, the highest pressure on turbine in scheme B decreases, and the highest pressure overall occurs at the reactor. This results in a lower overall stress in scheme B than A.
As shown in Figure 9, the maximum stresses occur at the same locations for both schemes. The maximum stress in the pump occurs at the connection between the vanes and the inner ring at the outlet; the maximum stress in the turbine occurs at the connection between the vanes and the shaft hub at the outlet; and the maximum stress in the reactor occurs midway between the suction surface of the vanes and the connection between the inner ring. The above results show that after taking into account the effect of the auxiliary cavity fluid, there is a large decrease in the stress value of the turbine. The drop level is 55.7% that is from 137.06 to 60.652 MPa. This is mainly due to the fact that the fluid pressure at the auxiliary chamber exerted on the turbine with the internal flow on each other surfaces, thus reducing the stresses at this location. At the same time the maximum stress in the pump decreased from 49.634 to 34.223 MPa, the decrease level is 31.04%. The maximum stress in the reactor increased from 84.149 to 100.22 MPa, an increase level is 19.09%. The results of the analysis influence the structural design at the hub, indicating that it is more reasonable to consider the auxiliary cavity fluid.

Comparison of the stresses in scheme A and B. The stresses in the impeller under scheme B are shown on the left, and the stresses in the impeller under scheme A are shown on the right.
Comparison of deformations under fluid-solid coupling
As shown in Figure 10, the overall deformation of the impeller in scheme A is greater than B. The maximum deformation of the pump is close in both schemes, but at different locations. Scheme A is located at the outlet where the vanes are connected to the outer ring, while scheme B is located at the outlet where the vanes are connected to the inner ring. The maximum deformation of the reactor is close in both Schemes, both being located at the inlet of the inner ring near the middle of the two vanes. Scheme B reduces the maximum deformation of the turbine from 0.338 to 0.111 mm, due to the consideration of the effect of the fluid pressure in the auxiliary chamber. The overestimation of the turbine deformation will affect the design of its clearance to the pump cover, which will lead to the failure of the unlocking control of the lock-up clutch in the auxiliary chamber.

Comparison of the deformations in scheme A and B, with the deformation of the impeller under scheme B on the left, the deformation of the impeller under scheme A on the right.
Influence of speed ratio on fluid-solid coupling analysis
Flow field pressure analysis at different speed ratios
When pump speed is 1800 rpm, the turbine speed is taken to be between 0 and 1800 rpm according to the speed ratio in scheme B. The maximum value of the flow field pressure and the dangerous surface of the impeller is obtained by the fluid-solid coupling simulation analysis under various operating conditions. This is shown in Figure 11(a): it can be seen that the pressure values of all three impellers decrease as the speed ratio increases. The reason for the drastic change in the flow field pressure of the reactor is the high torque applied to it at launching state, which has a significant torque change effect. At high speed ratios, the torque converter is close to the coupling condition which the reactor is less affected by the liquid flow, so it is subject to less pressure and torque. Because the pump is the power input part and the speed is maintained at 1800 rpm, the centrifugal pressure generated by the fluid is high and plays a major role. So the pressure changes in the flow field of the pump are relatively gentle. On the other hand, the turbine is subject to large variations in speed which resulting in equally dramatic variations in flow field pressure values.

Numerical comparison and main effects analysis: (a) pressure of impellers, (b) main effect of turbine, (c) stress of impellers, (d) main effect of reactor, (e) deformation of impellers and (f) main effect of pump.
The maximum output torque is during the braking condition, the greatest pressure on the impeller and the most severe working conditions require detailed analysis of the deformation and stresses. The maximum efficiency condition is related to the economy state of the torque converter and is an important indicator of the design. The coupling condition in which the reactor is nearly unstressed is usually used as the lock-up point. Therefore, three special operating conditions named braking, maximum efficiency and coupling are selected for detailed analysis. The flow field in the braking condition has been analysed in detail before and will not be repeated here. The pressure in the flow field for the whole operating conditions is shown in Figure 11(a).
When the flow field is at maximum efficiency state. The overall pressure in the flow field is low, which is up to 0.56 MPa. And the high pressure area is concentrated at the pump outlet and turbine inlet, with an extended distribution of high pressure areas compared to the braking condition. The main concentration is on the outer ring, while the overall pressure in the inner ring is low. The overall pressure in the reactor is low, with higher values in the vane work near the pressure surface than in the inner and outer rings. The low pressure area is formed at the head of the blade near the suction surface, so that the reactor is still subjected to a small torque and the torque converter is working at high efficiency.
When the flow field is in the coupled working condition state. The overall pressure distribution of the flow field in the coupled condition is close to the highest efficiency condition, but the highest pressure is 0.54 MPa. The only difference is that the pressure in the flow field of the reactor is uniform and there is no obvious difference between high and low pressure. Therefore, there is no torque changing effect and the torque converter is working in the coupled condition.
Stress and deformation patterns
Correlation analysis about pressure and stress and deformation
The main effects of impeller flow field pressure and stress and deformation are shown in Figure 11(b), (d) and (f). The trend of the three data is similar at low speed ratios, indicating that the main factor affecting stress and deformation at this time is the flow field pressure. Due to the increasing centrifugal stress, the three trends deviate to a certain extent at high speed ratios, indicating that the main influencing factor at this time is the centrifugal load. The trend of the reactor’s stress and deformation and the flow field pressure are the same, which means that the only dominant factor is the flow field pressure load. Pump’s deformation and flow field pressure change trend is similar, but the stress appears to rise first and then will trend, indicating that the flow field pressure is not related, as the previous analysis is mainly related to the displacement limit.
Stress distribution pattern
The pattern of stress changes is shown in Figure 12, where it can be seen that the stress values of both the turbine and the reactor decrease as the speed ratio increases. The stress value of the turbine at speed ratio 1 is greater than at speed ratio 0.9, because the turbine is not only subjected to the flow field pressure, but also the increasing centrifugal load. At high speed ratios the flow field pressure decreases while the centrifugal stresses increase, and the interaction between the two factors causes the stress values to fluctuate. The pump stress values are generally small and show a tendency to increase and then decrease. Because the pump is connected to the flywheel, but also to the related parts of the take-off gear. So the displacement restrictions are high, which resulting in small overall stress values.
Stress analysis at different speed ratios: (a) turbine stress with different speed ratio, (b) reactor stress with different speed ratio and (c) pump stress with different speed ratio.
Deformation distribution pattern
The variation pattern of deformation is shown in Figure 13. Larger deformation occurs at the turbine blade outer ring inlet under braking conditions. And the reactor has a higher deformation of the inner ring due to the constraint of the outer ring. The larger deformation area is at the connection between the pump blade outlet and the inner and outer rings, while the deformation amounts at the pump blade inlet and the connection between the pump hub and the casing are lower.
deformation analysis at different speed ratios: (a) turbine deformation with different speed ratio, (b) reactor deformation with different speed ratio and (c) pump deformation with different speed ratio.
Analysis of other factors
Different input speeds of pump
Comparing the flow field pressures at different input speeds of the pump, the results are shown in Figure 14(a). It can be seen that as the input speed of the pump increases, the flow field pressure increases compared to the previous one, and the output torque of the torque converter increases as well. Stress and deformation of the impeller are similarly high, and there is a linear relationship between the three. This indicates that the input speed of the pump is the most influential factor, and when calibrating the strength and stiffness of the torque converter, it is necessary to match the target engine to determine the pump speed, and then carry out fluid-solid coupling process about it.

(a) Deformation analysis at different input speeds and (b) deformation at different impeller configurations.
Different impeller structures
According to the mechanical theory, it is known that the stress is mainly related to the structure of the impeller. Due to the thin design thickness of the pump vane head, the maximum stress occurs at the outlet where the vane is connected to the inner ring. The turbine is subjected to a large torque as an output component, and the maximum stress appears at the connection between the vane and the shaft hub at the outlet. The maximum stress on the reactor occurs midway between the suction surface of the vane and the inner ring connection. That has been shown in Figure 14(b).
Conclusion
Two different flow field extraction methods are used in this paper for the torque converter with lock-up clutch. Scheme A researched the internal flow field of the torque converter, while scheme B researched the auxiliary fluid and the internal flow field of the torque converter. CFD simulation method were carried out for both schemes, and the results have showed that the flow field pressure values in the torque converter were lower than without the addition of the auxiliary chamber fluid. The dynamic characteristics of the torque converter were also experimented, and the CFD simulation results in scheme B were closer to the experiment data.
Flow-solid coupling simulations about flow field pressures has shown that the stresses and deformations in the pump and reactor are close in two different schemes. The pressure of the auxiliary cavity flow field is applied at the back of the turbine in scheme B, and its maximum stress value has a large decrease comparing to scheme A. Due to the limitations of the assembly structure, the maximum stresses in the turbine generally occur at the output shaft hub while the maximum deformation occurs at the outer ring or vane at the turbine inlet. The maximum stresses in the reactor occur at the connection between the blades with the inner and outer rings, when the maximum deformation occurring at the inner ring. The pump’s stress and deformation values are lower with the maximum stress and maximum deformation at the blade exit.
Predicted stress value for the turbine too large will affect the structural design of the shaft hub, and deformation’s prediction of outer ring too large will affect the control of the lock-up clutch which locate in the auxiliary chamber. The results showed that auxiliary chamber fluids cannot be neglected in the design of the torque converter. The factors affecting impeller’s stresses and deformation were also analysis and the specific findings are shown below:
The stresses and deformations of the turbine and reactor decrease as the speed ratio increases in the same input speed, but the turbine having greater stresses and deformations than the other two impellers. The pump has more displacement restrictions as a power input component. So the values of stress and deformation are smaller. The stresses has tendency to increase and then decrease with the speed ratio.
The stresses and deformations in the impeller increase as the input speed of the pump increases, and there is a linear relationship between them. When calibrating the strength of a torque converter, it is necessary to firstly match the target engine to the pump’s speed.
Impeller’s stresses are mainly related to the structure. Process measures can significantly reduce structural stresses, such as adding rounded corners at locations where higher stresses are likely to occur.
Footnotes
Handling Editor: Chenhui Liang
Declaration of conflicting interests
The author(s) declared no potential conflicts of interest with respect to the research, authorship, and/or publication of this article.
Funding
The author(s) disclosed receipt of the following financial support for the research, authorship, and/or publication of this article: This work has been funded by the National Natural Science Foundation of China (NSFC) under Grant No. 51575220.