
Abstract
In this work, laser powder bed fusion (LPBF) technology was used to fabricate pure nickel components, and the densification behavior and microstructure of pure nickel with different energy densities were investigated. The results indicate that for LPBF-fabricated pure nickel components, the relative density reaches a peak of 98.76% at an energy density of 101 J/mm3. With the increase of energy density, a large number of pores appear inside the grains, and the grains grow epitaxially along the building direction within multiple molten pools, pores gradually disappear after undergoing remelting at the edges of the melting tracks. Among these, competitive inward growth of columnar crystals may be the main cause of dislocations and new grain generation. The grains are primarily distributed along the Ni (111) or Ni (110) orientations, and with the increase of energy density, the grains with these two orientations increase. The surface energy follows the sequence of Ni (220) > Ni (200) > Ni (111). Due to the stacking of the <101> oriented main layer and the <001> oriented sub-layer in the building direction, the sample with higher energy density exhibits a strong Ni {110} texture, accompanied by increased tensile properties.
Introduction
As a transition metal with excellent mechanical properties, corrosion resistance, high electrical conductivity, good magnetic and high-temperature stability, pure nickel is widely used in battery modules, nuclear materials, alkali making industry, and military industry. 1 However, with increasing geometrical complexity, production using conventional manufacturing processes becomes exceedingly time and energy consuming. 2 Therefore, laser powder bed fusion (LPBF), also known as selective laser melting (SLM), as one of the additive manufacturing (AM) technology, has received a lot of attention due to its ability to produce complex-shaped components, high manufacturing efficiency, and high material utilization. 3 LPBF is a novel method for manufacturing components directly from digital models by layer-by-layer material accumulation. 4 It involves using a computer-controlled laser beam to melt the selected areas of the powder bed, creating near-net-shaping components. 5
Despite the capabilities of the LPBF process in design freedom, it still faces challenges such as difficulties in controlling the shaping process, low accuracy, and the defects like pores, cracks, and deformations. 6 These issues are closely related to surface tension gradients, thermal capillarity, and bubble movement during the shaping process, ultimately significantly affecting the quality, performance, and safety of the formed parts. 7 Therefore, to optimize components performance, it is essential to exercise the precise control over some key parameters, such as laser power, scanning velocity, hatching spacing, and powder layer thickness. 8 Leung et al. 9 found that with the increase in laser power, the wetting ability of the molten pool improves, as the scanning velocity increases, the continuous melting track change to interrupted hemi-cylindrical melting track and a series of independent molten beads forms. Shrestha et al. 10 found that the influence of laser power on the number, volume, and depth of pores is greater than the scanning velocity. Within a certain range, the number and volume of pores increase with increasing laser power at the same line energy density. Moussaoui et al. 11 observed that increasing the scanning velocity and laser power leads to larger roughness, while the hatching spacing has no decisive effect on roughness. Qiu et al. 12 discovered that high laser power and low powder layer thickness result in products with low porosity, an increase in powder layer thickness leads to a rapid increase in porosity level and surface roughness. However, these parameters are interrelated and it is difficult to obtain high-quality samples through a single parameter control. The energy density per unit volume (E) is a comprehensive parameter that simultaneously characterizes the effects of laser power (P), scanning velocity (V), hatching spacing (h), and powder layer thickness (d). Its calculation formula is as follows13,14:

Although previous literature has primarily focused on investigating the effects of laser power and scanning velocity on the fabrication of pure nickel components, they have not explored the impact of volumetric laser energy density (E) on LPBF fabrication. Therefore, in this study, pure nickel powder was used as raw material to explore the optimum process parameters for LPBF pure nickel components and the relationship between different energy densities and sample densification, microstructure, and microhardness was investigated.
Experiments
In this study, spherical pure nickel powder produced through gas atomization with an average particle size of approximately 31.25 μm was used, as shown in Figure 1(a) and (b). LPBF experiments were conducted on BLT_S210 machine (BLT, Inc, China) equipped with a 500 W fiber laser with a focused laser beam diameter of 100 μm. During the sample preparation process, high-purity argon was used as the protective atmosphere with oxygen content less than 100 ppm. Additionally, the 316L stainless steel substrate was preheated to 375 K, and the scanning direction between layers was rotated counterclockwise by 67° (as shown in Figure 1(c)). Samples with dimensions of 10 × 10 × 7.5 mm were prepared using laser power (P) of 200–300 W, scanning velocity (V) of 700–1100 mm/s, and hatching spacing (h) of 0.09–0.13 mm, while the powder layer thickness (d) was kept constant at 0.03 mm.

Characteristics of pure nickel powder: (a) morphology, (b) particle size distribution, and (c) schematic representation of the scan strategy and wire cutting.
The relative density (D) of each sample was measured by Archimedes’ method and expressed as a percentage of the density of pure Ni (8.9 g/mm3). 15 The samples were cut by wire cutting along the building direction BD (XZ plane) and transverse direction TD (XY plane) into 2 mm thick specimens (Red and blue dotted line respectively in Figure 1(c)), then polished following standard metallographic procedures. The specimens were etched in a solution of H2O: HNO3: CH3COOH = 3:7:21 for 1–2 min with agitation. The microstructure was analyzed using a FEI Quanta FEG 250 field-emission gun scanning electron microscope (FEG-SEM). Phase identification of the samples was performed using a D/mark2500pc X-ray diffractometer (XRD) in the 2θ range of 40°–100°. The textures formed in the specimens were analyzed by electron backscatter diffraction (EBSD, EDAX TSL) patterns in the SEM with a measurement step size of 1 μm. Tensile tests were conducted in a vacuum at room temperature with an initial strain rate of 0.06 mm/min. The test was conducted three times for each condition, and the results were averaged. The fracture surfaces were examined using the FEG-SEM.
Results and discussion
Densification behavior
Figure 2(a) shows the effect of energy density on the relative density (D) of LPBF processed pure Ni samples, where the experiment was repeated three times in different energy densities. To further investigate the impact of energy density, three typical samples (A, B, and C) located at three different stages on the curve were selected (as marked by black arrows in Figure 2(a)). The parameters for these three specimens are as follows: Sample A (P = 200 W, V = 900 mm/s, E = 82.3 J/mm3, D = 96.86%), Sample B (P = 300 W, V = 1100 mm/s, E = 101 J/mm3, D = 98.76%), Sample C (P = 300 W, V = 900 mm/s, E = 123.5 J/mm3, D = 97.68%). The hatching spacing (h) and powder layer thickness (d) are 0.09 mm and 0.03 mm, respectively.

(a) Relative density of the pure Ni samples processed by LPBF at various energy densities and (b–d) microstructure of samples A, B, and C in XY planes.
Figure 2(b) to (d) shows microstructure of samples A, B, and C in XY planes. Upon observation, it is found that at low energy densities, irregular holes and cracks form inside the samples A due to insufficient melting of the pre-laid powder by the laser beam. Additionally, the generation of balling effects is detrimental to interlayer bonding and tends to affect the densification behavior during LPBF, ultimately resulting in a relatively low sample density.16,17 As the energy density increases, the expansion of the remelting zone effectively eliminates holes and cracks, sample B ultimately achieves localized densification and reducing surface roughness.9,18 The relative density reaches its peak of 98.76% at an energy density of 101 J/mm3. Excessive energy density will lead to spattering of molten metal, retention of metal vapor, and the generation of keyholes. 19 Due to the high energy laser beam melts the metal powder, the recoil force of the melt overcomes surface tension, forming high-speed flowing metal liquid. However, the surface tension resists the compressive action of the recoil force, resulting in depressions and material splattering. 20 The input of excessive energy will cause metal vaporization effects and these unstable voids are captured during solidification to form keyholes, thus reducing the relative density of the sample C.21,22
Microscopic structure
Melting track
The influence of different energy densities on the quality of LPBF-treated components is shown in Figure 3 from the XZ and XY planes. In sample A, the melting tracks are discontinuous and irregular, with a significant presence of pores and cracks at the boundaries of the melting tracks (as shown by the arrows and dashed lines in Figure 3(a) and (d)). As the energy density increases, the melting tracks of Sample B become progressively continuous and smooth, and defects such as pores and cracks disappear, leading to an improvement in the quality of the formed samples. In the XY plane, the sample undergoes layer-by-layer stacking, eventually forming crossed stripes with 67° (as shown by the arrows and dashed lines in Figure 3(b) and (e)). However, further increasing the energy density aggravates disturbance in the molten pool, leading to a fracture in the grain epitaxially growth direction in sample C (as shown by the arrows in Figure 3(c)). In XY plane, sample C exhibits regular circular holes (as shown by the arrow in Figure 3(f)), which originate from pores in the powder, 23 argon bubbles entrapped by the molten pool depression collapse, 20 or vapor columns formed by inverse Bremsstrahlung radiation effects, 19 and then these cavities fracture into small holes under the driving force of Marangoni convection. 9

Microstructure of samples at different energy densities: (a–c) XZ planes of samples A, B, and C and (d–f) XY planes of samples A, B, and C.
Based on the observations of Figure 3, the schematic diagrams of melting tracks with different energy densities are depicted, as shown in Figure 4. When energy density is 82.3 J/mm3, the melting track is uneven, accompanied by a multitude of irregular holes. With the increase of the energy density, when the energy density reached 101 J/mm3, the melting tracks become regular, and holes are eliminated, the molten pool surface is smooth without obvious defects, resulting in the sample had the best forming quality. When the energy density reaches 123.5 J/mm3, numerous finer grains appear within the melting tracks, accompanied by circular holes.

Diagram of the melting tracks under different energy densities.
Grain morphology
Further observation of XZ and XY planes of the LPBF processed samples is shown in Figure 5. In XZ planes, the grains epitaxially grow inside of multiple molten pools, with the growth direction basically consistent with the building direction (as shown by the dotted lines in Figure 5(a)–(c)). However, at the edge of the molten pool, the columnar crystals grow inward perpendicular to the molten pool boundary and gradually transform toward the building direction (as shown by the dotted lines in Figure 5(b)). Due to the symmetrical flow of liquid metal, after a brief scan of the laser beam, there is a large temperature gradient at the bottom of the symmetrical axis, which causes the columnar crystals at the center of the molten pool to preferentially grow upward along the building direction, subsequently, the edge columnar crystals transform toward the building direction after extrusion.22,24 With increasing energy density, the disturbance in the molten pool intensifies, and a significant amount of heat is transferred to the substrate. Due to the recirculation of molten metal, the lateral migration of the solid/liquid interface gradually dominates at the bottom of the molten pool, and heat is transferred laterally along the molten pool boundary, leading to the change of columnar crystal growth direction, and intensifies as energy density increases (as shown by the yellow arrows in Figure 5(a) and (c)).25,26

Microstructure of samples under different process parameters: (a–c) XZ planes of samples A, B and C, C21 and C31 and (d–f) XY planes of samples A, B, and C.
In XY planes, as the energy density increases, the pores inside the grains gradually disappear after remelting through the melting track edge, but the grain boundaries still exist (as shown by the yellow arrows in Figure 5(d)–(f)). The generation of circular pores may be attributed to the 3%–5% solidification shrinkage during the cooling process of the melting track. 9 As the solid/liquid interface typically migrates toward the building direction, columnar crystals grow against the temperature gradient, leading to the formation of dislocations within the crystals due to thermal stress, and pores grow between the columnar crystals. 26 The phenomenon of pore generation-elimination seems to indicate that lower energy input favors local densification, while grain recrystallization requires higher energy.27,28
To further investigate the relationship between grains and pores, Figure 6 shows the microscopic morphology of grains and pores at different energy densities. It can be observed that in sample A, the growth direction of columnar grains is basically consistent with the building direction (BD). However, due to variations in growth direction and rate, the crystals will mutually squeeze (as shown by the arrow in Figure 6(a)). A number of pores appear inside the originally well-formed grains, and some pores even exist at distinct grain boundaries (as shown by the arrow in Figure 6(d)), the pores may potentially facilitate the formation of grain boundaries (GBs). 22 With the increase of energy density, the direction of grain boundaries, crystals, and pores in sample B seems to be consistent (as shown in Figure 6(b)). The columnar crystals in the XZ plane seem to tilt, and pores appear between the crystals (as shown in Figure 6(e)), see the red dotted area in Figure 5(e) for details. LPBF is a layer-by-layer printing and stacking process, where the second melting track (MT2) partially remelts the surface of MT1. Leung et al. 9 calculated the average pore velocity and concluded that the liquid metal flow velocity in MT2 is three times of that in MT1, thus the increase in molten pool depth causes a transformation of the crystal orientation in the MT2 layer toward the scanning direction. With further increase in energy density, more pores are present in sample C. Additionally, remelting facilitates the elimination of pores, leading to regional densification (as shown by the yellow dotted line in Figure 6(f)).

Microscopic morphology of grains and pores at different energy densities: (a–c) XZ planes of samples A, B, and C and (d–f) XY planes of sample A, B, and C.
Further EBSD characterization was performed on the microstructure of the XZ plane for sample B, and the results are shown in Figure 7. Due to the Gaussian distribution of the energy density, the solid/liquid interface moves toward the bottom of the molten pool. The columnar crystals grow competitively inward perpendicular to the molten pool boundaries, due to differing growth directions and rates, significant boundary stresses arise, resulting in the generation of numerous dislocations.22,29 Observing Figure 7(b) and (c), as columnar crystals grow, LAGBs form when the growth fronts of these crystals intersect at the centerline (as shown by point A in Figure 7(c)), which is also reported by Jodi et al. 30 However, localized thermal non-uniformities lead to non-equilibrium solidification, with thermal stresses concentrating at the centerline of high thermal gradients, which may eventually result in the fragmentation of local grains, thus leading to a higher density of dislocations at the molten pool center (as shown by point B in Figure 7(c)). 31 Due to the grain extrusion, low-angle boundary segments are formed near the centerline, characterized by abrupt disorientation changes. This indicates that dislocation rearrangement happened accompanying the deformation. 32 Further, the line vector misorientations (as shown by gradient-colored arrow in Figure 7(a) and (b)) reveal that the point-to-origin misorientations are fluctuant, with a misorientation of 41.8° present at the molten pool center, while the orientations of both sides of the central grain are essentially consistent (as shown in Figure 7(d)). Therefore, the formation of HAGBs or new grains may differ from the mechanism of the continuous dynamic recrystallization (CDRX), as shown in Figure 7(d).33,34 Instead, grains at the molten pool center exhibit dominance during growth, while the non-equilibrium growth of the edge grains extrudes the already formed grains at the centerline, leads to the generation of significant thermal stresses. Ultimately, this process results in the formation of dislocations and new grains.24,26

(a–c) IQ map, IPF map, and KAM map of Sample B XZ-plane, respectively and (d) the line vector misorientations were obtained from the gradient-colored arrows shown in (a) and (b).
Schematic diagrams of crystal growth under different energy densities are shown in Figure 8. At lower energy densities, the curvature at the bottom of the molten pool is low, and the columnar crystals grow inward after remelting and gradually change to the building direction. As the energy density increases, the thermal gradient and growth rate of columnar crystals are enhanced. The edge columnar crystals squeeze the preferential grown columnar crystals in the molten pool center, leading to the formation of numerous dislocations. The transfer of a large amount of heat causes the substrate columnar crystals to shift to the scanning direction. The pores grown along the columnar crystals inside the grains gradually disappear after remelting at the melting track edge, but the grain boundaries still exist.

Schematic diagram of crystal growth under different energy densities.
Grain orientation
Due to the layer-by-layer manufacturing approach in additive manufacturing, the microstructure growth of pure Ni prepared by laser powder bed fusion (LPBF) differs from traditional processing methods. X-ray Diffraction (XRD) was employed to examine the phase of the samples with different process parameters in the XZ and XY planes, the results are shown in Figure 9. In these samples, diffraction peaks corresponding to the face-centered cubic (FCC) Ni phase were clearly detected. The XRD patterns show that the grains are preferentially oriented along Ni (111) and Ni (220) on the XZ planes and XY planes, respectively. As the energy density changes, the position of FCC Ni peaks varies with the LPBF conditions. Therefore, by comparing the Ni (111), Ni (200), and Ni (220) of the samples with untreated pure Ni powder, it is observed that when the energy density is 82.3 J/mm3, sample A is essentially polycrystalline-like microstructure (PCM) with a weak {111} texture. The diffraction peaks in the XZ plane are shifted to higher angles, while the diffraction peaks in the XY planes showed minimal differences (blue lines in Figure 9). 25 According to the Bragg’s equation:


(a) For different process parameters of LPBF, XRD profiles of pure nickel samples on different planes. (b–d) Manificaiton of (111), (200) and (220) diffraction peaks, respectively.
An increase in 2θ value implies a reduction in the interplanar distance (d). 35 This is because the thermal expansion behavior leads to lattice distortion, resulting in residual internal stresses within the crystal. The formation of residual internal stresses is related to the non-equilibrium solidification caused by the relatively high cooling rate during the forming process. To release these residual stresses, the lattice dimensions decrease accordingly.36,37
When the energy density is 101 J/mm3, the increase in energy density leads to a transition of the molten pool from conduction mode to keyhole mode, accompanied by a change in the direction of heat transfer.19,26 In conduction mode, the migration of the solid/liquid interface typically occurs toward the building direction, with the thermal gradient parallel to the building direction. 25 In keyhole mode, lateral migration of the solid/liquid interface may hinder <001>//BD orientation crystals, resulting in a single-crystalline-like {220} texture (green lines in Figure 9). 26 This transition from polycrystalline-like microstructure to single-crystalline-like microstructure leads to rearrangement of crystals and a change in the thermal gradient direction, resulting in sample B having interplanar distance consistent with untreated powder. Therefore, compared to sample A, the interplanar distance in the XZ plane of sample B increases. However, with little difference in interplanar spacing in the XY plane, the preferred grain orientation shifts to Ni (220).
When the energy density is further increased to 123.5 J/mm3, sample C in keyhole mode exhibits a strong {220} texture, thus the enhancement of Miller indices in the crystal structure results in a smaller interplanar spacing in sample C compared to sample B (red lines in Figure 9). Since the minimization of surface energy is considered to be the primary driving force for grain growth and related texture evolution,38–40 grains in the XZ plane are predominantly oriented along Ni (111), followed by Ni (200). In the XY plane, with the increase in energy density, the Ni (220) diffraction peak gradually becomes dominant, while the intensity of the Ni (111) and Ni (200) diffraction peak becomes negligible. Therefore, the surface energy follows the sequence of Ni (220) > Ni (200) > Ni (111), which is consistent with the findings of Han et al. 41
To further analyze the relationship of grain growth directions, and due to bad corrosion effect of Sample A, as a result samples B and C were further characterized by SEM-EBSD (as shown in Figure 10). With increasing energy density, the Ni (111) and Ni (110) diffraction peaks on the XZ and XY planes are significantly enhanced. The corresponding pole figures (as shown in Figure 10(m)–(p)) also confirm the enhanced Ni {111} and Ni {110} textures. In addition, due to the stacking of <101> oriented main layers and <001> oriented sub-layers along the building direction, sample C exhibits a strong Ni {110} texture in the XY plane (as shown in Figure 10(h) and (p)). Han et al. 41 found that the formation of {110} texture originates fundamentally from the grain yielding anisotropy of Ni. Among them, the molten pool boundaries are more obvious on the XZ planes, and the grains epitaxially grow inside of multiple molten pools. It has been reported that epitaxial growth is the primary solidification behavior for many other FCC metals during LPBF processing.42,43 With the increase of the energy density, the arrangement of molten pools becomes disorderly in the XZ plane, and the directions of grain epitaxial growth were separated (as shown in Figure 10(a) and (b)). Due to the absence of nucleation barriers, the direction of grain epitaxial growth is determined by the thermal gradient and growth rate during solidification.44,45 As shown in Figure 10(e) and (f), no distinct fusion lines are observed in the IPF maps, which indicates that the continuously grown grains and the matrix grains have the same crystal structure and orientation. Therefore, the grains can grow epitaxially at the metal solid/liquid interface. When the energy density is 123.5 J/mm3, the thermal stress on the XY plane increases significantly, and a large number of high angle grain boundaries (HAGBs) appear at the centers of the molten pools and at the intersections of melting tracks on the XY plane (as shown by the black lines in Figure 10(i)–(l)). In the LPBF process, near-rapid solidification involves high cooling rates, and thermal stress primarily dissipates through dislocations, with a high density of dislocations potentially inducing recrystallization.29,46

(a, b) IQ maps of the sample B and C on XZ planes, (c, d) IQ maps of the sample B and C on XY planes, (e–l) corresponding IPF, KAM maps, (m, n) {111} pole figures of the sample B and C on XZ planes, and (o, p) {110} pole figures of the sample B and C on XY planes.
Grain size
To further investigate grain size and distribution, grain size distribution diagrams for samples B and C on the XZ and XY planes were derived based on HAGBs measurements as shown in Figure 11. By examining the IPF maps, the columnar grains with cellular microstructures of identical orientations grow across multiple molten pools in the XZ plane (as shown in Figure 10(e) and (f)), resulting in the formation of more large grains in samples B and C. The average grain size in the XZ plane for sample B is 67.95 μm (as shown in Figure 11(a)). Due to the relatively high energy density of Sample C, the improvements in wettability will lead to the crystal growing epitaxially across multiple molten pools. 44 As a result, the average grain size in the XZ plane increases to 80.53 μm (as shown in Figure 11(c)). In the XY plane, high angle grain boundaries at the center of the melting tracks form a crystal grid resembling a parallelogram after intersecting (as shown in Figure 10(g) and (h)). Larger grains are not formed in samples (Figure 11(b) and (d)), thus the average grain sizes of samples B and C are similar, measuring 47.96 and 48.81 μm respectively. 47

(a, b) Grain size diagrams of the sample B and C on XZ planes and (c, d) grain size diagrams of the sample B and C on XY planes.
Tensile properties
Figure 12 illustrates the tensile true stress–true strain curves of samples A, B, and C in different stretching directions, details are shown in Table 1. Observations reveal that sample A exhibits poor tensile properties due to the presence of numerous holes and cracks. According to the Gibson-Ashby model, the higher porosity will lead to a reduction in yield strength, resulting in lower tensile performance. 3 With increasing energy density, the samples B and C both exhibit higher relative density, leading to a significant improvement in yield strength, ultimate tensile strength, and elongation of the samples. Additionally, the grain size in sample C is larger than that in sample B, and according to the Hall-Petch relationship, an increase in grain size predicts a decrease in yield strength. However, as reported, strong texture formation can alter this relationship, resulting in higher yield strength along the building direction.48,49 Therefore, sample C has a higher tensile performance compared to sample B. In addition, compared to the XZ plane, Sample B and C XY plane has smaller grain size. Due to issues like poor interlayer overlap and bonding in LPBF, compared to the tensile direction parallel to the building direction, the mechanical performance tends to be generally higher when the tensile direction is perpendicular to the building direction.47,48

Tensile true stress–true strain curves of samples A, B, and C in different stretching directions.
Mechanical properties of the samples A, B, and C.

⊥BD: The stretching direction is perpendicular to the building direction; //BD: The stretching direction is parallel to the building direction; UTS: ultimate tensile strength.
The fracture mechanism is closely related to the microstructure of the material. To explore the influence of volume energy density on the fracture mechanism of pure nickel samples, the macroscopic fracture morphologies and microscopic morphologies of samples A, B, and C in different tensile directions are shown in Figure 13. Observation reveals that when the tensile direction is perpendicular to the building direction, the fracture surface of sample A is composed of shallow dimples and cleave planes, indicating a quasi-cleavage fracture mechanism. Sample B shows significant necking, with an area reduction exceeding 10%. The fracture morphology is mainly composed of high-density equiaxed shallow dimples, which absorb and disperse stress during the fracture process, indicative of a ductile fracture. 50 The fracture dimple size and depth increase in sample C, and revealing serpentine slippage, which occurs when metals undergo plastic deformation along certain crystallographic planes and directions under external loading. Sample C demonstrates ductile fracture with high plasticity similarly.
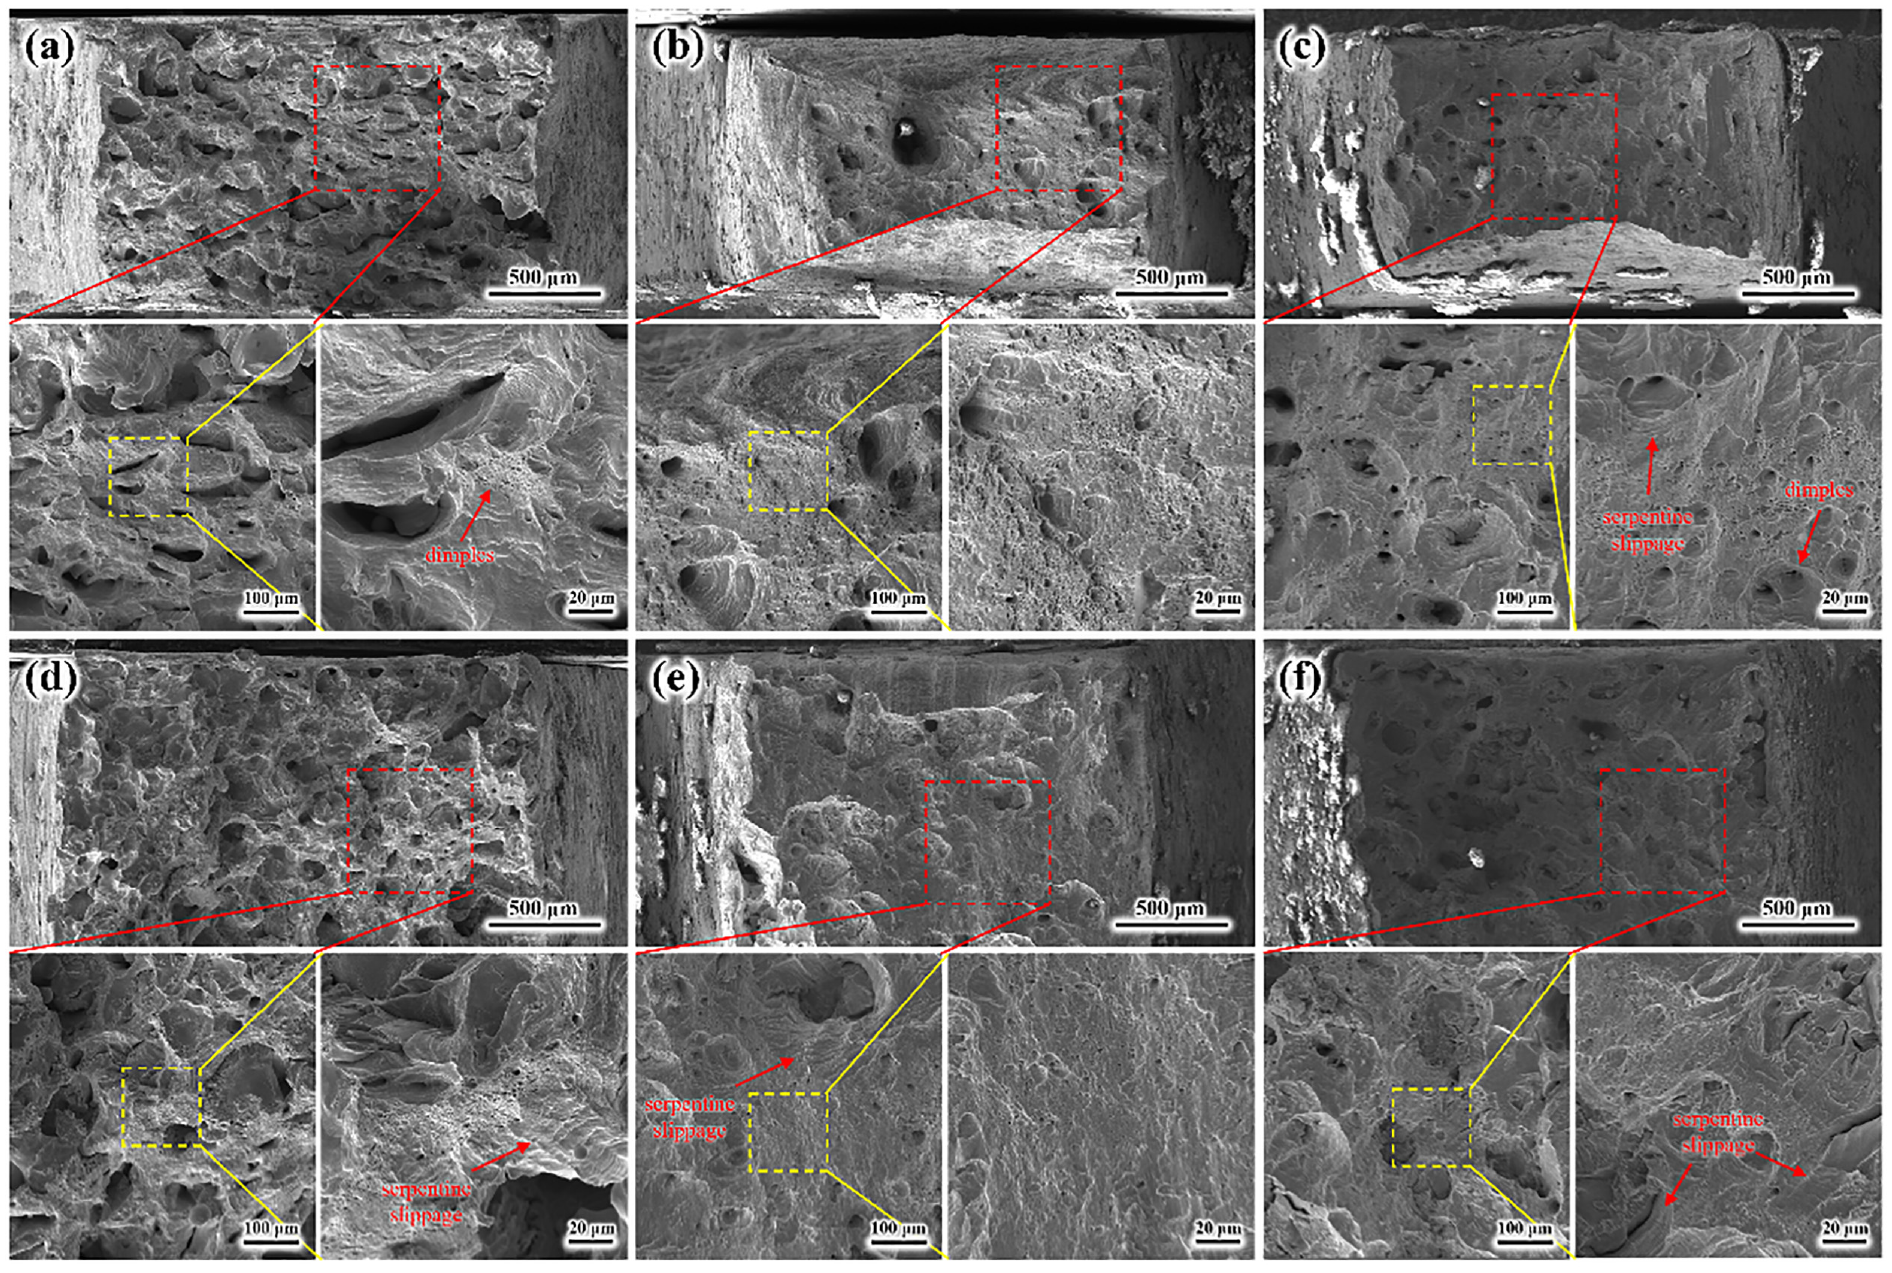
(a–c)The microscopic fracture morphology perpendicular to the building direction for samples A, B and C. (d–f) The microscopic fracture morphology parallel to the building direction for samples A, B and C.
When the tensile direction is parallel to the build direction, the fracture for sample A exhibits a significant number of holes, which result from the growth and accumulation of pores defects near the fracture surface after applying tension. The presence of these holes is detrimental to the strength and plasticity of the sample. 51 The fracture surfaces of samples B and C also consist of numerous dimples, indicating an improvement in plasticity. Additionally, all samples show a considerable amount of serpentine slippage on the fracture surfaces. This may contribute to the generally higher tensile performance of the samples when the tensile direction is perpendicular to the build direction compared to when it is parallel.
Conclusion
In this study, by controlling the energy density of laser powder bed fusion (LPBF), the densification behavior, microstructure, and phase identification of pure nickel samples were investigated. The conclusions are as follows:
(1) In this experiment, the optimal energy density for LPBF pure nickel is 101 J/mm3. The relative density of 98.76% is obtained by using the optimum LPBF parameters (P = 300 W, V = 1100 mm/s, h = 0.09 mm, d = 0.03 mm).
(2) With the increase in energy density E, the melting tracks transition from intermittent and shallow to smooth and regular, effectively reducing irregular holes and cracks. Excessive energy density is likely to cause overheating of the molten pool and evaporation phenomena. Melting tracks overlap due to bead fusion, leading to the formation of melting cladding layers. Additionally, columnar crystals gradually grow laterally along the molten pool boundaries. Among these, competitive inward growth of columnar crystals may be the main cause of dislocations and new grain generation.
(3) On the XZ and XY planes, the grains preferentially distribute along the Ni (111) and Ni (220) orientations, respectively. Furthermore, the transition from Ni (111) to Ni (220) may be related to the increase of energy density. With increasing energy density, the grains with Ni (111) and Ni (220) orientations increase significantly. Due to the stacking of the <101> oriented main layer and the <001> oriented sub-layer in the building direction, the XY plane of sample with higher energy density exhibits a strong Ni {110} texture.
(4) Lower energy density results in lower tensile performance. With the increase in energy density, yield strength, ultimate tensile strength, and elongation all show significant improvement. Generally, mechanical performance is higher when the tensile direction is perpendicular to the building direction as opposed to being parallel. The tensile fracture mechanism at low energy density is a quasi-cleavage fracture. As the energy density increases, the fracture surfaces of the samples consisted of more dimples, indicating an improvement in plasticity.
Footnotes
Handling Editor: Chenhui Liang
Declaration of conflicting interests
The author(s) declared no potential conflicts of interest with respect to the research, authorship, and/or publication of this article.
Funding
The author(s) disclosed receipt of the following financial support for the research, authorship, and/or publication of this article: This work was supported by the National Natural Science Foundation of China [Grant No. 52175129, 52171066], Outstanding Youth Foundation of Hunan Province [Grant No. 2023JJ20041], the science and technology innovation Program of Hunan Province [2023RC3241], and Research Foundation of Education Bureau of Hunan Province [Grant No. 22A0216].
Data availability
The datasets generated and/or analyzed during the current study are available from the corresponding author on reasonable request.