
Abstract
Laser powder bed fusion additive manufacturing of superalloys has received increasing attention in these years. In this article, the influence of parameters of laser powder bed fusion on mechanical properties and microstructures of nickel-based superalloy GH536 was investigated. Influence of laser power, scanning speed, hatch space and building direction on mechanical properties was discussed, and the optimal parameters were obtained. The relative density of samples fabricated by laser powder bed fusion could be as high as 99.5%. The processing window of laser energy density with 8.56 × 10⁴–1.15 × 10⁵ J/cm3 should be employed to make sure that the relative density is higher than 98%. The ultimate tensile strength and yield stress of GH536 sample made by laser powder bed fusion were 950 and 606 MPa, respectively, which were superior to samples with the tensile strength of 767 MPa and yield strength of 379 MPa prepared by traditional hot forging method. The hardness of the sample could reach 316.8 HV.
Keywords
Introduction
Laser powder bed fusion (L-PBF) additive manufacturing is a widely used three-dimensional (3D) printing technology for processing of metal materials. With L-PBF technology, the metal powder can be completely melted by the laser to form any complex shaped parts with high density and excellent mechanical properties. However, many defects such as microcracks, voids, porosities and high inner stress are prone to occur during the forming process if the improper parameters are used.1–3 So, it is critical to study the influence of the processing parameters of L-PBF on the mechanical properties and microstructures to prevent the defects mentioned above. During fabrication, many processing parameters of L-PBF—such as laser power, hatch space, scanning speed and layer thickness—have significant impact on the mechanical properties and microstructures of formed parts.4,5 Song et al. 6 found that the increase of laser power and the decrease of scanning speed will result in size increase of crystal grains and molten pool. Tonelli et al. 7 studied the effect of laser energy density on the microstructure, surface morphology and hardness of Co-28Cr-6Mo alloy. They found that if the laser energy density was too low, porosity content was too high and poor mechanical properties were induced. However, if the laser energy density was too high, micro-sized porosities appeared and the mechanical properties were also reduced. It is well known that defects of voids and porosity generated during the printing process have serious impact on the mechanical properties of the fabricated part. By optimizing the processing parameters, the voids and porosity can be significantly reduced and the parts with full density can be obtained. Mumtaz et al. 8 studied the L-PBF forming of the Waspaloy alloy and found that the density of the formed parts could reach 97% by optimizing the process parameters. However, it is still not easy to obtain parts with full density and the influence of processing parameters on mechanical properties and microstructures is worth further investigation.
GH536 is a kind of nickel-based superalloy with a high strength and good resistance to oxidation and corrosion at high temperature of 650–1000 °C. Currently, GH536 is widely used to manufacture aero-engine combustor components, long-term used components below 900 °C and short-term used components around 1080 °C.9–11 Presently, some studies of fabrication of GH536 parts using L-PBF have been carried out. Wang 12 studied the mechanical properties of GH536 superalloy prepared by the L-PBF. The results showed that the yield and ultimate tensile stress of the samples could reach 816 and 936 MPa, respectively, which were higher than those of hot forged samples with yield strength of 379 MPa and tensile strength of 767 MPa. However, most of current studies focused on the mechanical aspect and a comprehensive investigation of influence of processing parameters on the mechanical properties and microstructures is currently lacking.13,14 Besides, a reasonable range of laser energy density of L-PBF for GH536 is still blank.
This article studied the mechanical properties and microstructures of GH536 alloy parts processed with different L-PBF parameters. The influence of processing parameters on the mechanical properties, microstructures and fracture mode was studied. A reasonable laser energy density window for GH536 was also analyzed. This article is organized as follows. The testing materials and methods are introduced in section “Materials and methods.” Section “Results and discussion” discusses the influence of processing parameters on the mechanical properties and microstructures, and conclusions are made in section “Conclusion.”
Materials and methods
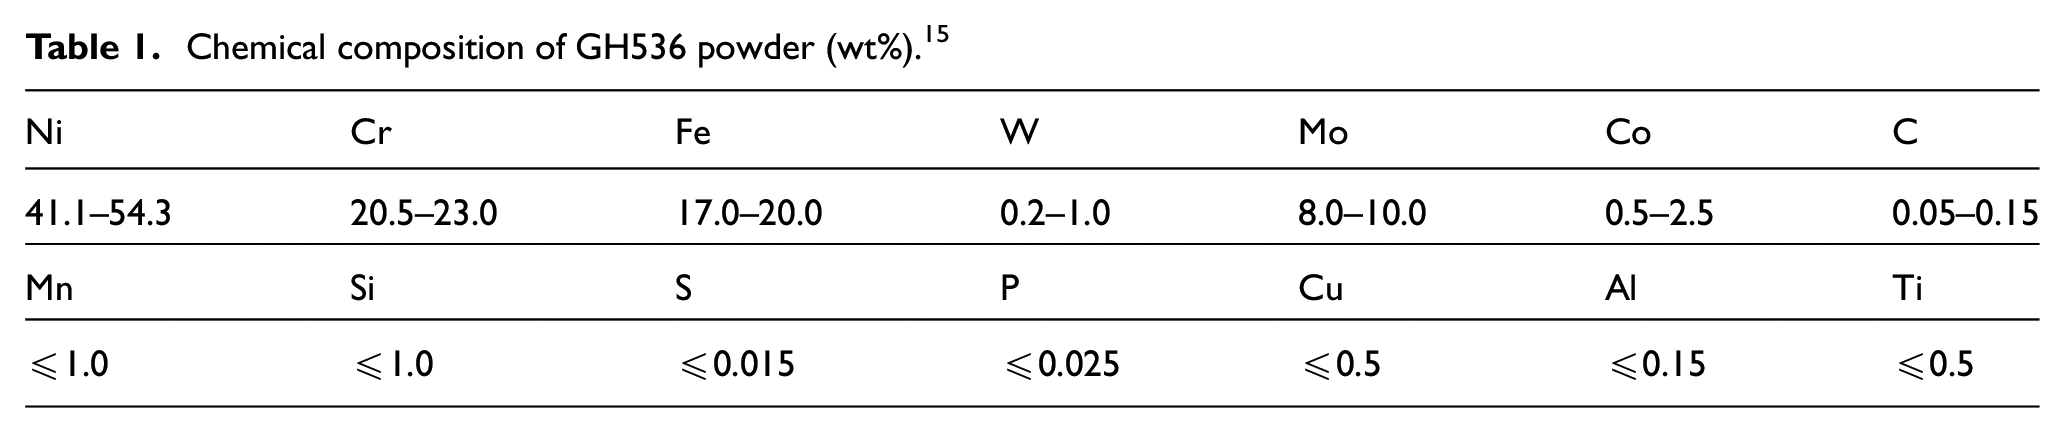
The experimental material of GH536 powder made by atomization method was provided by Feierkang Company. The powder was mainly in spherical shape shown in Figure 1. The powder particle size was measured by the laser particle size analyzer (Bettersize 2000). The particle size was ranged in 15–55 μm as shown in Figure 2. The chemical composition of the powder is listed in Table 1.
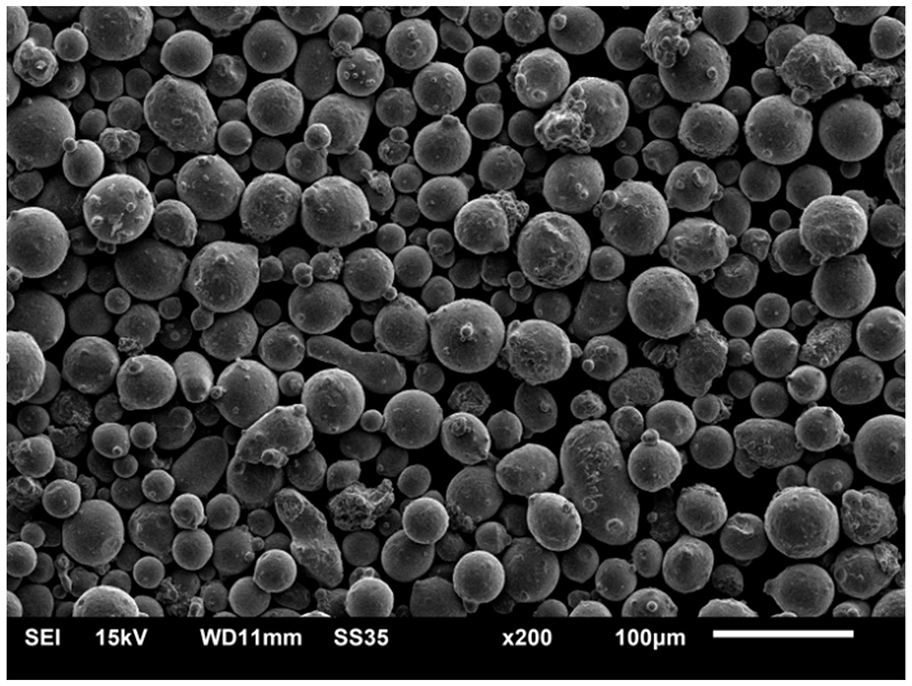
SEM image of GH536 powder.
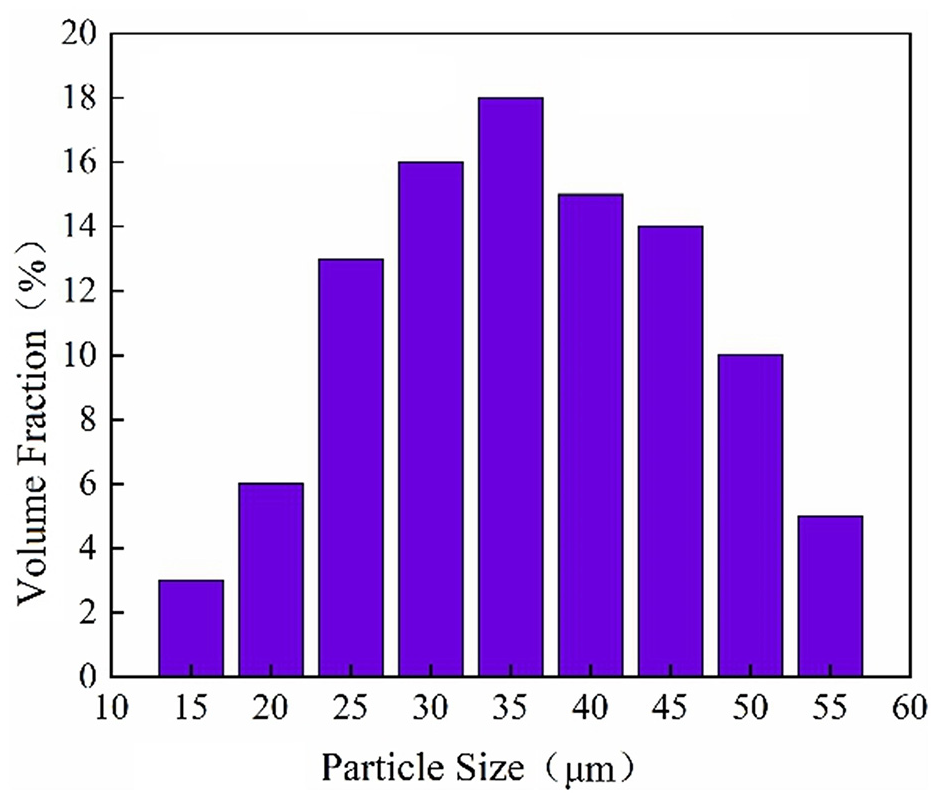
The particle size distribution of GH536 powder.
Chemical composition of GH536 powder (wt%). 15
In order to remove impurities such as water vapor, the powder was dried at 80 °C for 4 h in a vacuum drying oven manufactured by Shanghai Zengsen Instrument Technology Co., Ltd. The powder was processed by an L-PBF equipment of Renishaw AM250 produced by Ningbo Huashi Intelligent Technology Co., Ltd. The diameter of the laser spot is 135 μm. The 316L stainless steel substrate with thickness of 10 mm was used to prevent deformation of samples during printing process. In order to reduce the amount of experiments, the single factor experiment method was employed to study the influence of processing parameters on mechanical properties and microstructures. The processing parameters can be found in Table 2 by referring to the results of Li. 16 The processing chamber was filled with argon during the printing process to ensure that the material was not influenced by other gases such as oxygen.
L-PBF processing parameters of GH536 powder.
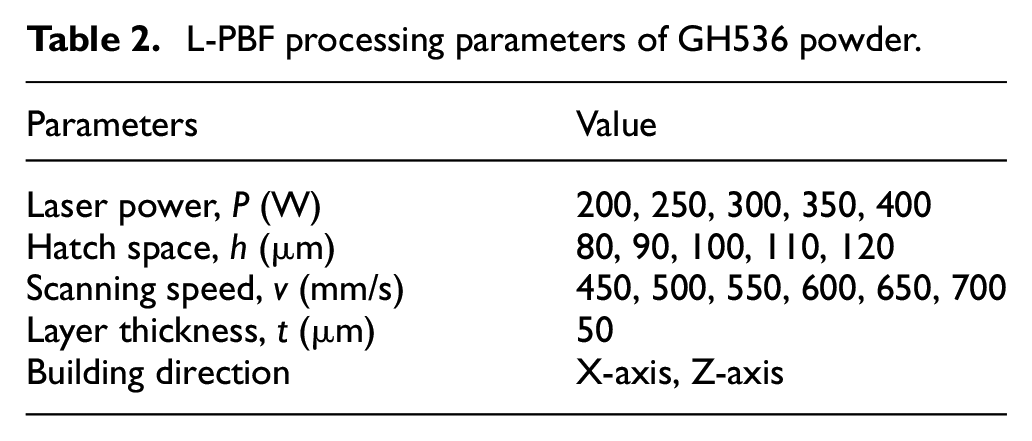
In L-PBF processing, the layer thickness is critical to the mechanical properties of the final parts. With small layer thickness, high inner stress will be induced due to high energy density. However, if the layer thickness is too big, particles will not be completely melted and lead to pores due to inadequate energy density. Generally, the layer thickness is set as 20–100 μm.17,18 In this study, the layer thickness is set as 50 μm based on large amount of experimental work in our lab.
In order to study the influence of building direction on the mechanical properties, two building directions along X-axis (parallel to the substrate plane) and Z-axis (perpendicular to the substrate plane) were employed. Figure 3(a) shows the geometric size of the samples and Figure 3(b) shows the image of samples prepared by L-PBF. The standard tensile bars shown in Figure 3(c) were machined from the above fabricated samples according to Chinese standard of GB/T 228.1-2010. 19
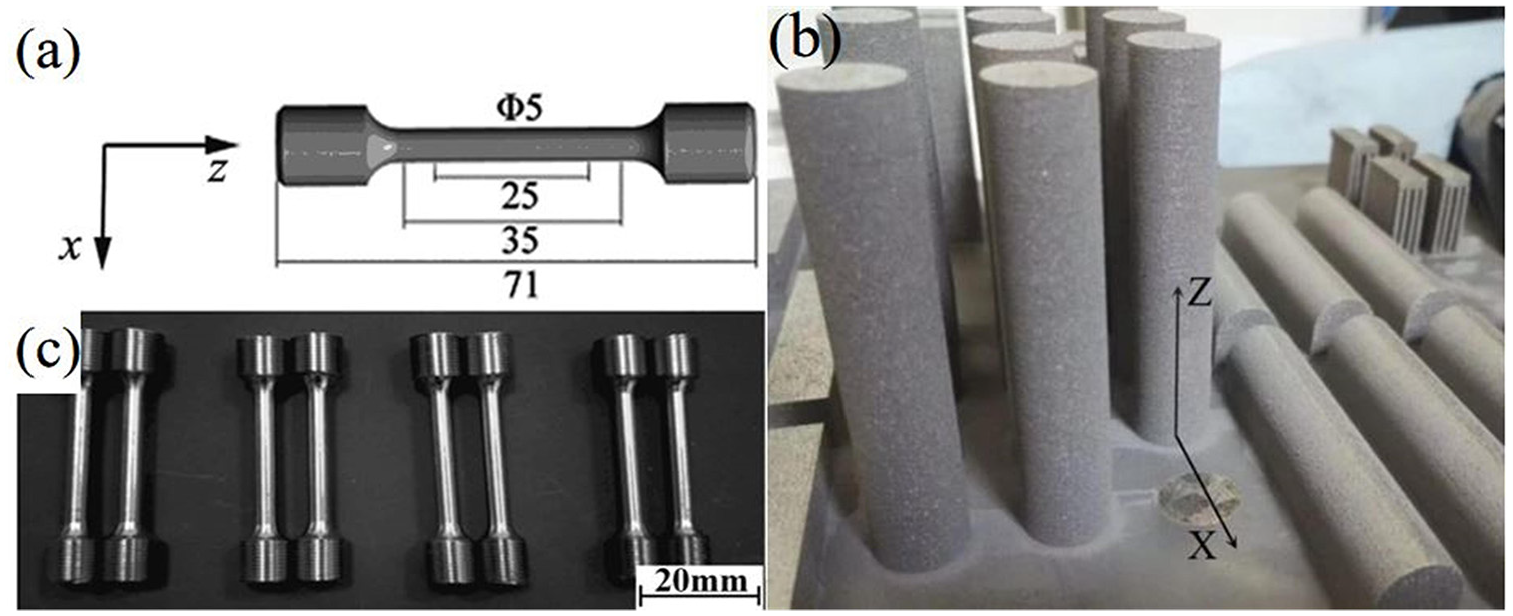
The samples fabricated by L-PBF: (a) geometric size with unit of mm, (b) samples prepared by L-PBF and (c) standard tensile bars.
The formed part was ground with 120–1000 grit SiC papers and polished for 30 min using polishing cloth with grade of 1200. The THV-1 digital microhardness tester was used to test the hardness of the fabricated samples. 20 points were tested in each part from three different directions. For microstructure observation, the polished parts were corroded with aqua regia for about 10 s, and then immediately cleaned with ethanol and dried by air blower. The KEYENCE laser confocal microscope (VK-X250), scanning electron microscope (SEM, JSM-6510) and transmission electron microscope (TEM, JEM-2100) were used to observe the microstructures of samples.
Results and discussion
Influence of processing parameters on mechanical properties
In this study, the Archimedes drainage method was used for relative density test. The calculation method is shown as 20
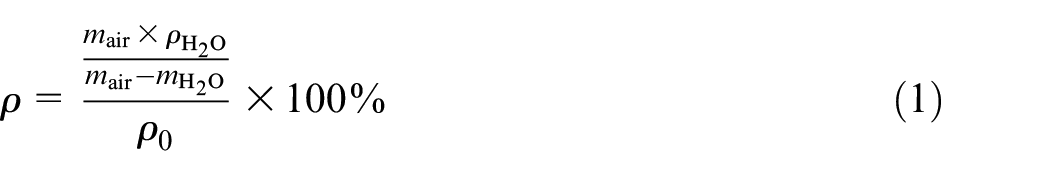
where ρ is the relative density (%), mair is the mass of the alloy in air (g),
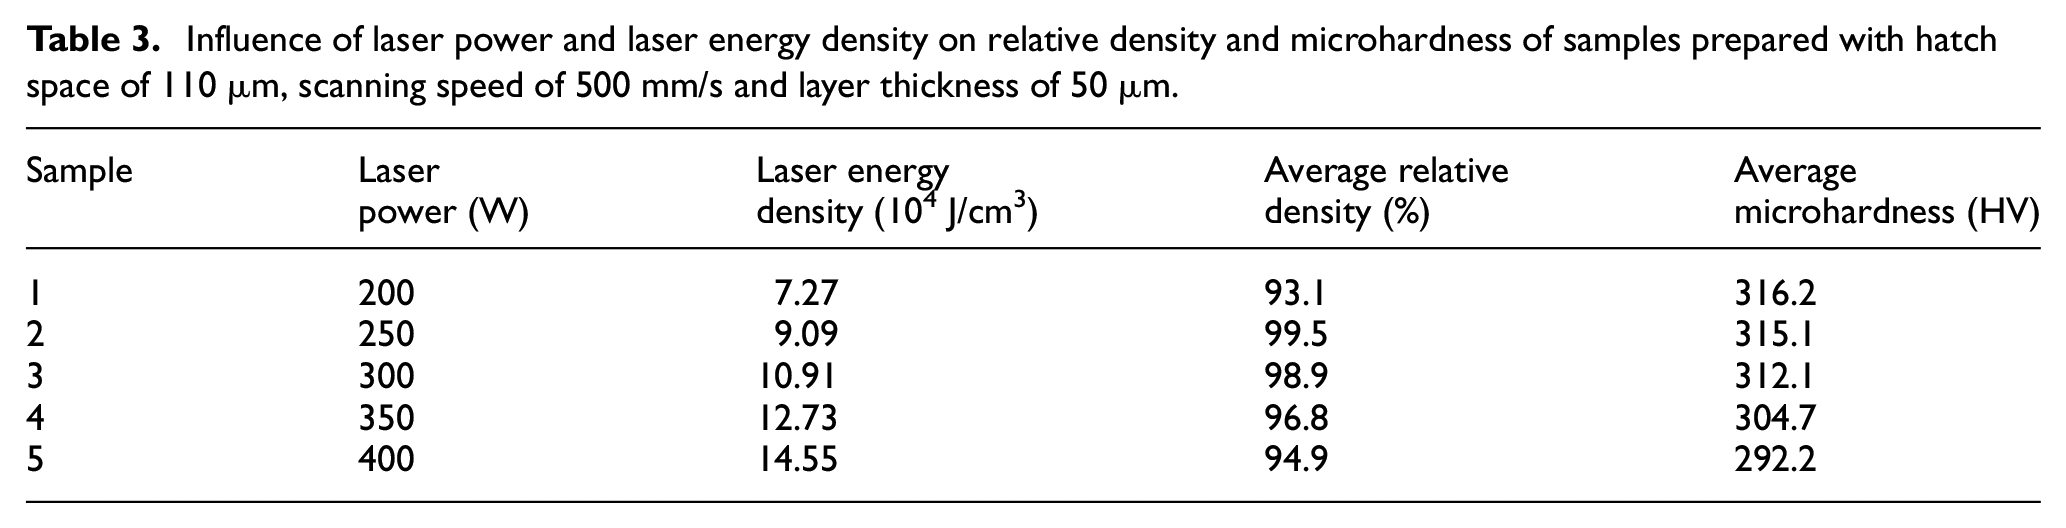
Figure 4 shows the variation of relative density and hardness of samples prepared with different laser powers and laser energy densities. The detailed results can be found in Table 3. Figure 5 shows the microstructure of samples prepared with laser power of 200, 250 and 400 W. It can be seen from Figure 4 and Table 3 that the density increases first and then decreases with the increase in laser power and laser energy density. When the laser power was increased from 200 to 250 W, the density increased from 93.1% to the highest value of 99.5%. This was because when the laser power was 200 W, the laser energy density was too low to completely melt the powder which induced pores in the samples shown in Figure 5(a). Due to the low degree of fusion, voids would appear during superimposition of printing process21,22 as shown in Figure 5(b). Figure 5(c) shows the cross-section morphology of the sample prepared with laser power of 250 W. It can be seen that the surface of the sample has no obvious defects such as pores and voids which indicates that the laser energy density is sufficient to melt the powder. When the laser power was increased from 250 to 400 W, the density dropped slowly from 99.5% to 94.9%. As the laser power was increased, a larger molten pool was formed on the previous layer, which made the liquid phase too much and the surface tension of the liquid phase decreased. The surrounding powder was adhered to the surface of the melting during flow of the liquid, which would reduce the amount of powder of the next track. This would result in a height difference between the adjacent tracks on the same layer, and cause uneven spreading of the next layer, and reduce the density of the formed parts. In addition, a strong shock wave could be induced by high laser power, which caused the molten pool to splash during the melting process of the powder to lead to spheroidization and decreased the density. 23 Yi et al. 24 found the similar results during investigation of deposition of liquid aluminum. It was found that too low or too high laser energy may cause cold laps between powders, which induced pores in the samples.
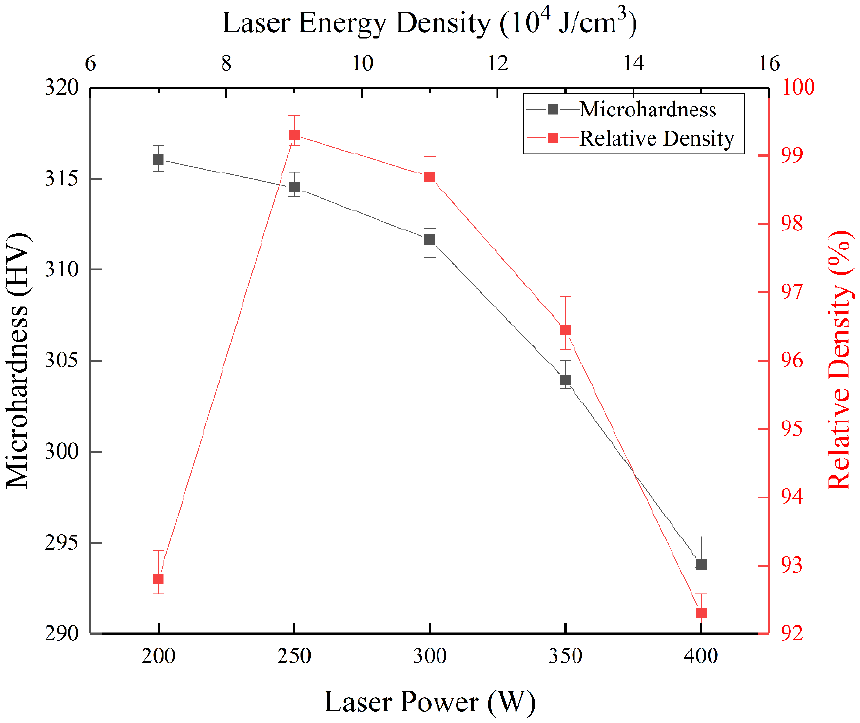
Effects of laser power and laser energy density on the mechanical properties of L-PBF formed GH536 alloy.
Influence of laser power and laser energy density on relative density and microhardness of samples prepared with hatch space of 110 μm, scanning speed of 500 mm/s and layer thickness of 50 μm.
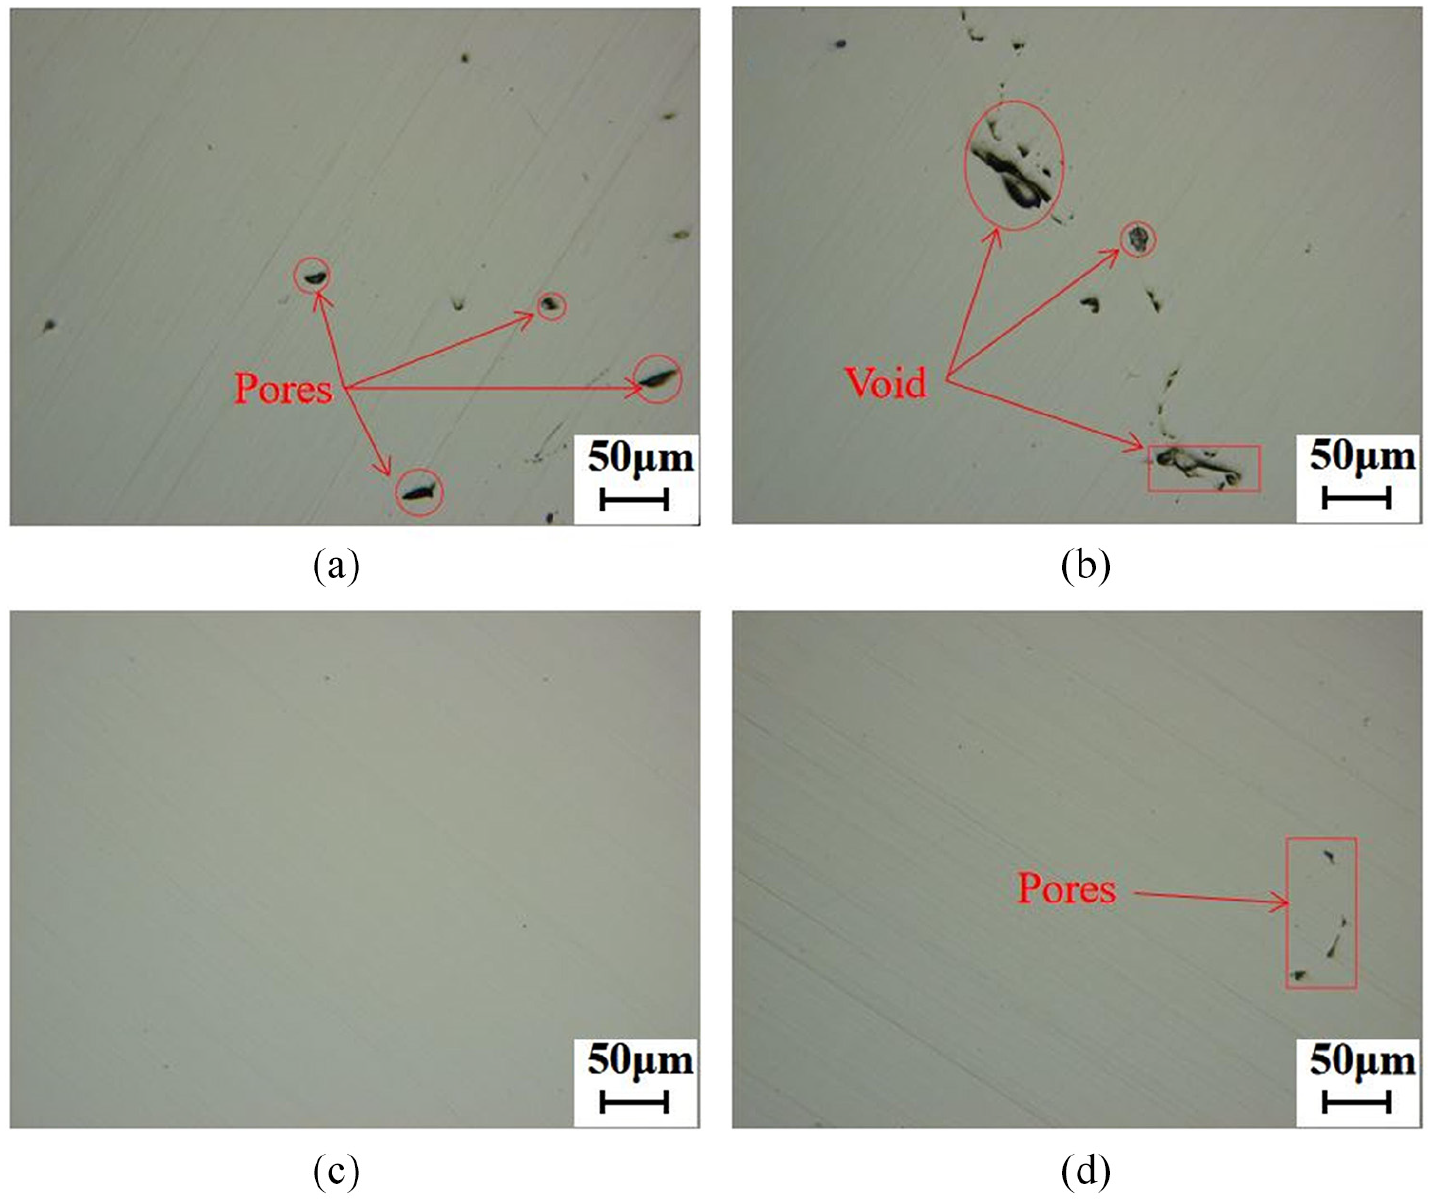
Microstructure of samples prepared with different laser powers: (a) and (b) laser power of 200 W, (c) laser power of 250 W and (d) laser power of 400 W.
For the microhardness, it can be seen from Figure 4 that the laser power was increased from 200 to 400 W, the hardness of the sample gradually decreased from 316.2 to 292.2 HV. This was mainly because when the laser power was increased, the energy absorbed by the metal powder was increased, which induced a short time heat treatment to the formed part. In addition, when the laser power was too high, the previous layer would be remelted causing the crystal grain size to increase, which resulted in a decrease of hardness.
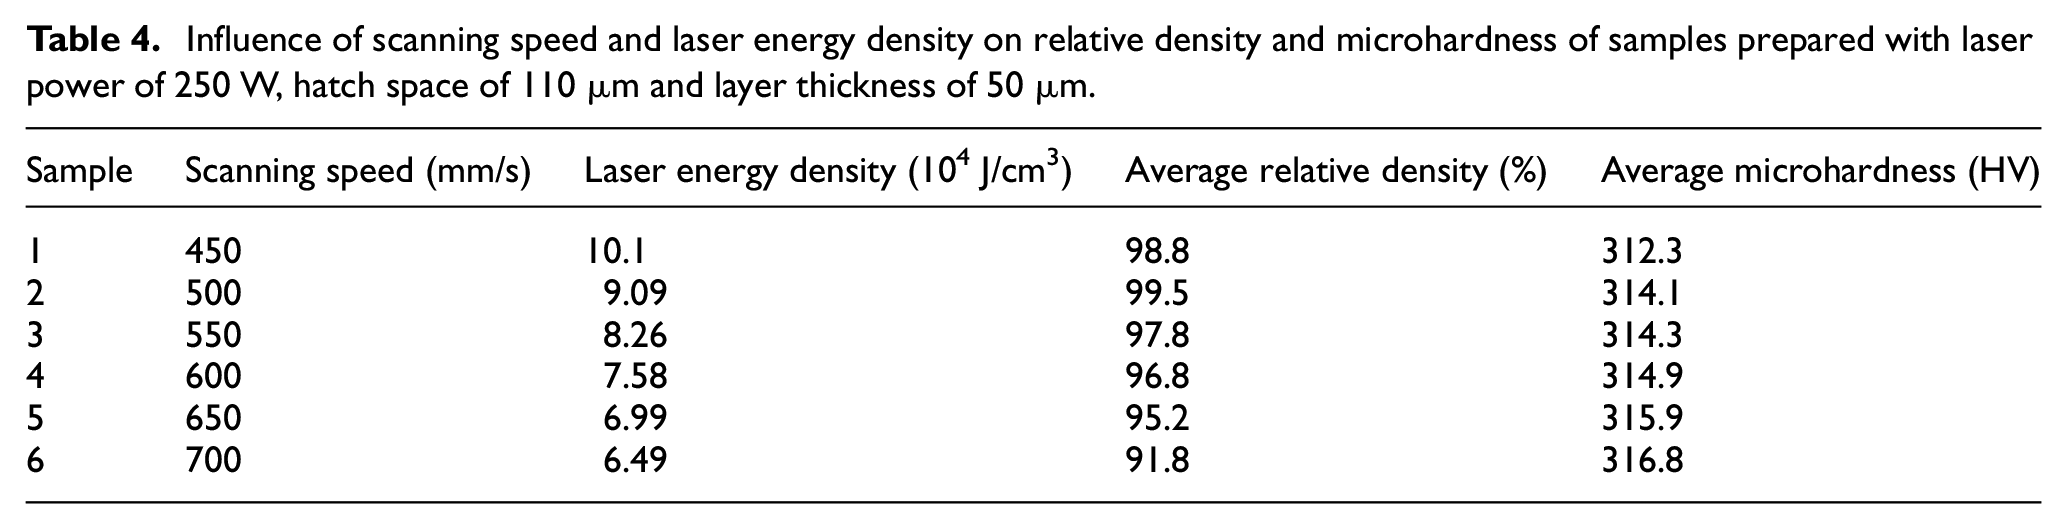
The effects of scanning speed and laser energy density on the density and hardness of the formed parts were studied and the results were shown in Figure 6 and Table 4. Figure 7 shows the microstructure of samples prepared with scanning speed of 450, 500 and 700 mm/s. It can be seen that the density increased first and then decreased as the scanning speed increasing. When the scanning speed was increased from 450 to 500 mm/s, the density was increased from 98.8% to the biggest value of 99.5% with a smooth surface as shown in Figure 7(b). The reason is that low scanning speed would induce high laser energy density and cause over heating of the powder. The molten pool was hence wide and more powder around the pool was adhered to the liquid metal. Due to this, the powder was less for the fusion of next track and some voids would be induced as shown in Figure 7(a). The relative density would be decreased due to the reason mentioned above. When the scanning speed was increased from 500 to 700 mm/s, the density was reduced from 99.5% to 91.8%. This is because when the scanning speed is too fast, the laser energy density is too low to melt the powder resulting in defects such as spheroidization and pores as shown in Figure 7(c). The faster the scanning speed, the more defects are generated and the lower density is induced.
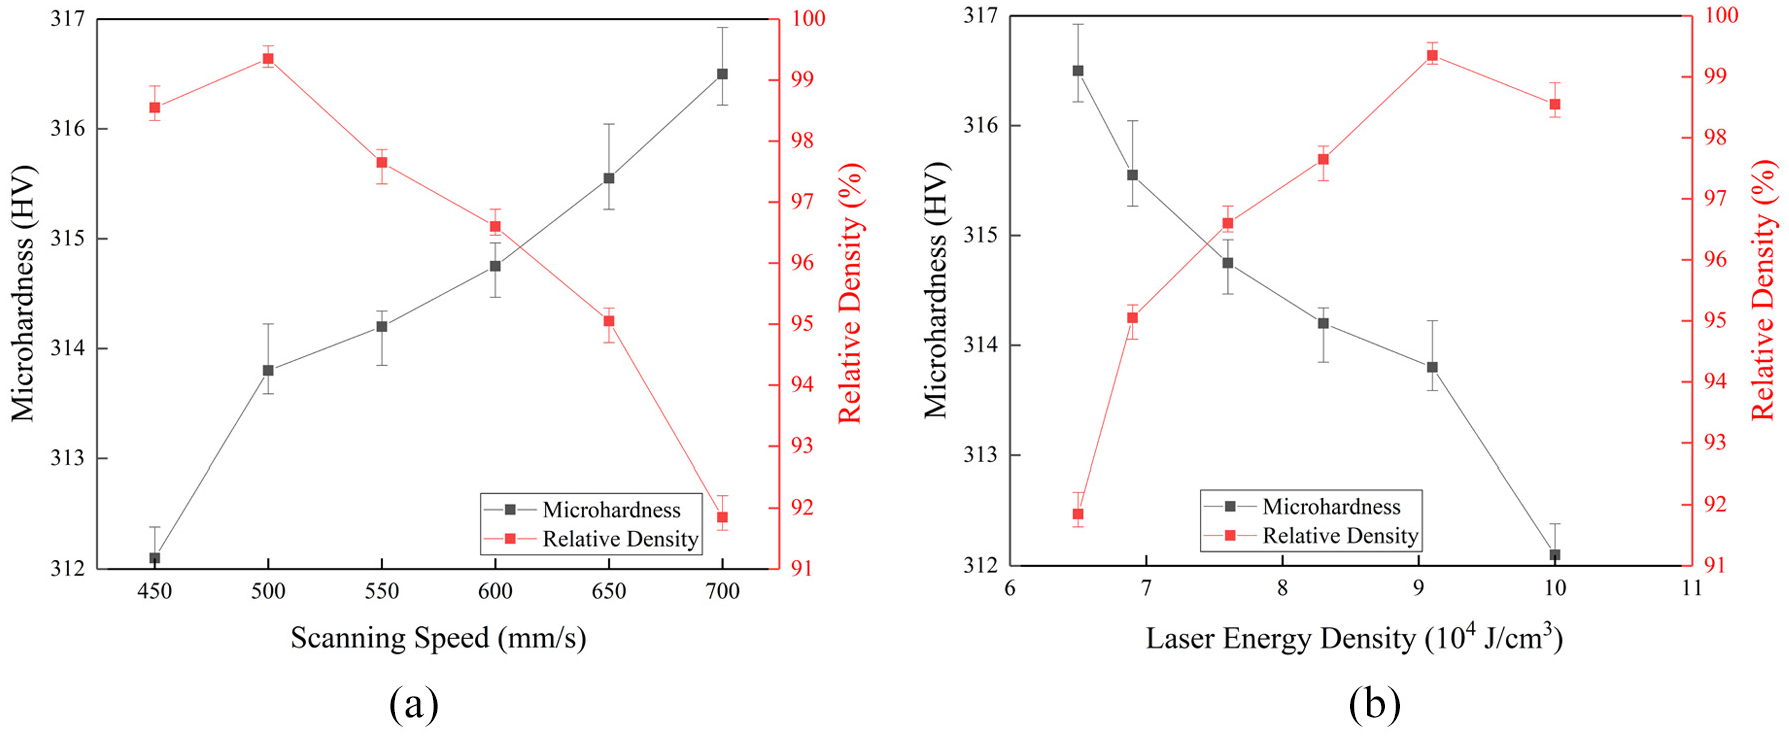
Effects of (a) scanning speed and (b) laser energy density on the mechanical properties of L-PBF formed GH536 alloy
Influence of scanning speed and laser energy density on relative density and microhardness of samples prepared with laser power of 250 W, hatch space of 110 μm and layer thickness of 50 μm.
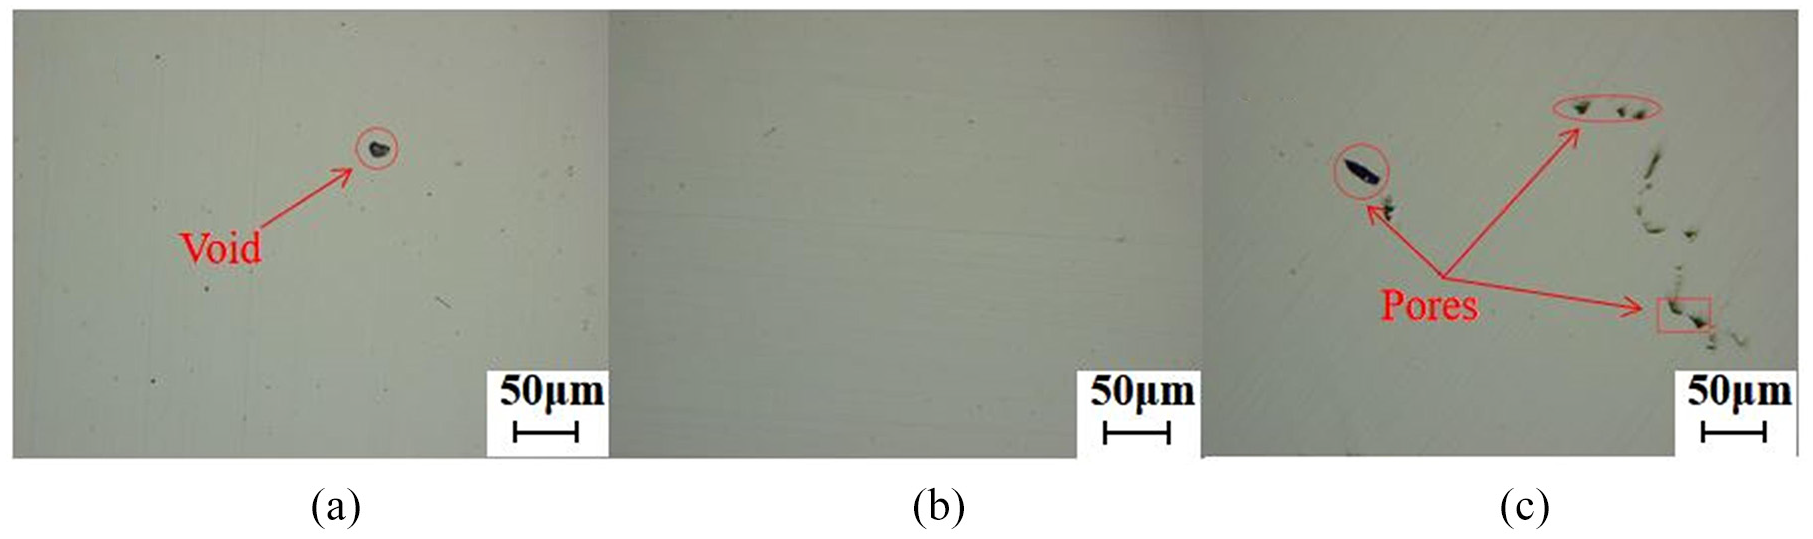
Microstructure of samples prepared at different scanning speeds: (a) 450 mm/s, (b) 500 mm/s and (c) 700 mm/s.
For microhardness, it was increased from 312.3 to 316.8 HV with the increase in scanning speed. When the scanning speed was slow, the grain size was big due to high laser energy density and resulted in low hardness. With the increase in scanning speed, the grain size was becoming smaller and the higher hardness was induced.
Figure 8 and Table 5 show the influence of hatch space and laser energy density on the mechanical properties. The density was increased from 96.8% to 99.5% when the hatch space increased to 110 μm from 80 μm. This is because the laser energy density is too high with small hatch space and the remelting part of the previous track will be large. In addition, the molten pool tends to incline to the formed direction, which makes the forming surface uneven. Therefore, the density of samples decreased at a hatch space of 80 μm as shown in Figure 9(a). The density was the highest when the hatch space increased to 110 μm as shown in Figure 9(b), which indicated the laser energy density was high enough to melt the powder completely. After that, the density decreased greatly when the hatch space was increased from 110 to 120 μm. The main reason is that the laser energy density is too low to melt the powder completely. As a result, many pores are generated as shown in Figure 9(c) and the combination of layers is influenced. The error becomes larger with layers increasing and eventually causes the density to decrease.
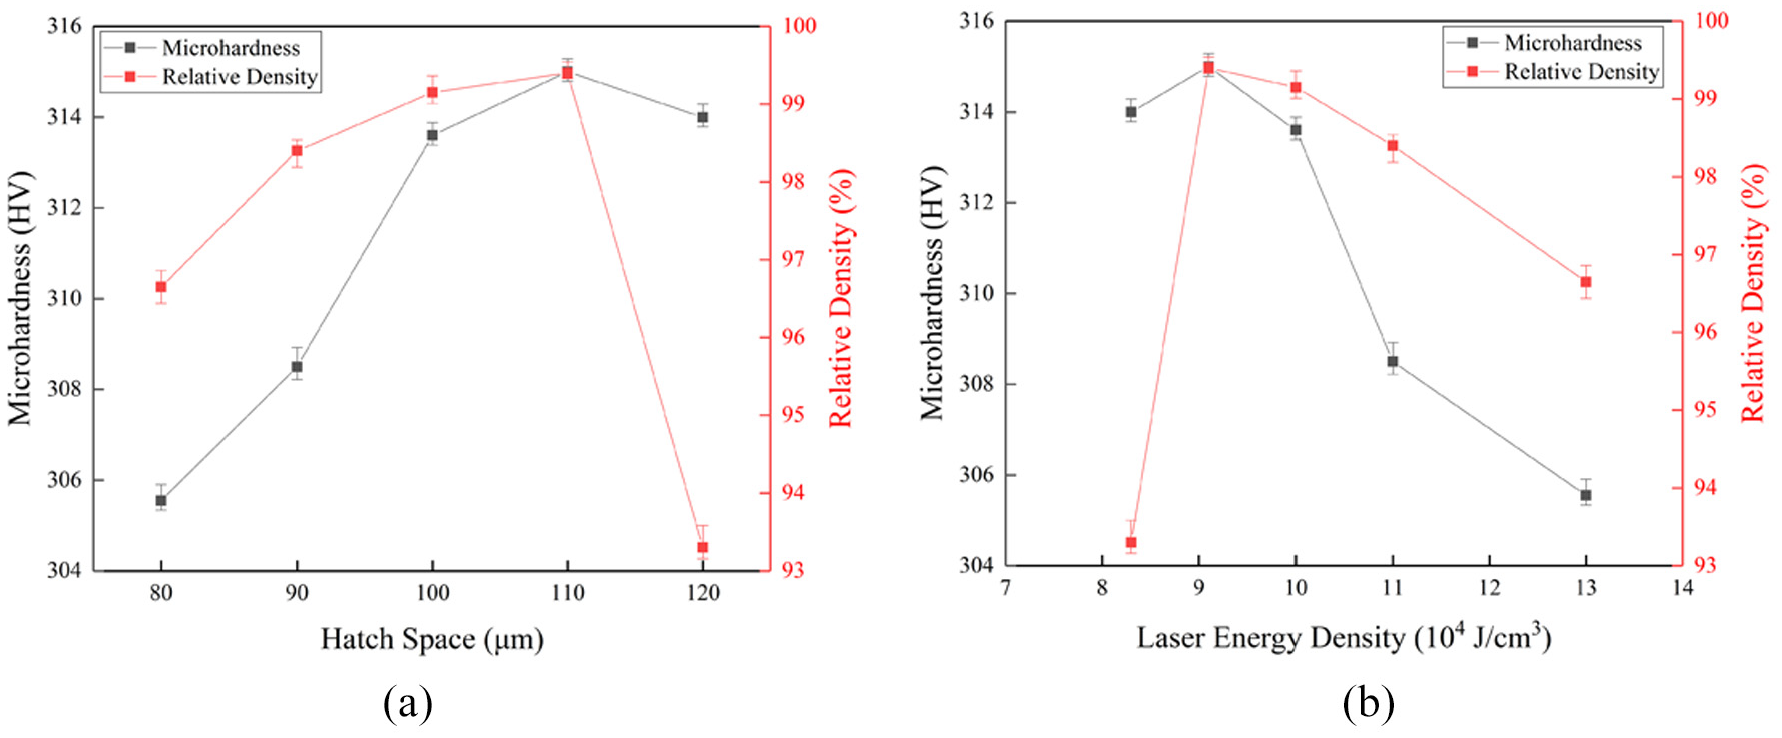
Effects of (a) hatch space and (b) laser energy density on the mechanical properties of L-PBF formed GH536 alloy
Influence of hatch space and laser energy density on relative density and microhardness of samples prepared with laser power of 250 W, scanning speed of 500 mm/s and layer thickness of 50 μm.
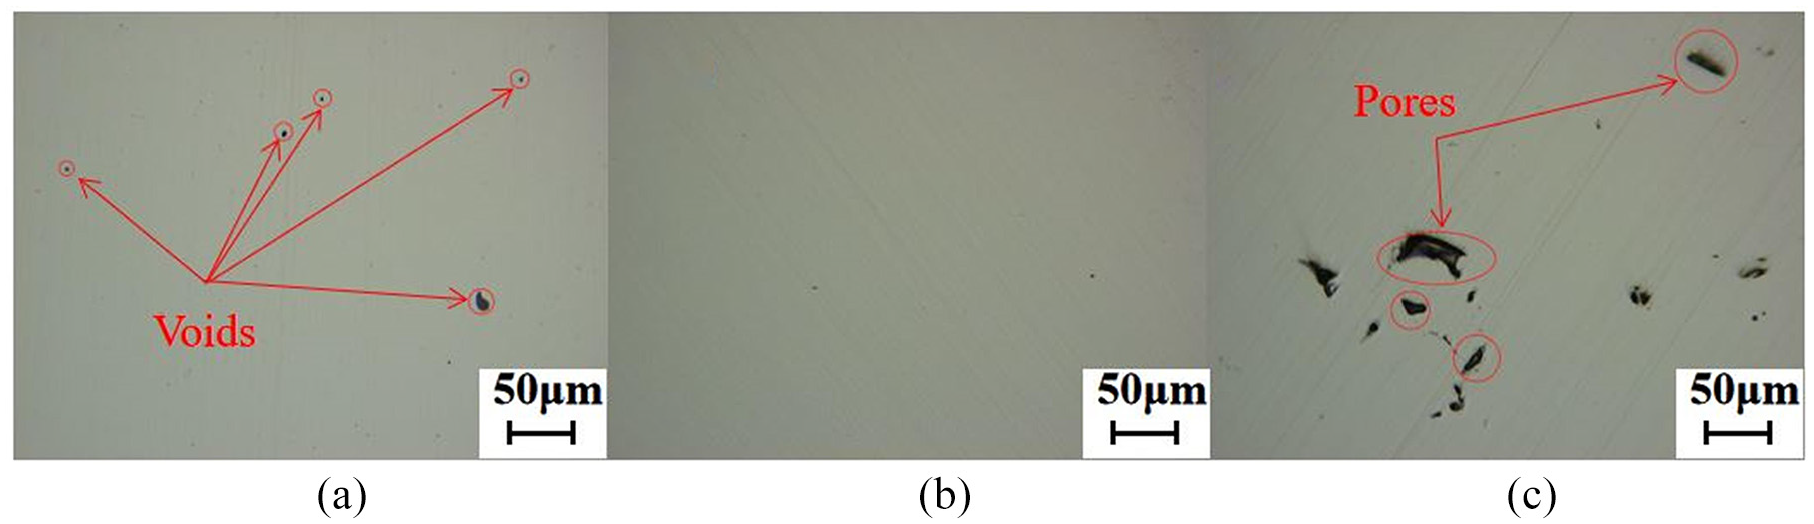
Microstructure of samples prepared with different hatch spaces: (a) 80 μm, (b) 110 μm and (c) 120 μm.
For hardness, it increased to 315.2 HV from 305.8 HV when the hatch space was increased from 80 to 110 μm. For the small hatch space, the laser energy density was too high and caused over heating of the material, which made the grains too big and resulted in low hardness. However, the hardness of the samples decreased to 314.2 HV from 315.2 HV when the hatch space increased to 120 μm. This is due to insufficient melting of the overlap area for the low laser energy density. As a result, the defects—such as spheroidization and voids—are generated and reduce the hardness of the formed part.
In above studies, the influence of laser power, scanning speed and hatch space on the relative density and hardness was investigated, respectively. However, in the real applications, all these parameters may depend on each other. In order to fully understand the joint influence of these parameters, the laser energy density should be analyzed during processing. The laser energy density is defined as
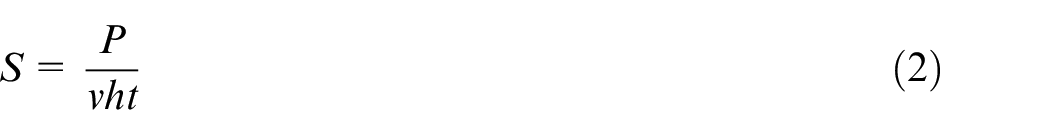
where P is the laser power, v is the scanning speed, h is the hatch space, and t is the layer thickness. In this study, we considered the relative density of 98% as an acceptable criterion, and the corresponding laser energy density should be in the range of 8.56 × 10⁴–1.15 × 10⁵ J/cm3 which is the gray area shown in Figure 10.
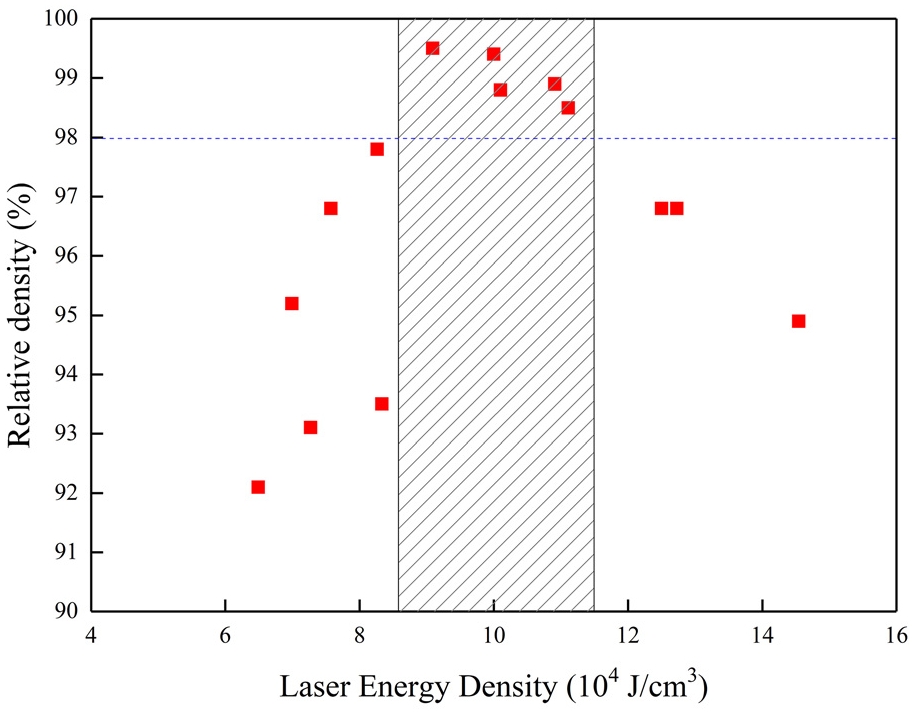
Relationship of laser energy density and relative density. The dotted line defines the acceptable value of relative density and the gray area is the processing window for this value.
Figure 11 shows the stress–strain curve of samples prepared by different laser powers and building directions. The scanning speed was 500 mm/s and the hatch space was 110 μm. As can be seen from Figure 11, the maximum elongation of all samples was 10.3%, which is lower than most value of GH536 sample prepared by other groups in Table 6. The main reason may be that the residual stress induced by L-PBF process was too high which induced poor plasticity of material. Some other studies pointed out that the heat treatment could improve the physical properties of samples prepared by L-PBF.28,29 Amato et al. 28 studied the hardness of Inconel 718 parts made by L-PBF. The Vickers hardness was 3.9, 5.7 and 4.6 GPa after post-treatment, hot isostatic pressure (HIP) treatment and heat treatment, respectively. Wang et al. 30 investigated the mechanical properties of Inconel 718 parts made by L-PBF. The tensile strength was 900 and 1100 MPa before and after post-treatment, respectively. As a result, post-treatment such as heat treatment or HIP is recommended to eliminate defects of stress concentration and harmful brittle phases.27,31
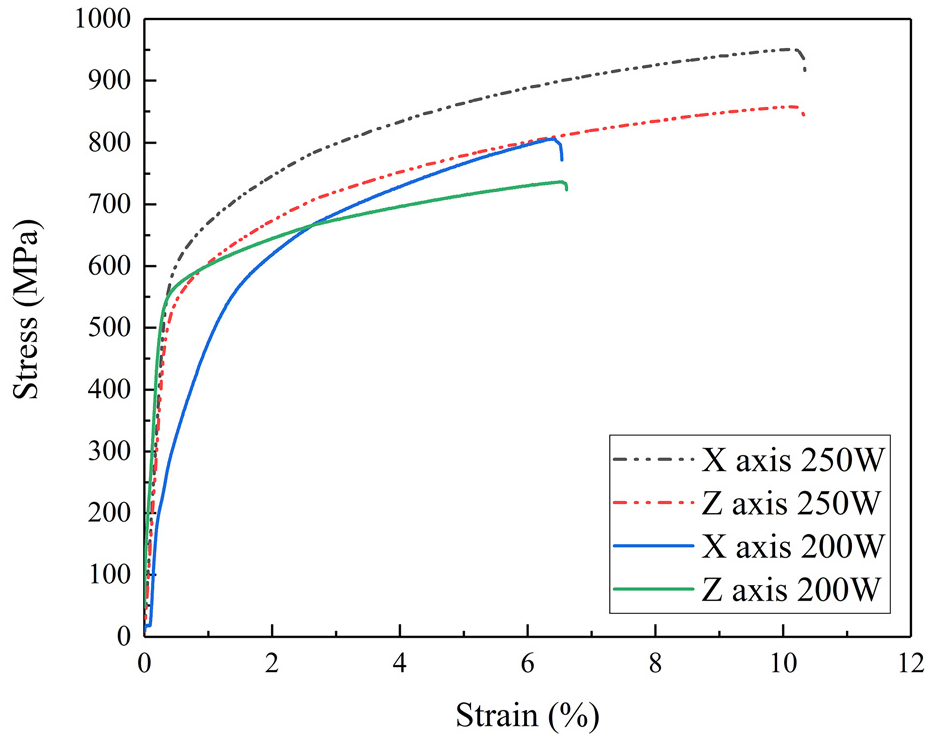
Stress and strain curves of samples prepared by different laser powers and building directions.
Mechanical properties of GH536 prepared by L-PBF from different groups.
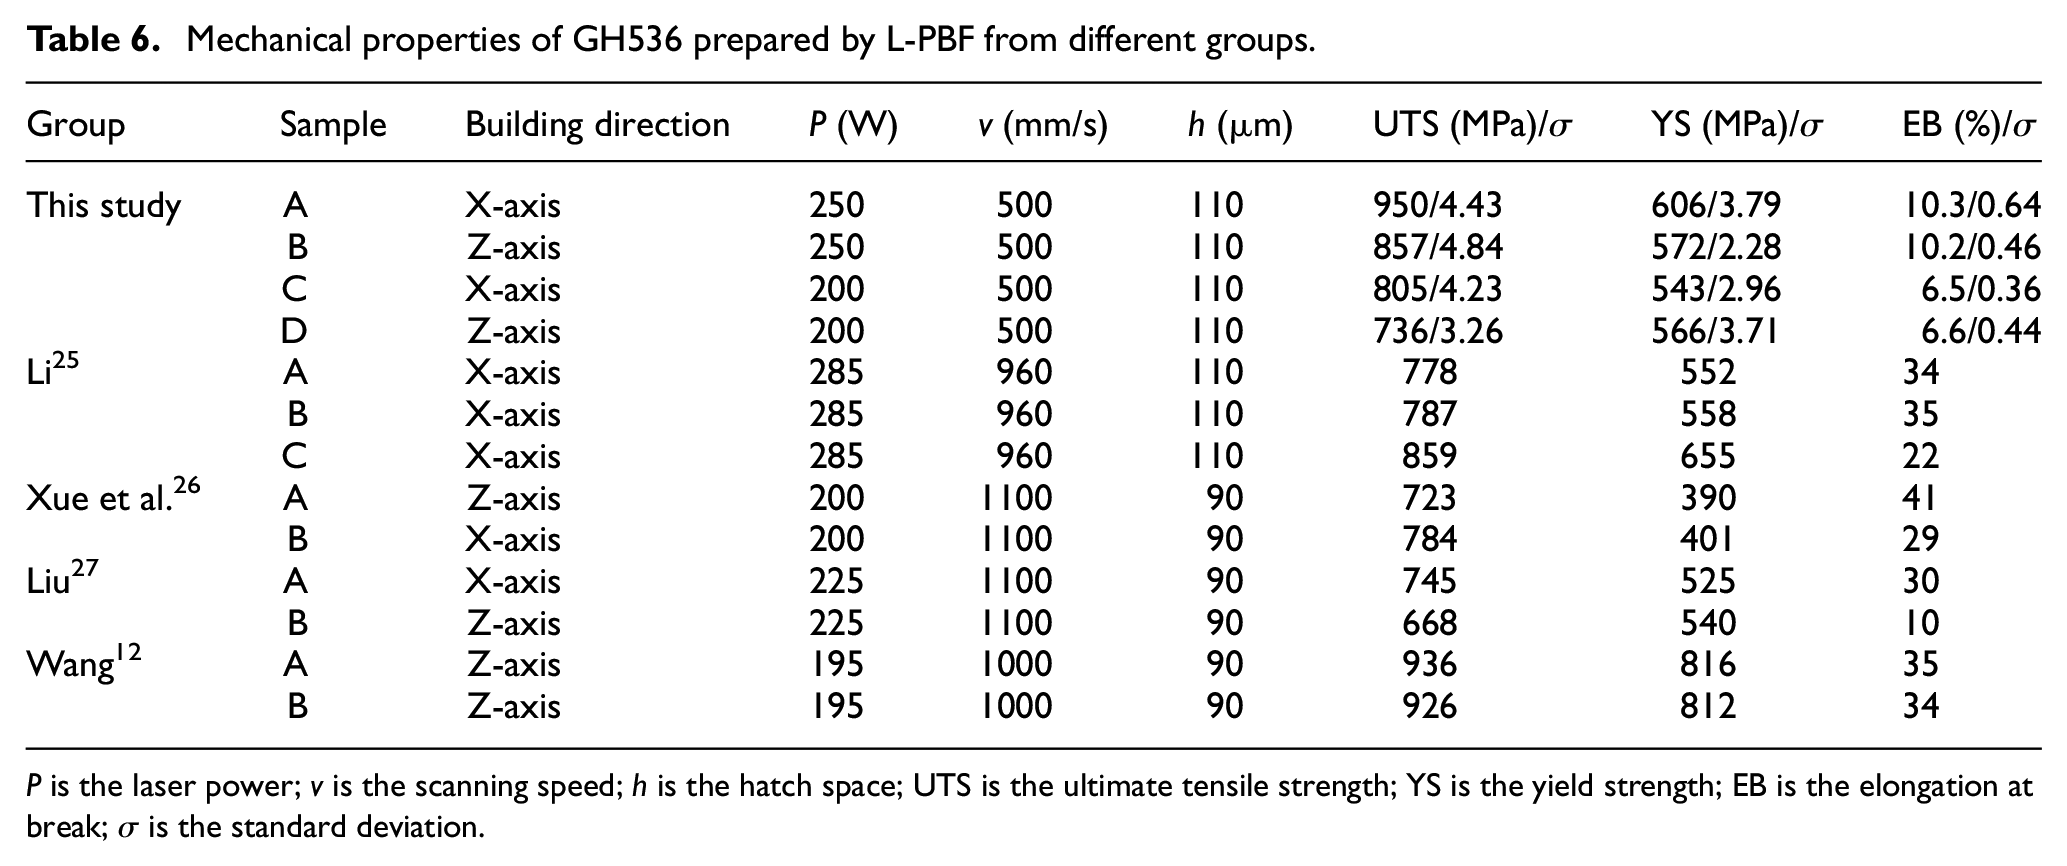
P is the laser power; v is the scanning speed; h is the hatch space; UTS is the ultimate tensile strength; YS is the yield strength; EB is the elongation at break; σ is the standard deviation.
The tensile and yield strength of the samples prepared along X-axis (perpendicular to the building direction) with laser power of 250 W could reach 950 and 606 MPa, respectively, which are better than results from other groups as shown in Table 6. These results are also better than the ones of traditional hot forged GH536 alloy with tensile strength of 767 MPa and yield strength of 379 MPa. 12 The reason is that the laser action time is very short and the coating thickness is pretty small which induces small grain size of the samples and leads to good mechanical properties during L-PBF process. Besides, it also can be found from Table 6 and Figure 11 that the tensile strength and yield strength of all samples prepared along X-axis (perpendicular to the building direction) are higher than those prepared along Z-axis (parallel to the building direction). This is because that the poor wettability between layers and the uneven surface will result in weak bonding, which will lead to fracture between layers. In addition, columnar crystals will be formed during the L-PBF process, and results in the anisotropy of mechanical properties of the samples. The growth direction of columnar crystals of the samples formed along Z-axis is parallel to the tensile direction as shown in Figure 12(b), while the growth direction of columnar crystals of the samples formed along X-axis is perpendicular to the tensile direction. This will result in better mechanical properties along X-axis. With lower laser energy of 200 W, the powder may not be completely melted, which could cause problems such as pores and spheroidization as shown in Figure 13(a), and the bonding between layers will also be weakened. This could reduce the mechanical properties seriously.
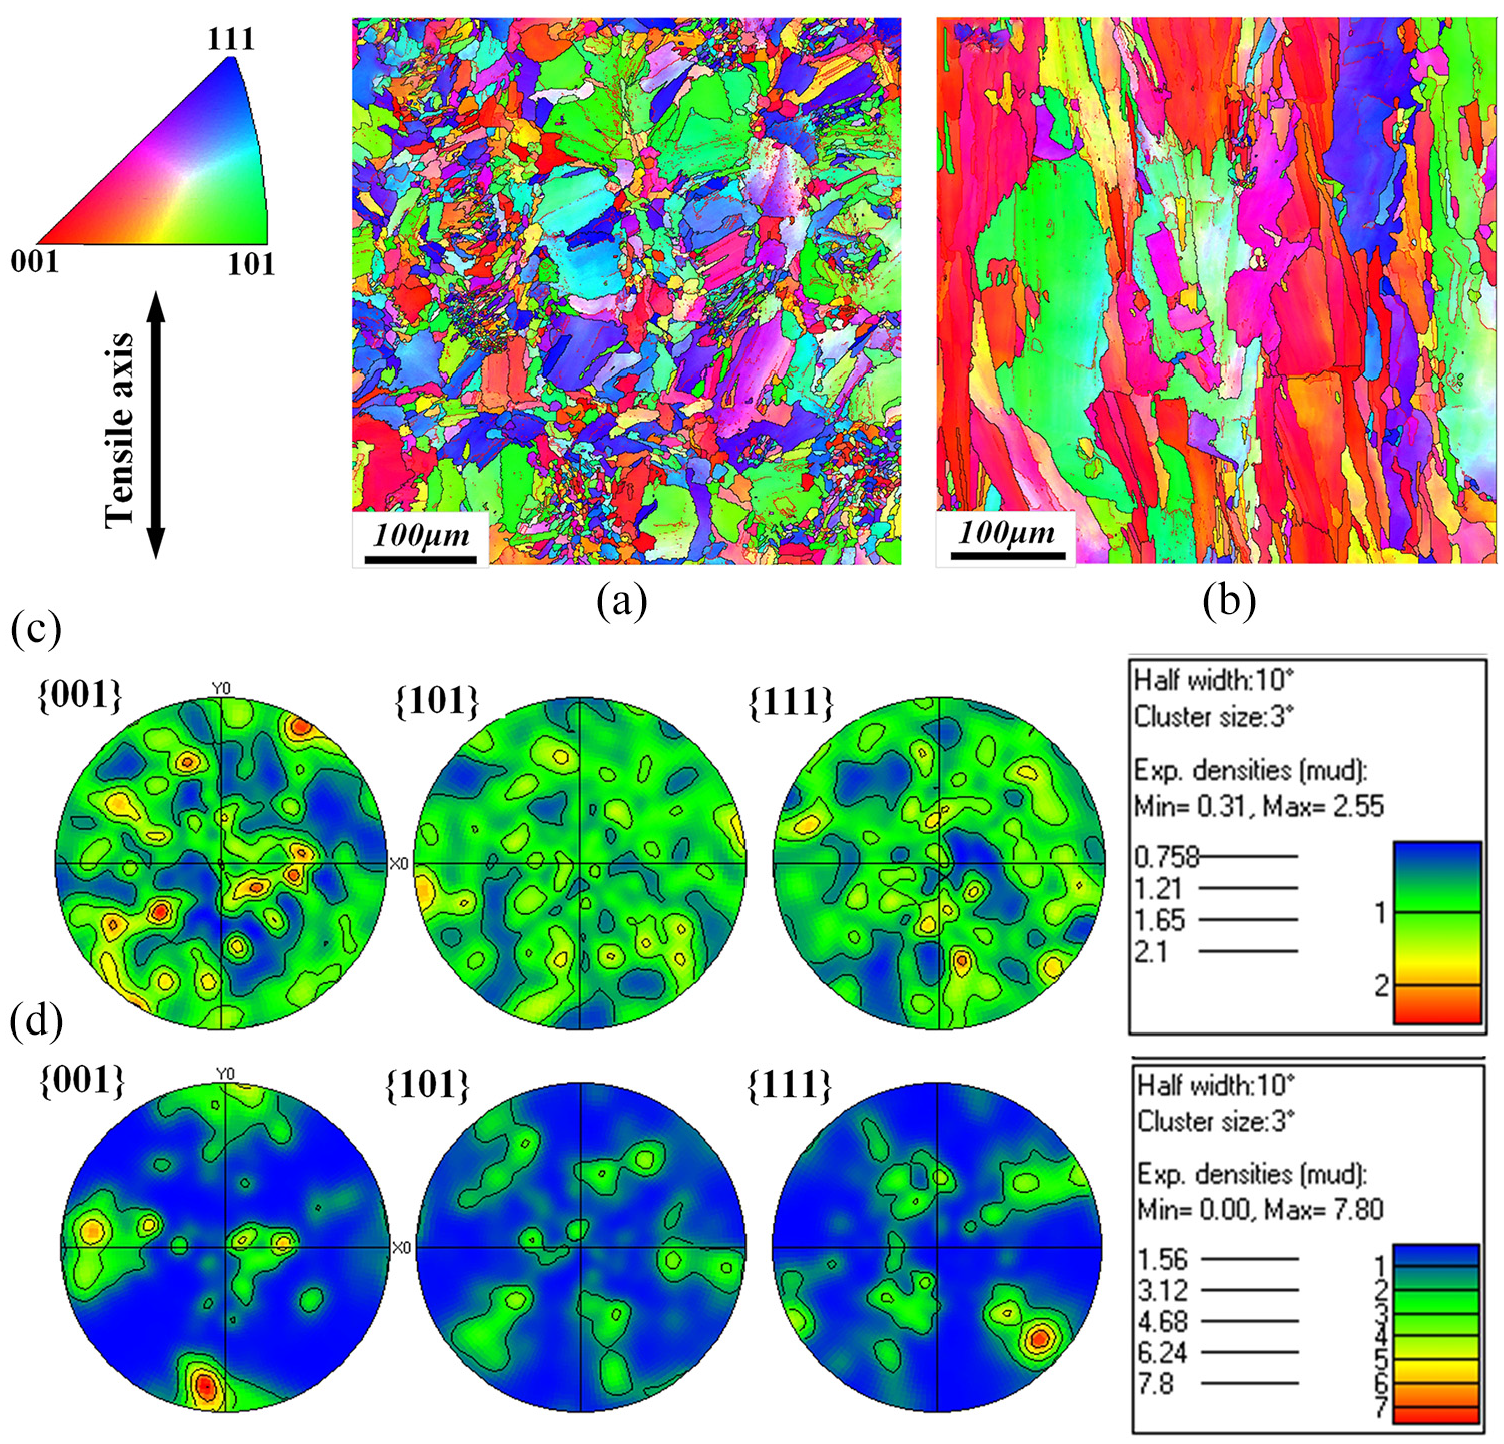
EBSD inverse pole figure maps of the samples prepared along (a) X-axis and (b) Z-axis, pole figure of the samples prepared along (c) X-axis and (d) Z-axis.
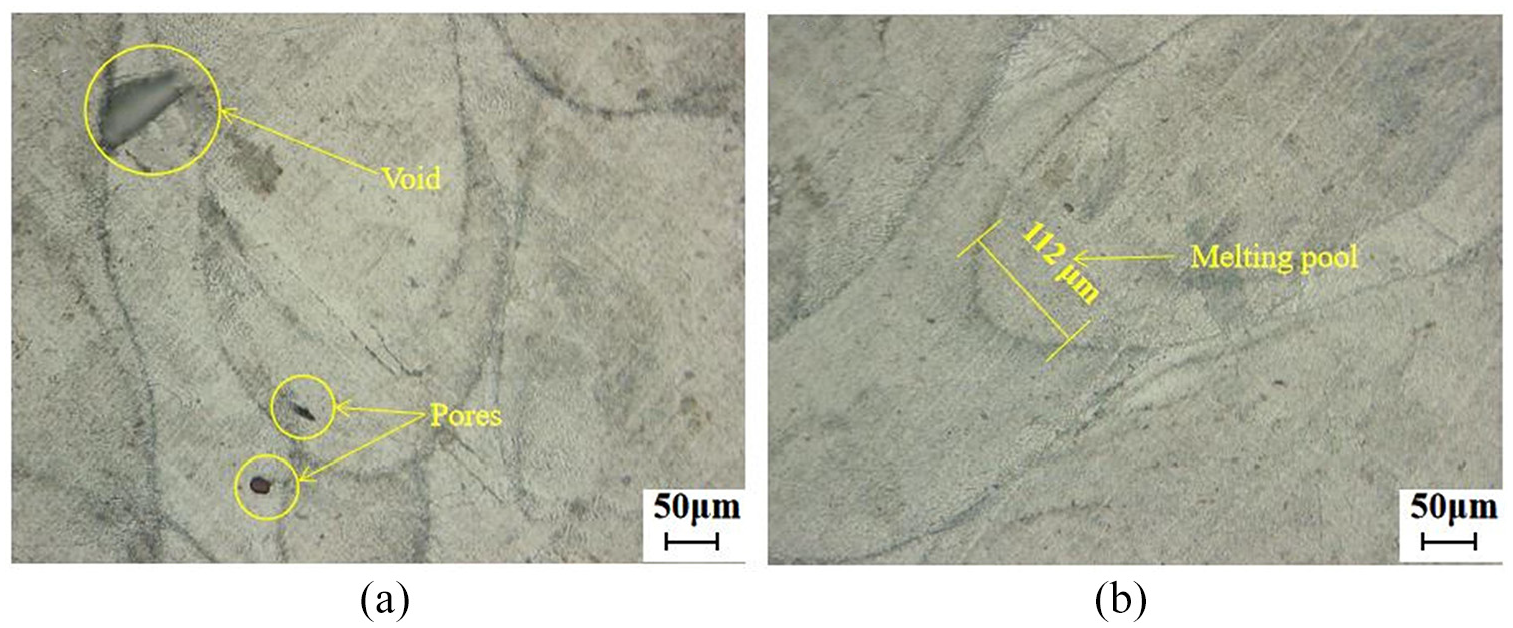
The microstructure prepared along X-axis with different laser powers: (a) 200 W and (b) 250 W.
Electron backscatter diffraction analysis
The electron backscatter diffraction (EBSD) analysis was performed to the samples to describe the grain morphology and crystallographic texture.Figure 12(a) and (b) shows inverse pole figure (IPF) maps of the samples prepared along X-axis and Z-axis, respectively. It is obvious that the grains of sample prepared along X-axis are typical equiaxed grains observed from side view. However, the columnar grains show up in the sample prepared along Z-axis observed from the same side view. This is why the tensile properties of the samples along the X-axis are better than those along the Z-axis shown in Figure 11. Similar phenomenon was also found by Wang et al. 32 and Hitzler et al. 33 The grains in Figure 12(b) show a strengthening of the red (001) orientation and a weakening of the green (101) and blue (111) orientations. It is well known that GH536 has a face-centered cubic (FCC) crystal structure with a preferred growth direction of (001). Figure 12(c) and (d) shows that the maximum texture intensity increases from 2.55 to 7.80 suggesting a texture strengthening in the samples which is consistent to the lower tensile properties of samples prepared along Z-axis as shown in Figure 11.
The microstructure of samples prepared along X-axis with different laser powers is shown in Figure 13. In Figure 13(a), some pores were found due to the low energy. From Figure 13(b), it could be seen that the width of the track was about 112 μm, which was consistent with the hatch space of 110 μm, indicating that the powder was completely melted; hence, no pores were found. This will lead to better mechanical properties proved by Figure 11.
Analysis of tensile fracture
In this section, the tensile fractures of samples prepared with different forming parameters were analyzed. The hatch space was 110 mm, the scanning speed was 500 mm/s, the building direction was along the X-axis, and the laser power was 200 and 250 W, respectively. The fracture morphology was analyzed by SEM. The results are shown in Figure 14.
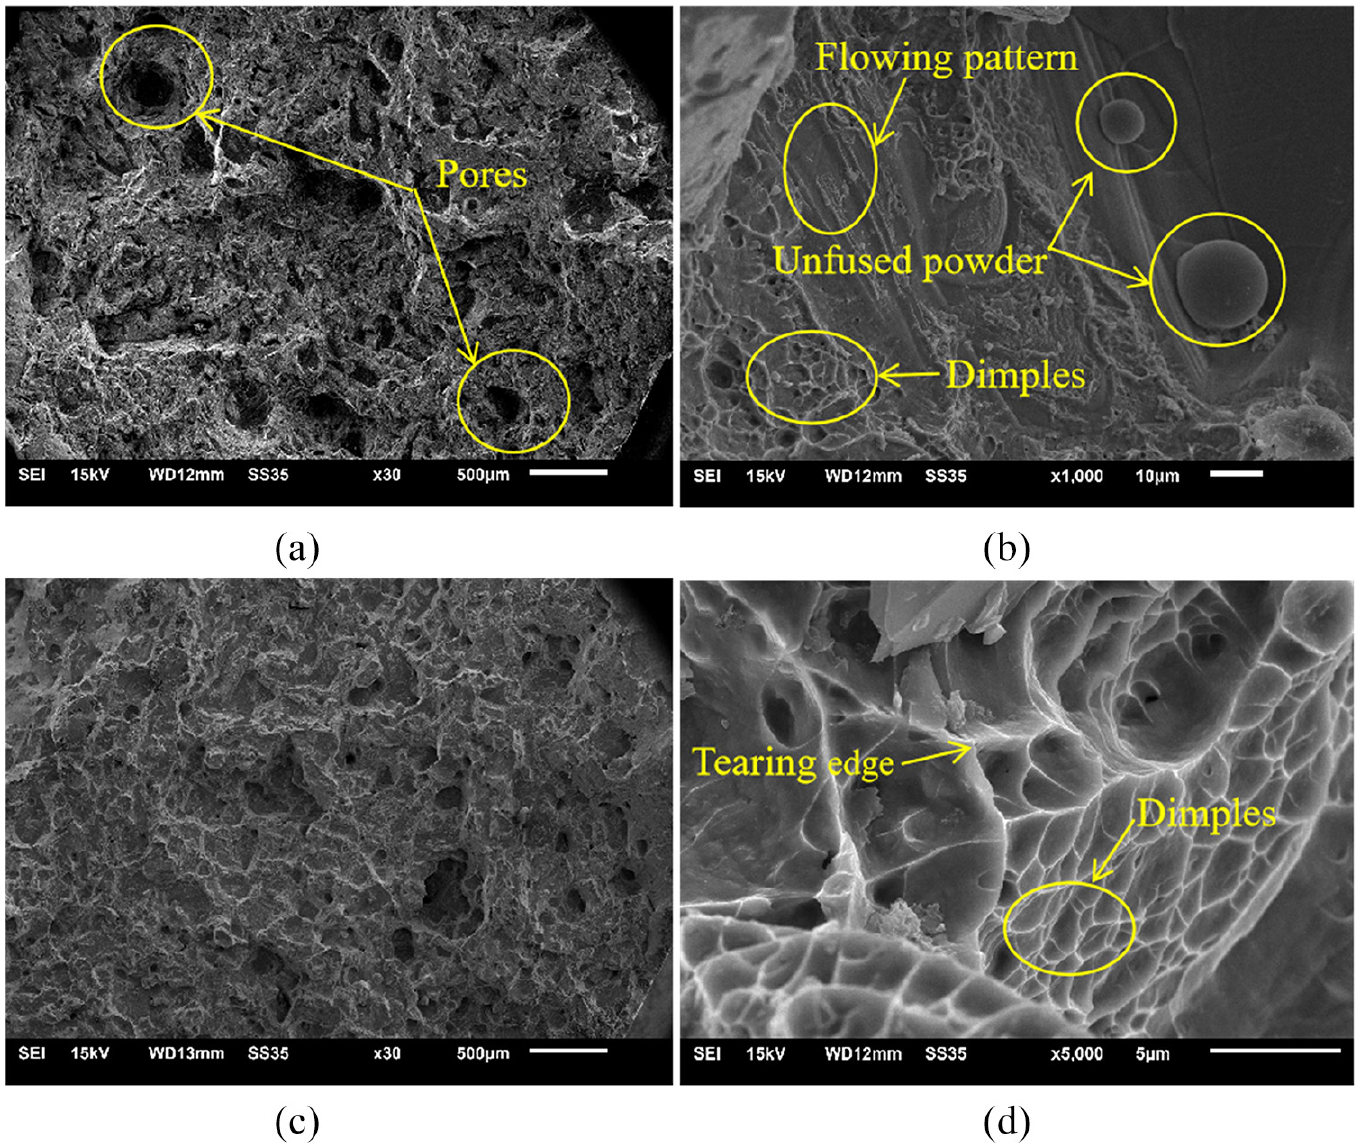
Fracture morphology of GH536 samples prepared with different laser powers: (a) and (b) laser power of 200 W and (c) and (d) laser power of 250 W.
Some pores and unfused powders can be found in Figure 14(a) and (b) when the laser power is 200 W. However, there are some shallow dimples and flowing patterns in the flat surface of fracture. All these features indicate that the fracture is a mixture of brittle fracture and plastic fracture.
Figure 14(c) and (d) shows the fracture morphology of the samples prepared with laser power of 250 W. It is obvious that there are no pores and unfused powders, which indicates that the laser energy density is high enough to melt the powder completely. Besides, a lot of orderly arranged dimples and tearing edges are found in Figure 14(d). The dimples are deeper than those shown in Figure 14(b), which indicates typical plastic fracture features.
Conclusion
The mechanical properties and microstructures of nickel-based superalloy GH536 fabricated by L-PBF additive manufacturing were investigated. The fracture features of samples prepared with different processing parameters were also analyzed. The following conclusions can be drawn:
Low laser energy density will induce pores and unfused powders in the samples which leads to decrease of mechanical properties of samples. However, if the laser energy density is too high, over heating will happen and result in high inner stress and big grain size which also decreases mechanical properties of samples. If relative density of 98% is taken as an acceptable criterion, the reasonable laser energy density should be in the range of 8.56 × 10⁴–1.15 × 10⁵ J/cm3.
The optimal laser energy density for GH536 alloy is 9.09 × 10⁴ J/cm3 calculated from the set parameters of laser power of 250 W, scanning speed of 500 mm/s, hatch space of 110 μm, layer thickness of 50 μm and laser spot diameter of 135 μm. Using these parameters, the relative density can be as high as 99.5% and the tensile strength and yield strength are 950 and 606 MPa, respectively.
The building direction has a critical influence on the mechanical properties of samples. The tensile strength and yield strength of the samples prepared along X-axis are higher than those of samples prepared along Z-axis.
If the laser energy density is lower than 7.27 × 10⁴ J/cm3, the fracture mode is mainly showing feature of brittle fracture during tensile tests. However, if the laser energy is increased to 9.09 × 10⁴ J/cm3, the fracture mode will be transformed to typical plastic fracture during tensile tests.
Footnotes
Acknowledgements
The authors thank all participants who assisted in this study for their time and patience and to the various teachers and students who also enabled the collection of data.
Declaration of conflicting interests
The author(s) declared no potential conflicts of interest with respect to the research, authorship, and/or publication of this article.
Funding
The author(s) disclosed receipt of the following financial support for the research, authorship, and/or publication of this article: The authors are grateful to the projects supported by the Key R&D Program of Ministry of Science and Technology of China (2016YFB1102602), the National Nature Science Foundation of China (grant no. 11504144), the project funded by the Talent Starting Foundation of Jiangsu University (grant no. 15JDG133) and the Young Leading Teachers Project of Jiangsu University.