
Abstract
Carbon fiber reinforced plastic (CFRP) thin-walled structures have been widely acknowledged as superior energy absorbers due to comprehensive advantages on crashworthiness and light weight. However, few studies have been reported concerning CFRP thin-walled structures with nonlinearly variable sectional dimensions along the longitudinal direction. Hence, in the present study, a novel CFRP functionally-graded conical square thin-walled structure with variable circumscribed diameter (functionally-graded conical square tube, FGCST) is proposed and comprehensively investigated. Specifically, finite element (FE) models of FGCST under multi-angle crushing loading are first built and validated. Second, a comprehensive crashworthiness comparison among the FGCST, the conventional CFRP conical square tube (CST) and the CFRP straight square tube (SST) under multi-angle crushing loading is executed to explore the relative merits of FGCST over others. Third, a parameter study is implemented on FGCST to explore the action laws of its structural parameters on its overall crashworthiness under multi-angle crushing loading. Finally, the FGCST is multi-objective crashworthiness optimized for maximizing overall specific energy absorption (SEAθ) and minimizing overall peak crushing force (PCF0) simultaneously through Taguchi method coupled with grey relational analysis (GRA). The optimized FGCST obtains 6.06% higher of SEAθ and meanwhile 40.58% lower of PCF0 compared with the baseline design, thus demonstrating good potential as a superior candidate for vehicle collision energy absorbers.
Keywords
Introduction
Research, design, and application of thin-walled structures with large energy absorption capacity yet light weight, are of great significance for synergistically improving the crashworthiness and lightweight level of the vehicle body composed of a large number of thin-walled structures (Figure 1), thereby promoting safety, energy conservation and environmental protection of vehicles.1,2 Traditional thin-walled structures of the vehicle body are mostly made of metal materials, such as steel, aluminum, etc., which are not so high as carbon fiber reinforced plastic (CFRP) in terms of specific strength and specific energy absorption (SEA) capacity to the weight. Therefore, CFRP thin-walled structures demonstrate good potential to replace traditional metal thin-walled structures in vehicle bodies, whose research has become a current research hotspot particularly in the field of automotive safety and lightweight design.3–5

Thin-wall structures of vehicle body under multi-angle crushing loading.
To better understand the crushing mechanism of CFRP thin-walled structures and fully exploit their potentials as energy absorbers, extensive experimental, theoretical and numerical studies have been conducted during past decades on crashworthiness of CFRP thin-walled structures with various sections, such as circular,6–10 square,11–13 polygonal,14,15 multi-cell,16,17 top-hat, 18 etc. For instance, Sun et al. 19 conducted experimental study on crashworthiness of CFRP circular tubes under axial quasi-static crushing. Mamalis et al. 20 conducted experimental study on crashworthiness of CFRP thin-walled square tubes subjected to static and dynamic axial compressive loading. Jiang et al., 21 Liu et al. 22 and Song et al. 23 conducted research on energy absorption characteristics of perforated CFRP square tube structures. Xiao et al. 24 carried out experimental and numerical study of CFRP hat-shaped structures under quasi-static axial crushing. Liu et al. 25 investigated the energy absorption of CFRP bio-inspired multi-cell square tubes under quasi-static axial crushing. Zhu et al. 11 executed numerical study on CFRP thin-walled tubes with different sectional profiles subjected to quasi-static crushing, including triangle, square, pentagon, hexagon and circle, etc.
Nevertheless, to date, the crashworthiness research of CFRP thin-walled structures mainly focused on structures with constant or linearly variable sectional dimensions along the longitudinal direction, such as conventional straight tubes (STs) or conical tubes (CTs). To be the authors’ best knowledge, basically there have not been any related reports concerning CFRP thin-walled structures with variable sectional dimensions along the longitudinal direction in a nonlinear gradient, which however possess better designability and thus greater potential as superior energy absorbers due to introduction of functional gradient.26–29 In addition, most existed studies concerning crashworthiness of CFRP thin-walled structures focused merely on a single load direction, ignoring the uncertainty of load angles which affects crashworthiness largely, as exampled in Figure 1 with thin-wall structures of the vehicle body under multi-angle crushing loading in actual vehicle collisions.29–31
Hence to make up for the above deficiency, the present study first proposes a novel CFRP functionally-graded conical square tube (FGCST) with variable circumscribed diameters along the longitudinal direction, for which a comprehensive crashworthiness comparison, a parameter study and a multi-objective crashworthiness optimization are carried out in succession. Specifically, the finite element (FE) models of FGCST under multi-angle crushing loading are first built and validated. Second, a comprehensive crashworthiness comparison among the FGCST, the conventional CFRP conical square tube (CST) and the CFRP straight square tube (SST) under multi-angle crushing loading is executed to explore the relative merits of FGCST over others. Third, a parameter study is implemented on FGCST to explore the action laws of its structural parameters on its overall crashworthiness under multi-angle crushing loading. Finally, the FGCST is multi-objective crashworthiness optimized for maximizing overall specific energy absorption (SEAθ) and minimizing overall peak crushing force (PCF0) simultaneously through Taguchi method coupled with grey relational analysis (GRA).
Geometric configuration
Unlike the conventional straight square tube (SST) or conical square tube (CST) with simply straight walls, the proposed novel FGCST is characterized by functionally-graded circumscribed diameter along its longitudinal direction, thereby presenting either straight or curved tube wall depending on the gradient exponent. Figure 2(a) illustrates the geometrical configuration and boundary conditions of FGCST under multi-angle (axial and oblique) crushing loading. In the axial (or longitudinal) direction, the circumscribed diameter of FGCST varies continuously according to a predefined gradient function, while the wall thickness keeps uniform. Specifically, the circumscribed diameter variation of FGCST along the axial direction can be defined through the following power-law function32,33:

where

FGCST under multi-angle crushing loading: (a) geometric diagram of FGCST and (b) variation modes of circumscribed radius.
To improve load uniformity and resist oblique loads, the circumscribed radius at the top end face of FGCST is set less than or equal to that at the bottom end face (
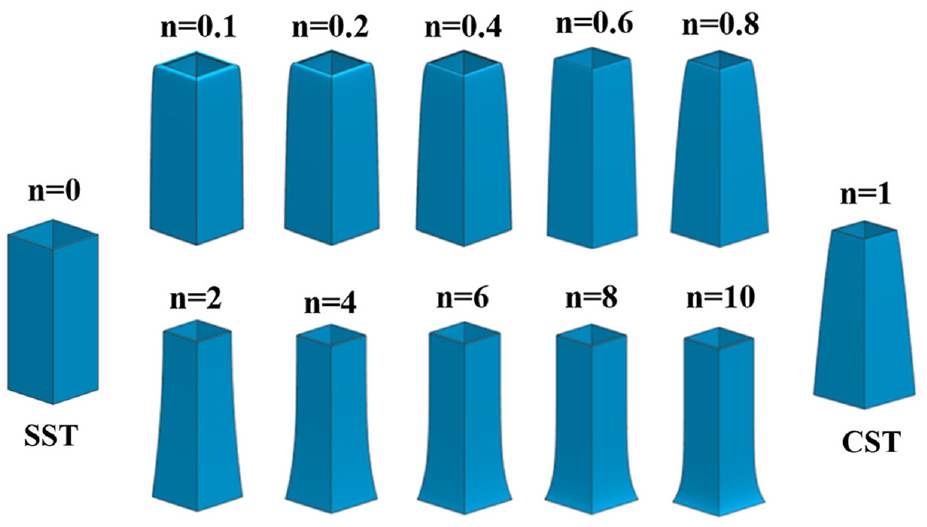
FGCSTs with different gradient exponent n.
Finite element modeling and verification
Constitutive models
The finite element (FE) models in the present study are developed using FE code ABAQUS. To capture intra-laminar and inter-laminar failure details of CFRP thin-walled structures simultaneously with a relatively simple constitutive relation yet high computational efficiency, the macro-mechanical modeling approach of stacked shell is adopted to monitor the crushing behaviors of FGCST under multi-angle crushing loading. 11 Specifically, the intra-laminar failure mechanism is relevant to the fiber damage and matrix cracking, while the inter-laminar failure mechanism is connected with the delamination failure between the layers. The constitutive models applied for modeling the intra-laminar and inter-laminar failure mechanisms are outlined as follows. 11
Intra-laminar failure
The intra-laminar failure model of CFRP material is actualized through a user defined material subroutine VUMAT, in which the fiber damage under tensile or compressive loading and plastic deformation under shear loading are involved. The model is composed of several material properties and damage parameters. For plain woven fabric reinforcements with orthogonal fiber directions considered in the present study, the intra-laminar stress-strain relation can be expressed as11,35:

where subscript 1 and subscript 2 represent the fiber longitudinal direction and transversal direction, respectively;
The initiation and evolution of the individual damage mechanisms are described by means of the corresponding effective stress

where
In any given time, the elastic domain can be defined in terms of the damage activation function F
i+
, F
i−
and F12 as follows (

where
Once the fiber appears initial damage, then the degradation of fiber properties would take place according to the damage evolution law, which could be expressed as follows11,35:

where


As for the evolution of shear damage, it can be defined as:

where

The damage thresholds,
The in-plane shear response of the material is dominated by the plastic behavior due to the matrix micro-cracking. To account for this, a plasticity model with a yield function and a hardening law is employed as follows11,35:


where
Table 1 presents the material parameters of CFRP, including the elasticity constants, the tensile and compression strengths that generally obtained by uniaxial tensile and compressive tests, as well as the in-plane shear response parameters that normally obtained through in-plane shear test. Table 2 gives the critical fracture energy for intra-laminar damage evolution. In the present study, all these above parameters to establish the intra-laminar failure model are referred to Zhu et al., 34 where the similar material is used.
Material parameters of CFRP. 34

The critical fracture energy for intra-laminar damage evolution. 34

Inter-laminar failure
In order to monitor the adhesion and debonding of adjacent plies of CFRP, a bonding model based on the generalized traction-separation law including corresponding damage criterion and evolution is adopted to define the cohesive zone. The behavior of its elastic phase can be described by the following formula11,35:

where
To describe the initiation of delamination damage, a quadratic interaction function is employed as11,35:

where

where
Inter-laminar damage parameters. 4

Finite element (FE) modeling
The FGCST is placed on a fixed lower plate with the bottom end fully constrained, while the top end is compressed by a moving upper plate at an initial velocity of 2 m/s from variable multiple loading angles (0°, 10°, 20°, 30°). Note that in the numerical simulation a relatively higher loading rate is used in order to balance computational efficiency and accuracy. Both the lower and upper plate are modeled as rigid surfaces. To accurately simulate the crushing behaviors of FGCST, the multi-layer shell element (S4R) is employed to model the CFRP layers, and the cohesive zone element (COH3D8) is utilized to model the bonding between the layers. To improve computational efficiency, the FGCST is meshed with an element size of 1.0 × 1.5 mm, which is sufficient to predict the crushing behaviors of CFRP tube. The material properties and parameters for defining the intra-laminar and inter-laminar failure models are listed in Tables 1 to 3, which are employed by a built-in subroutine of ABAQUS to simulate the crushing behaviors of the CFRP tube. The contact between the tube and the pressing plate is simulated using the general contact with friction coefficient of 0.3. 34 Figure 4 demonstrates the finite element models of FGCSTs under multi-angle crushing loading.
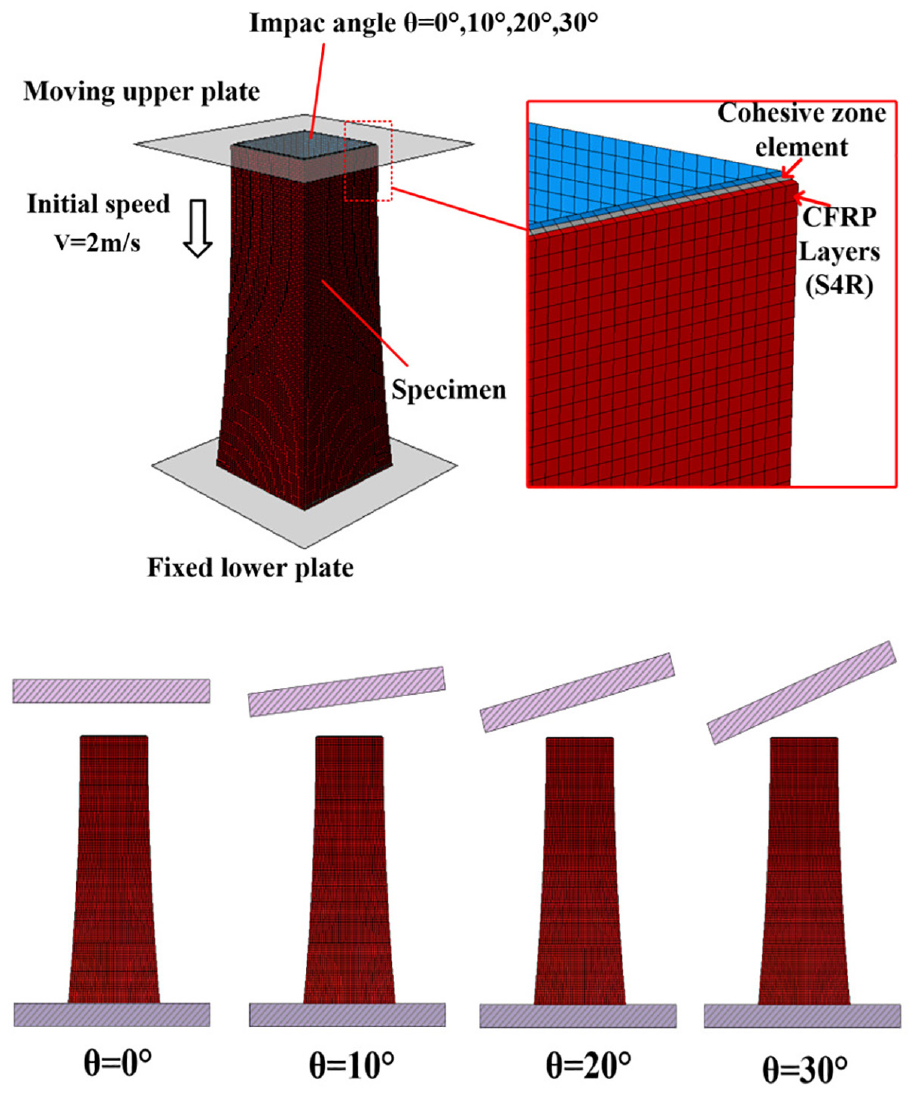
Finite element models of FGCST under multi-angle crushing loading.
Verification of FE models
As mentioned earlier, the FGCST will degenerate to a conventional straight square tube (SST) when the grading exponent n equals 0, in turn, the SST can be regarded as a special case of FGCST. Therefore, the SST could be selected to perform experimental verification of FE models for FGCST. Toward this end, Figure 5 demonstrates the geometric configuration of experimental specimen of SST by Zhu et al. 34 and corresponding FE model built in the present study. The SST is composed of six layer of plain woven CFRP laminates with each layer a uniform thickness of 0.235 mm, and possesses a height of 100 mm and a side length of 55.89 m. Figure 6(a) compares the crushing force versus displacement curves of the experimental test 34 and FE simulation, in which the simulation curve can basically captures the experimental counterpart concerning amplitude and trend throughout the crushing stroke. Besides, the comparison of final deformation mode between experiment and simulation is also presented in Figure 6(b), from which it is easily seen that the final deformation mode of simulation basically agrees with that of experiment. To sum up, the FE models developed in the present study are of acceptable accuracy and provide considerable confidence for us to further investigate and optimize the crashworthiness of FGCST under multi-angle crushing loading.

Experimental specimen and FE model of SST. 34

Crashworthiness comparison between experiment 34 and simulation: (a) force-displacement curve and (b) final deformation mode.
Crashworthiness analysis and comparison
Crashworthiness indicators
To evaluate the crashworthiness of FGCST under multi-angle crushing loading, the following conventional crashworthiness indicators are used, including energy absorption (EA), specific energy absorption (SEA), peak crushing force (PCF) and mean crushing force (MCF). Specifically, EA denotes the absorbed energy of structures via deformation, which demonstrates the total capacity for energy absorption. Specific energy absorption (SEA) denotes the energy absorption per unit mass, which measures the energy absorption capacity of material. PCF denotes the maximum instantaneous crushing force along the crushing process, which generally measures the load severity of crushing. MCF denotes the average instantaneous crushing force along the crushing process, which could be employed to evaluate the average energy absorption capability on the past crushing stroke. The above crashworthiness indicators, as shown in Figure 7, could normally be calculated as follows:

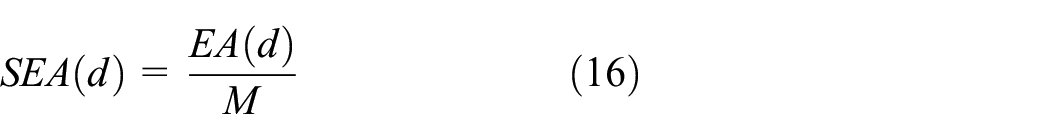


where

Schematic diagram of crashworthiness indicators.
Nevertheless, due to the uncertainty of vehicle collision direction, vehicle body thin-walled structures may withstand crushing loads from different angles, which could largely affect the value of energy absorption. Hence, taking into account the effect of different loading angles, two overall crashworthiness indicators, namely


where
Generally, under multi-angle crushing loading scenarios, the overall or weighted EA (
Crashworthiness analysis of FGCST
Numerical crashworthiness analyses are carried out based on the validated FE models to investigate the crushing and energy absorption behaviors of FGCSTs under multi-angle crushing loading. Herein, four typical loading angles, namely 0°, 10°, 20°, and 30° are considered. For FGCSTs with gradient exponent n greater than or equal to 1, a chamfer with an unilateral angle of 45° is added at the edges of their top end face in order to trigger a relatively more stable form of fragmentation. In contrast, for FGCSTs with gradient exponent n less than 1, no chamfer is added due to they present an arc structure, which is already conducive to triggering stable form of fragmentation. The crushing force versus displacement curves of FGCSTs with different n under multi-angle (0°, 10°, 20°, and 30°) crushing loading are depicted in Figure 8, and the corresponding final deformation modes of FGCSTs are demonstrated in Table 4.

Force-displacement curves of FGCSTs under multi-angle crushing loading: (a) 0°, (b) 10°, (c) 20°, and (d) 30°.
Final deformation modes of FGCSTs with different n.
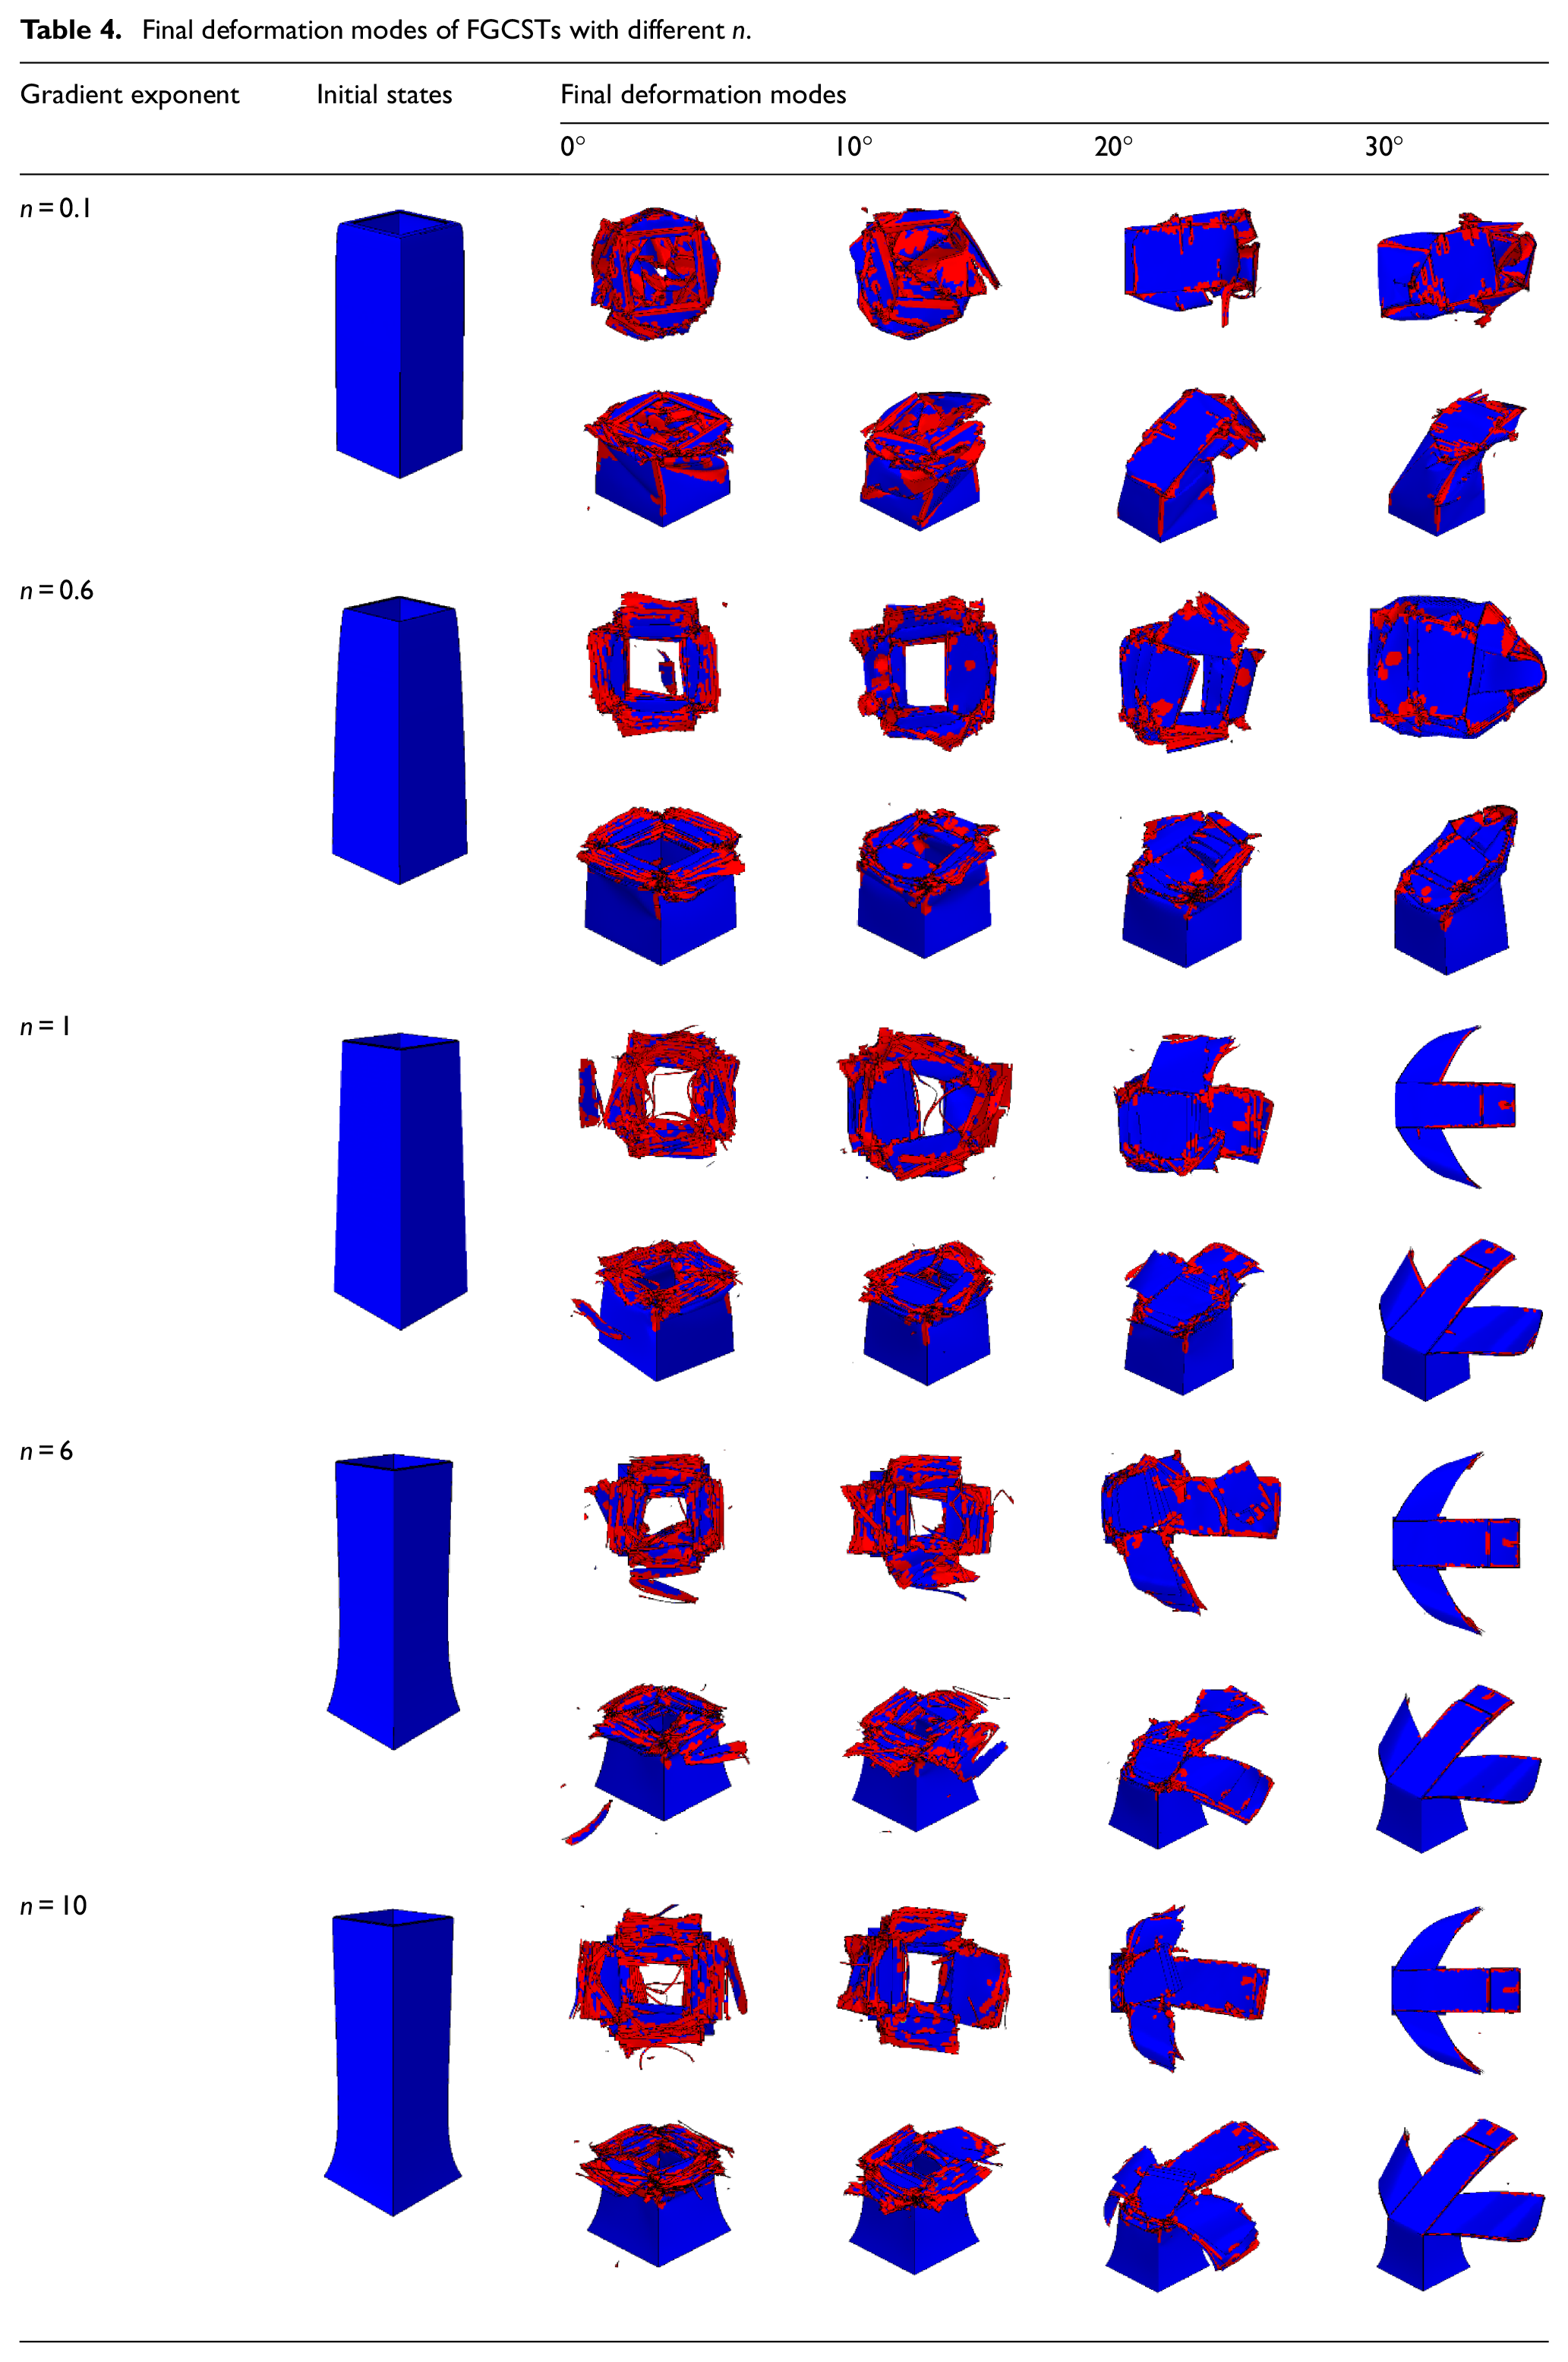
It can be seen that: (1) For most FGCSTs with different gradient exponent n, the crushing forces present not so large initial peak values, followed by alternating oscillations with relatively large global mean values, namely MCFs, which are different from conventional meta-tubes yet beneficial for energy absorption. (2) The FGCSTs with n less than 1 present relatively larger global MCFs compared with that of counterparts with n greater than or equal to 1, which could also be reflected by the final deformation modes in Table 4. It can be seen that progressive fragmentation accompanied by collapse folding and local bending relatively beneficial for energy absorption are dominant for the former, while progressive fragmentation accompanied by overall bending and four-corner cracking relatively adverse to energy absorption are dominant for the latter. (3) For all FGCSTs with different gradient exponent n, the MCF decreases along with increasing crushing loading angles, indicating the deterioration of energy absorption. This could also be reflected by the final deformation modes, which change from progressive fragmentation dominated deformation to overall bending and four-corner cracking dominated deformation with increasing crushing loading angles.
Crashworthiness comparison
In this section, a comprehensive crashworthiness comparison among the novel FGCST, the conventional CST and SST under multi-angle crushing loading is carried out to explore the relative merits and demerits of FGCST over others.
Configuration relationship of different tubes with equal mass
To objectively compare the crashworthiness of FGCST, CST and SST, it is necessary to ensure equal mass of them. To this end, it is critical to derive the geometrical relationship among them to obtain equal mass (or volume). Herein, for all above CFRP tubes, including FGCST, CST, and SST, the tube walls are composed of four layer of plain woven carbon fiber laminates with each layer a thickness of 0.25 mm, and have an identical length (L) of 150 mm and thickness (t) of 2 mm. Thus, based on the geometric parameters of FGCST shown in Figure 9, the volume of the FGCST (shadowed)

where

Illustration of cross section area for FGCST.
Likewise, based on geometric parameters of CST and SST shown in Figure 10, the volume of CST (


where
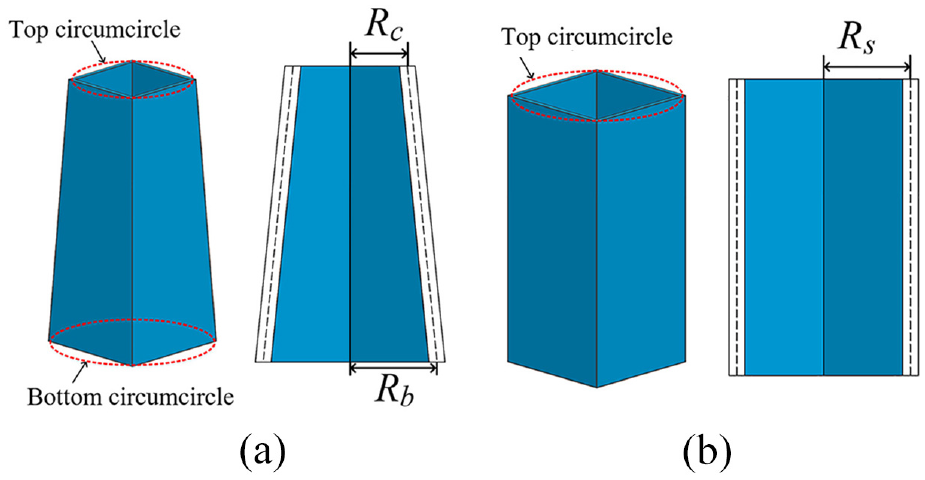
Illustration of equivalent circumscribed radius for CST and SST: (a) CST and (b) SST.
Let


According to equations (24) and (25), given specific geometrical parameters of FGCST and gradient exponent n, the equivalent top circumscribed radius (
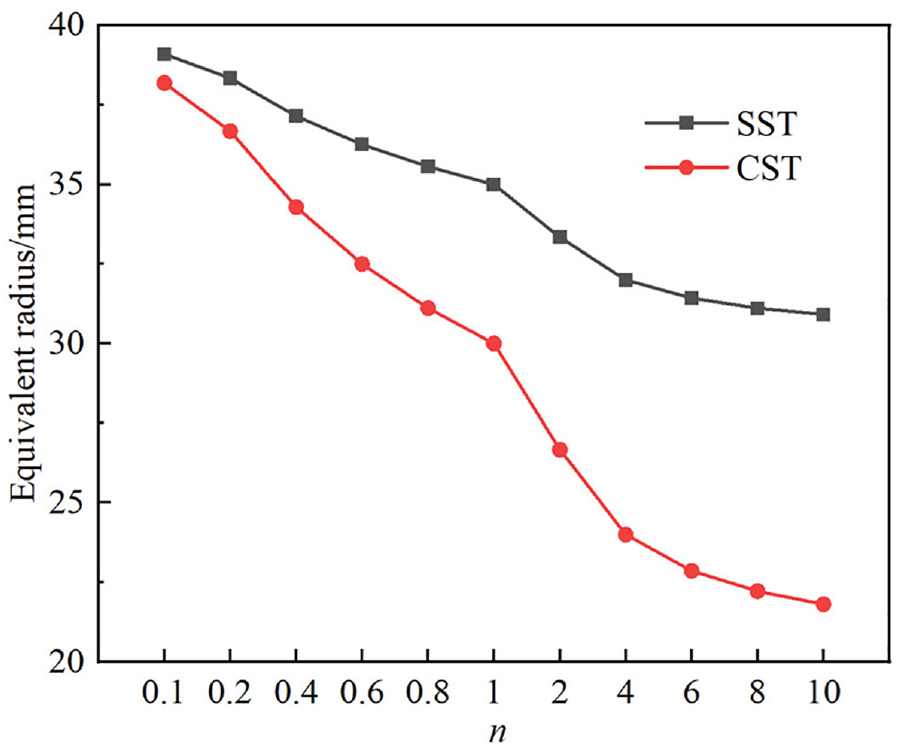
Equivalent circumscribed radius of CST and SST with different n.
Comparison between FGCST and CST
Figure 12 compares the crashworthiness indicators of FGCST and CST under multi-angle (0°, 10°, 20°, 30°) crushing loading, including specific energy absorption (SEA) in Figure 12(a) and peck crushing force (PCF) in Figure 12(b). It can be seen that when n is less than 1, with all values of gradient exponent n, the SEA under all loading angles of FGCST are relatively larger than that of CST, meanwhile, the PCF under axial (0°) crushing loading (PCF0) of FGCST are relatively smaller than that of CST. When n is greater than 1, with all values of gradient exponent n, the SEA under most loading angles of FGCST are relatively larger than that of CST, while with most values of gradient exponent n (n = 6,8,10), the PCF under axial (0°) crushing loading (PCF0) of FGCST are even relatively larger than that of CST. Of course, the FGCST is CST when n is equal to 1, which needs no discussion. To conclude, on the whole, the novel FGCST outperforms the CST in terms of multi-angle crashworthiness when n is less than 1, while there is no absolute advantage or disadvantage between FGCST and CST in terms of multi-angle crashworthiness when n is larger than 1, which depends on the value of n and the emphasis of SEA or PCF.

Comparison of SEA and PCF between FGCST and CST with equal mass: (a) SEA and (b) PCF.
Comparison between FGCST and SST
Figure 13 compares the crashworthiness indicators of FGCST and SST under multi-angle (0°, 10°, 20°, 30°) crushing loading, including specific energy absorption (SEA) in Figure 13(a) and peck crushing force (PCF) in Figure 13(b). It can be seen that when n is less than 1, with all values of gradient exponent n, the SEA under most loading angles of FGCST are relatively larger than that of SST, meanwhile, the PCF under axial (0°) crushing loading (PCF0) of FGCST are relatively smaller than that of SST. In contrast, when n is greater than or equal to 1, with all values of gradient exponent n, the SEA under all loading angles of FGCST are relatively smaller than that of SST, meanwhile, the PCF under axial (0°) crushing loading (PCF0) of FGCST with partial values of gradient exponent n (n = 8, 10) are even relatively larger than that of SST. To conclude, on the whole, the novel FGCST outperforms the SST in terms of multi-angle crashworthiness when n is less than 1, while it underperforms the SST in terms of multi-angle crashworthiness when n is greater than or equal to 1.

Comparison of SEA and PCF between FGCST and SST with equal mass: (a) SEA and (b) PCF.
Parameter study
In order to better understand the energy absorption characteristics of FGCST, the effects of structural parameters of FGCST on its crashworthiness under multi-angle crushing loading are further studied. Considering the effect of gradient exponent n has been analyzed, another two structural parameters, namely the difference between top and bottom circumscribed radius (Δ
Effect of difference between top and bottom circumscribed radius (ΔR)
For FGCST, set the gradient exponent n to 2 and keep the circumscribed radius of the bottom end face (

Crashworthiness indicators of FGCST with different Δ
Final deformation modes of FGCSTs with different ΔR.
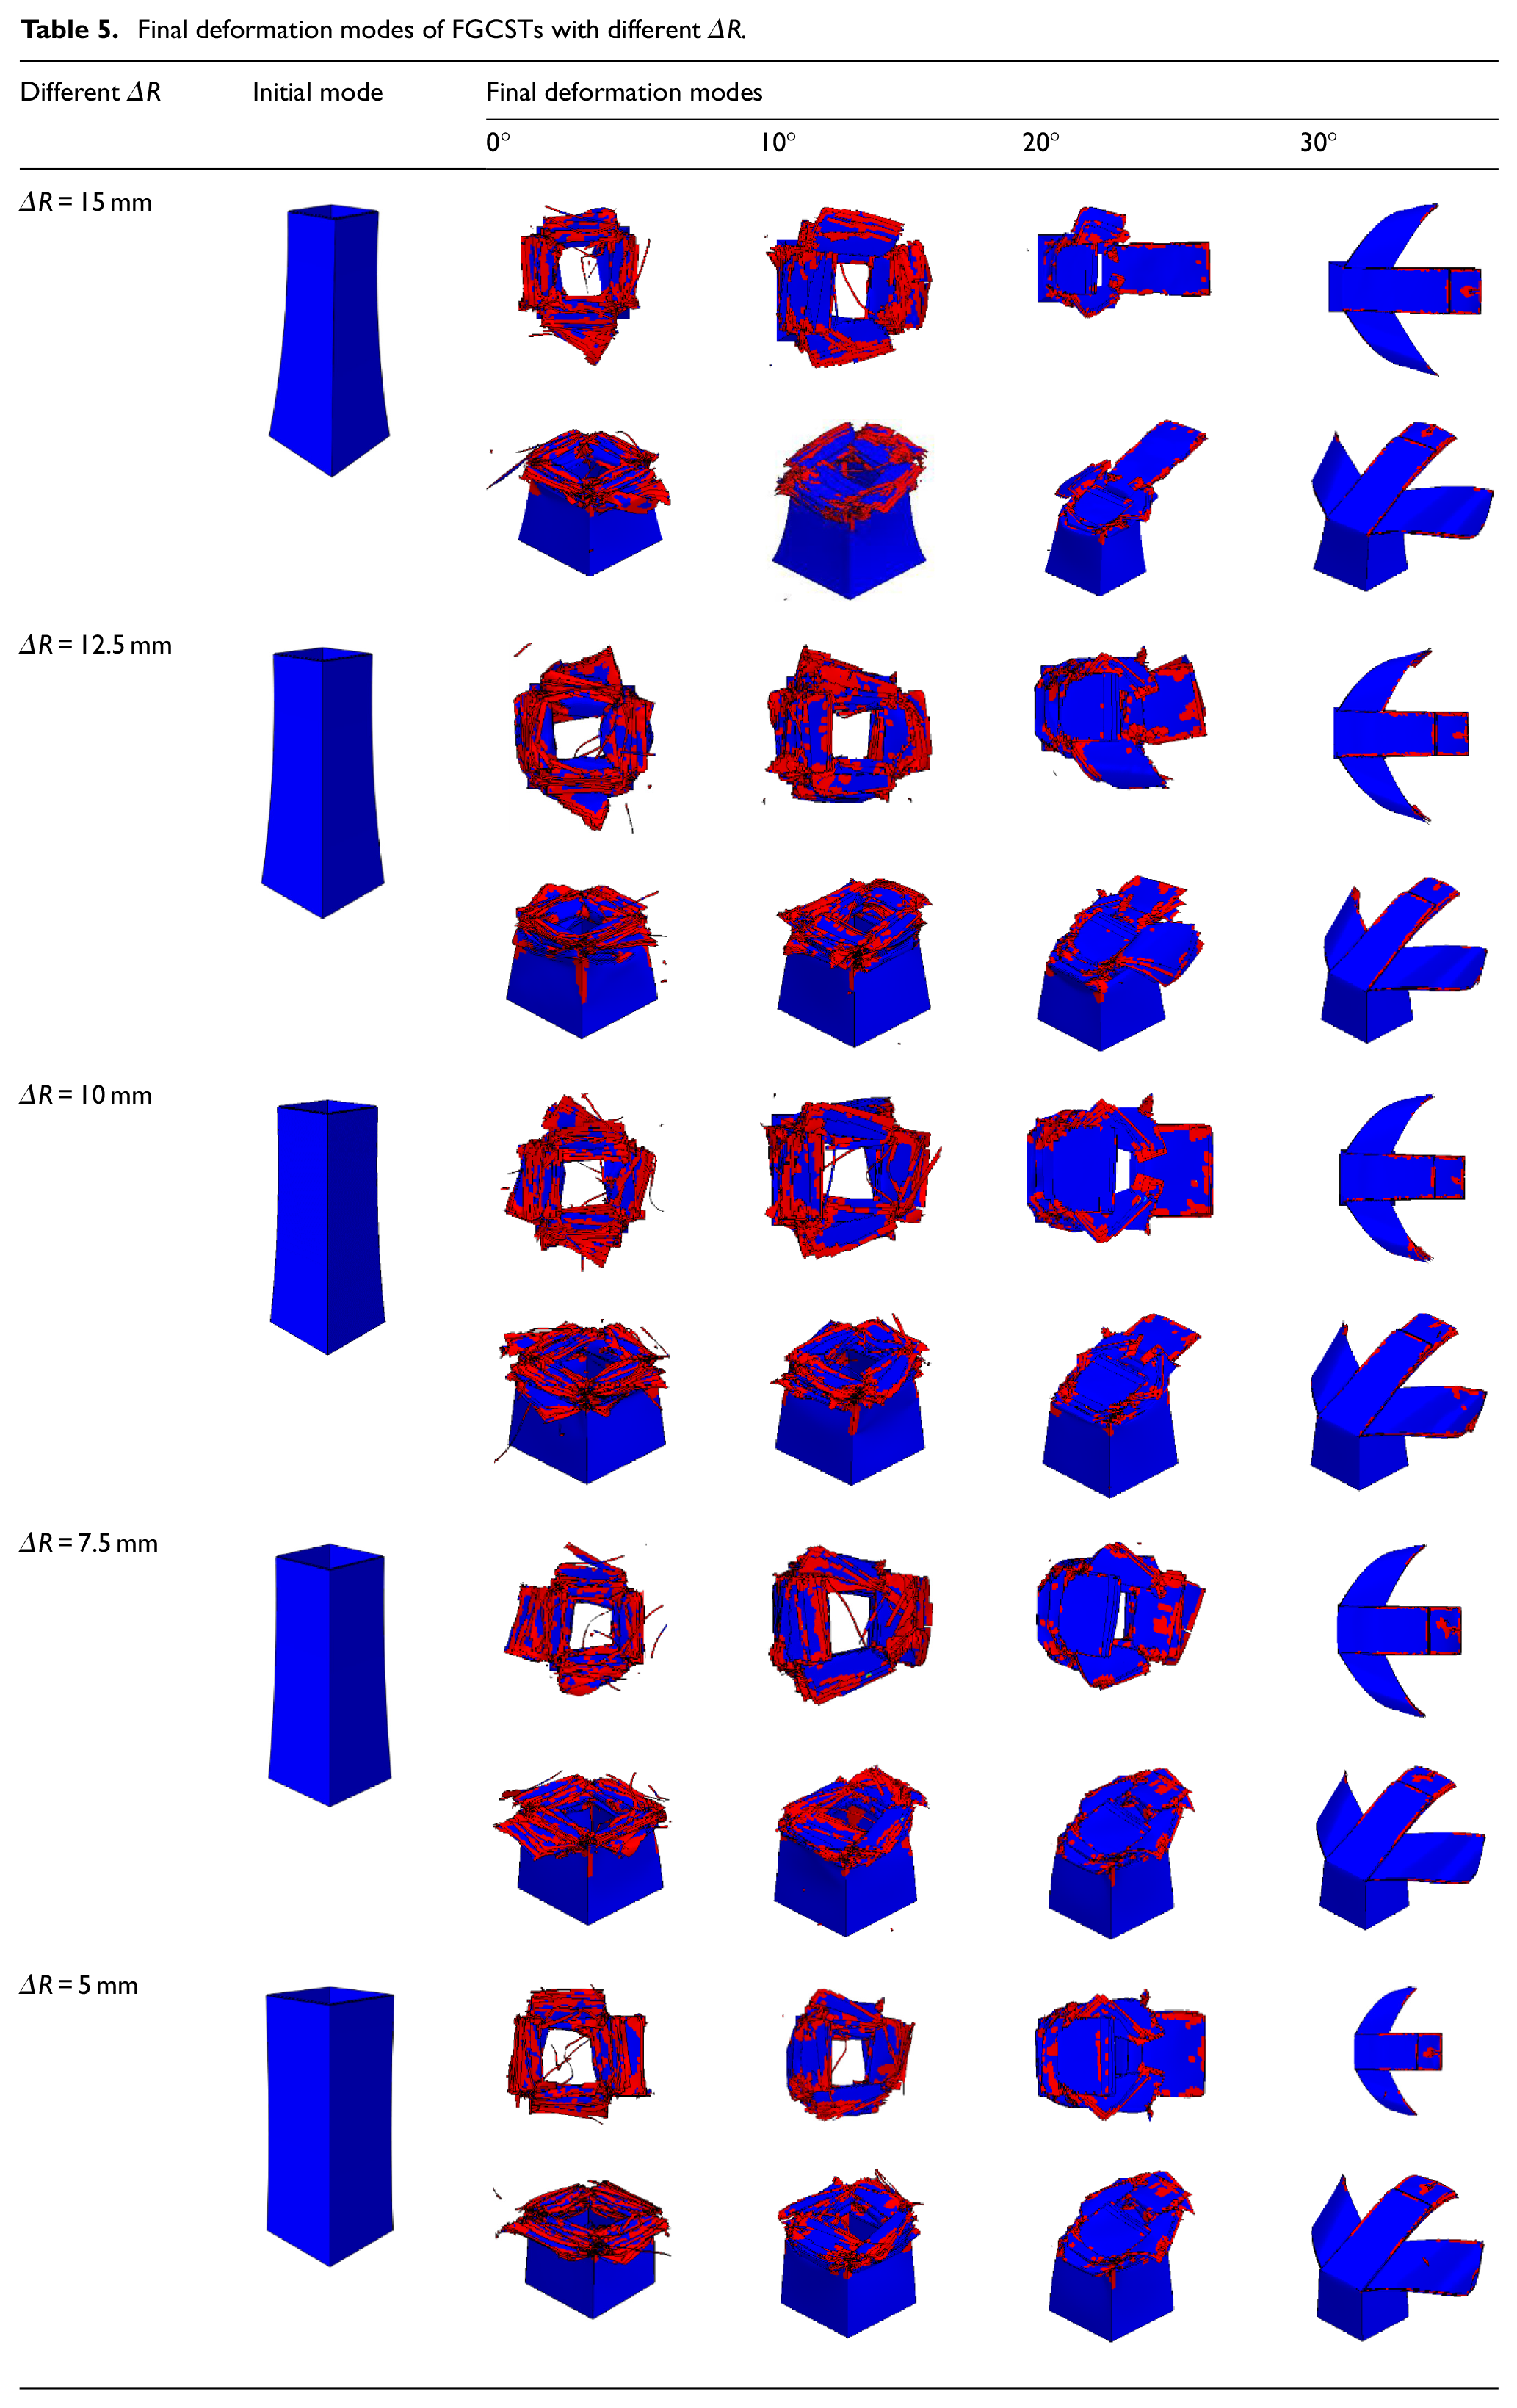
These might also be reflected by the final deformation modes in Table 5, where it can be seen that for all FGCSTs with different Δ
Effect of number of (45°/−45°) layers (N)
The layer structure of CFRP laminates, particularly the layer angle, could has a significant impact on the crashworthiness of CFRP thin-walled structures like FGCST under multi-angle crushing loading. To explore this, assume the FGCST has such layer structure as (0°/90°)(4-N) (45°/−45°) N , where N denotes the number of (45°/−45°) layers and is taken as parameter variable varying between 0 and 4. Except for this, the remaining structural parameters are consistent with the baseline design. Then the crashworthiness indicators of FGCST with different layer structures, namely N, under multi-angle crushing loading are compared as shown in Figure 15, and corresponding final deformation modes are also compared in Table 6. It can be seen that for FGCST with any number of (45°/−45°) layers (N), both EA and PCF decrease along with increasing crushing loading angles on the whole, which once again confirms the change of crushing loading angle could significantly affect the energy absorption. In contrast, the effects of layer structure on the EA and PCF under multi-angle crushing loading are more sophisticated. On the whole, the FGCST with larger number of (45°/−45°) layers (N) tends to present relatively higher EA and PCF under crushing loading angles of 0° and 30°, while it tends to present relatively lower EA and PCF under crushing loading angles of 10° and 20°, indicating the effect of number of (45°/−45°) layers (N) on crashworthiness varies with crushing loading angle.

Crashworthiness indicators of FGCSTs with different N: (a) EA and (b) PCF.
Final deformation modes of FGCSTs with different N.

These might also be reflected by the final deformation modes in Table 6, where it can be seen that for all FGCSTs with different N, the final deformation modes transform from approximately progressive fragmentation under axial (0°) loading to approximately overall bending with four-corner splitting under 30° crushing loading, which inevitably results in a decrease in energy absorption similarly. As for FGCSTs with different N under any specific crushing loading angle, the effects of N on the final deformation modes vary with crushing loading angles and are relatively not so obvious. To sum up, the selection of the number of (45°/−45°) layers (N) in CFRP thin-walled structure designs depend on actual needs.
Multi-objective crashworthiness optimization of FGCST
To fully tap into the potential of FGCST for better overall crashworthiness under multi-angle crushing loading, it is necessary to explore optimization methods for it. In general, for energy absorbing thin-walled structures like FGCST, SEA is “larger-the-better (LTB)” to improve energy absorbing efficiency and capacity, while PCF is “smaller-the-better (STB)” to control load severity. However, as this article and many studies have revealed, SEA and PCF are generally competing or conflicting indicators, hence multi-objective optimization is suitable and necessary.36,37 Compared with many other proposed optimization methods, the Taguchi method, which adopts orthogonal experimental design and processes experimental data based on signal-to-noise ratio (SNR) that to be maximized, is relatively more efficient and simple to assess robustness of experiments and effects of factors on responses, as well as to explore optimal combination of factor levels. 38 Nevertheless, the traditional Taguchi method is normally limited to handling single-objective optimization issues, which is not suitable to address multi-objective crashworthiness optimization of FGCST in the present study. However, this limitation could be eliminated by coupling Taguchi method with grey relational analysis (GRA), due to GRA could convert multiple responses to a single response called grey relational grade (GRG), which represents the relative closeness of a candidate to the ideal referential alternative and generally is “larger-the-better (LTB).” Consequently, this paper carries out multi-objective crashworthiness optimization of FGCST under multi-angle crushing loading using Taguchi method coupled with grey relational analysis (GRA).
Taguchi-GRA method
Step 1: Taguchi experimental design
For multi-objective crashworthiness optimization of FGCST in the present study, the aforementioned three structural parameters, including the gradient exponent (n), the difference between top and bottom circumscribed radius (Δ

Obviously, m varies between (−1, 1) along with n varying between (0.1, 10). Therefore, herein the top circumscribed radius (Rt or TCR), the normalized gradient exponent (m or NGE) and the number of (45°/−45°) layers (N or NL) are selected as three design factors and for each factor four levels are assigned, thus a L16(43) orthogonal array (OA) could be built. Table 7 demonstrates design variables and corresponding levels, which are set according to parameter values of baseline design of FGCST, as boldly marked in the table and abbreviated as R2-m3-N1, namely Rt = 30 mm, m = 0.301 (or n = 2), N = 0. Considering multi-angle crushing scenarios, the overall SEA (SEAθ) is taken as one response (or objective), while the PCF under 0° crushing loading (PCF0) is taken as an another based on the fact that PCF of FGCST generally obtains maximum under pure axial (0°) crushing loading, as disclosed before. Table 8 displays the constituted table for Taguchi experimental design and corresponding experimental results.
Design variables and corresponding levels.

Experimental results and corresponding SNRs.

Step 2: Signal-to-noise ratio (SNR)
After the Taguchi experimental design has been accomplished and the experimental response for each experiment has been counted, the signal-to-noise ratio (SNR), which measures the magnitude of the mean of a process compared to its variation, is used to assess the response performance according to the response characteristics. In general, for a response with “larger-the-better (LTB)” characteristic, the corresponding SNR could be calculated using equation (27), while for a response with “smaller-the-better (STB)” characteristic, the corresponding SNR could be calculated using equation (28) 38 :


where
For multi-objective crashworthiness optimization of FGCST in the present study, two competing or conflicting objectives, namely SEAθ and PCF0, are selected to measure and optimize the overall crashworthiness of FGCST under multi-angle crushing loading. Evidently, the SEAθ is “larger-the-better (LTB)” to improve overall energy absorption, while PCF0 is “smaller-the-better (STB)” to control overall load severity. Hence, the SNR of SEAθ (called SNR1) could be calculated using equation (27), while SNR of PCF0 (called SNR2) could be calculate using equation (28). The SNR1 for SEAθ and SNR2 for PCF0 are calculated and demonstrated in Table 8.
Step 3: Grey relational analysis (GRA)
To overcome the hinder of traditional Taguchi method on handling multi-objective optimization, the GRA is integrated to transform the multiple responses to a single grey relational grade (GRG) that to be maximized. The specific steps are as follows:
(1) Grey relational generation.
The experimental data sequence are first transformed to a uniform range of [0,1] through normalization, which is called grey relational generation. In general, the normalization methods vary according to response characteristics. For a response with “larger-the-better (LTB)” characteristic 39 :

Else, for a response with “smaller-the-better (STB)” characteristic:

where
(2) Grey relational coefficient (GRC)
Then, the GRC

where
(3) Grey relational grade (GRG)
At last, the grey relational grade (GRG) measuring the correlation of current experiment and the ideal solution can be obtained by averaging the GRC of multiple responses as:
Nevertheless, taking the difference of response preference or significance into account, different weights are assigned to different responses to calculate the weighted GRG:

where
In the present study,
Step 4: Main effect and interaction effect analyses
With the help of GRA, the multi-objective crashworthiness optimization of FGCST has now been transformed to a single-objective optimization of GRG, which then could be addressed by Taguchi analysis to explore the optimal combination of factor levels. To be more specific, the average response value of GRG for each factor level is first calculated, then the main effect value of each factor on GRG is obtained by computing the difference between the maximum and minimum average GRG of all factor levels, which could be described as follows:


where
Commonly, the average response value of each factor level (
Results and discussion
Table 8 demonstrates the Taguchi experimental results, as well as calculated SNR of SEAθ (SNR1) using equation (27) and SNR of PCF0 (SNR2) using equation (28) for each experiment. Table 9 demonstrates the response table for SNR1 of SEAθ, while Table 10 demonstrates that for SNR2 of PCF0. For a certain factor, the mean of SNR at a certain level stands for the overall average value of SNR for all experiments with this specific level, while the Delta which is the maximum difference among different levels, represents the main effect value of this factor on SNR. In general, a factor with a higher Delta value among the factors signifies a relatively larger influence on the response over others. Consequently, according to Table 9, the most influential factor on SNR1 (or SEAθ) is the top circumscribed radius (Rt), followed by the normalized gradient exponent (m) and finally the number of (45°/−45°) layers (N). In contrast, according to Table 10, the most influential factor on SNR2 (or PCF0) is normalized gradient exponent (m), followed by the top circumscribed radius (Rt) and at last the number of (45°/−45°) layers (N). These could also be concluded from the main effect plots of factors on SNR1 of SEAθ and SNR2 of PCF0, as shown in Figure 16, from which the rank of influence of factors on SNR of responses could be determined by comparing the slopes of the lines. In addition, the main effect plots could be employed to determine the optimal combination of factor levels for each response. Specifically, for maximizing SNR1 (namely maximizing SEAθ), the optimal combination of factor levels is R1-m2-N3 (namely Rt = 27.5 mm, m = 0 (or n = 1) and N = 2), as boldly marked in Table 9. In contrast, for maximizing SNR2 (namely minimizing PCF0), the optimal combination of factor levels is R2-m1-N4 (namely Rt = 30 mm, m = −0.301 (or n = 0.5) and N = 3), as boldly marked in Table 10.
Response table for SNR1 of SEAθ.

Response table for SNR2 of PCF0.


Main effect plots of factors on SNR1 of SEAθ and SNR2 of PCF0: (a) mean of SNR1 and (b) mean of SNR2.
Figures 17 and 18 demonstrate the interaction effect plots of design factors on SNR1 of SEAθ and SNR2 of PCF0, respectively, based on which whether the interactions among design factors exert any influence on each response could be explored. An interaction plot is a plot of means for each level of a factor with the level of a second factor kept constant, which could be used to assess the two-way interactions among factors on the responses. Specifically, if the lines are parallel then there is no interaction, otherwise there is, and the greater the lines deviate from being parallel, the larger the interaction. Obviously, no matter on SNR1 or SNR2, interaction effects are observed between either two of the three factors (Rt, m, and N), and they differ from each other.

Interaction effect plots of factors on SNR1.

Interaction effect plots of factors on SNR2.
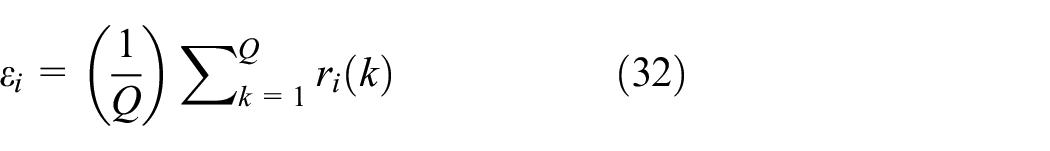
As disclosed above, the optimal combination of factor levels for maximizing SEAθ (R1-m2-N3) entirely differ with that for minimizing PCF0 (R2-m1-N4), while the FGCST is desired to be manufactured with a specific level of design parameters to obtain optimal SEAθ and PCF0 simultaneously, which can not be addressed by traditional Taguchi method limited to optimize a single response at a time. Thus, to promote the multi-objective crashworthiness optimization of FGCST, the grey relational analysis (GRA) is employed herein to convert the two competing responses (SEAθ and PCF0) to a single one, that is, grey relational grade (GRG) that to be maximized (LTB). For this purpose, the gray relational generation for SEAθ using equation (29) and PCF0 using equation (30), the grey relational coefficient (GRC) using equation (31) and grey relational grade (GRG) using equations (32) or (33) are obtained and demonstrated in Table 11. Likewise, the response table for GRG is calculated and demonstrated in Table 12, from which it can been seen the most influential factor on GRG is normalized gradient exponent (m), followed by top circumscribed radius (Rt) and finally the number of (45°/−45°) layers. In addition, the main effect and interaction effect plots for GRG are shown in Figures 19 and 20, respectively. It can be seen from Figure 19 that the optimal combination of factor levels for GRG is R2-m1-N2 (namely Rt = 30 mm, m = −0.301(n = 0.5), N = 1), as boldly marked in Tables 11 and 12. Besides, strong interaction effect on GRG is similarly observed among either two of the three factors.
Grey relational coefficient (GRC) and grey relational grade (GRG).

Response table for GRG.


Main effect plots of factors on GRG.

Interaction effect plots of factors on GRG.
Verification of optimization results
Since the optimal combination of factor levels, as well as corresponding structural parameters of FGCST for better overall crashworthiness (SEAθ and IPCF0) is obtained, the next step is to verify the effectiveness of the optimization results. Specifically, a detailed crashworthiness comparison among the optimized design (R2-m1-N2, namely Rt = 30 mm, m = −0.301 (or n = 0.5), N = 1) and the baseline design (R2-m3-N1, namely Rt = 30 mm, m = 0.301 (or n = 2), N = 0) of FGCST under multi-angle crushing loading is conducted.
Table 13 demonstrates the comparison of crashworthiness indicators before and after optimization, including SEA and PCF under individual angle crushing loading (0°, 10°, 20°, 30°), and the overall SEA (SEAθ) and PCF(PCF0) under multi-angle crushing loading. Evidently, the SEAs under individual angle crushing loading have been improved by different percentages, among which the largest is 32.01% (30°), followed successively by 2.78% (0°), 2.17% (20°) and 1.62% (10°). Meanwhile, the PCFs under individual angle crushing loading present various change, with decrease by 40.58% (0°) and 5.05% (10°), as well as increase by 1.72% (20°) and 24.25% (30°). These changes under individual angle crushing loading could not only be more clearly observed according to Figure 21, but also be reflected by the comparison of final deformation modes in Table 14. For instance, it can be seen that under 30° angle crushing loading, the optimized design presents local bending accompanied by progress collapse on the upper part of the structure, which is more conducive to energy absorption compared with the baseline design with overall bending accompanied by four-corner cracking. Except for this, there is minor difference in final deformation modes between optimized design and baseline design under other angle crushing loading (0°, 10°, 20°), just as reflected by comparison of crashworthiness indicators in Table 13 and Figure 21. Nevertheless, taking multi-angle crushing loading (0°∼30°) into account, the overall SEA (SEAθ) is increased by 6.06%, meanwhile the overall PCF (PCF0) is decreased by 40.58%, indicating that the multi-objective crashworthiness optimization for FGCST is correct and effective.
Comparison of crashworthiness indicators before and after optimization.


Comparison of crashworthiness indicators before and after optimization: (a) SEA and (b) PCF.
Comparison of final deformation modes before and after optimization.

To sum up, the optimized FGCST presents more superior crashworthiness characteristics under multi-angle crushing loading compared with the baseline (or original) counterpart, thus demonstrating good potential as a superior candidate for energy absorbers especially under multi-angle crushing loading.
Conclusions
The present study proposes a novel CFRP functionally-graded conical square tube (FGCST), for which a comprehensive crashworthiness comparison, a detailed parameter study and a multi-objective crashworthiness optimization under multi-angle crushing loading are carried out in succession. Main findings are summarized as follows:
(1) The constructed finite element (FE) models of FGCST are of good accuracy with simulation results, namely crushing force versus displacement and final deformation modes, basically consistent with that of experiments. Therefore, the subsequent crashworthiness comparison and multi-objective optimization for FGCST based on FE models are reasonable and credible.
(2) Compared with conventional CST and SST, the novel FGCST demonstrates relative merits on crashworthiness. In particular, the FGCST with arc-shape (n < 1) exhibits better crashworthiness with lower PCF and similar SEA, demonstrating good potential as superior candidates for energy absorbers.
(3) According to parameter study, both the EA and PCF under any specific crushing loading angle approximately decrease with increasing Δ
(4) Compared with the baseline (or original) design, the optimized FGCST obtains 6.06% higher of SEAθ and 40.58% lower of PCF0 simultaneously, thus demonstrating good potential as a superior candidate for energy absorbers especially under multi-angle crushing loading. In addition, Taguchi method coupled with GRA could be an effective approach for handling similar multi-objective optimization issues.
Footnotes
Handling Editor: Chenhui Liang
Declaration of conflicting interests
The author(s) declared no potential conflicts of interest with respect to the research, authorship, and/or publication of this article.
Funding
The author(s) disclosed receipt of the following financial support for the research, authorship, and/or publication of this article: This work is supported by the National Natural Science Foundation of China (Grant No. 52202437), Youth Project of Science and Technology Research Program of Chongqing Education Commission of China (Grant No. KJQN202101111), Special Project for Scientific and Technological Talents of Chongqing Banan District (Grant No.2020TJZ021), Foundation of State Key Laboratory of Automotive Simulation and Control (No. 20210213), Foundation of State Key Laboratory of Automotive Safety and Energy (No. KFY2204), Research and Innovation Team Cultivation Plan of Chongqing University of Technology (2023TDZ013), Synchronous Implementation Project of Chongqing University of Technology (2023TBZ007). The authors would like to express their appreciation for the above fund supports.