
Abstract
The complexity of ice accretion shapes on aircraft brings challenges in establishing the physical correlations between the geometric parameters of ice and the aerodynamic performances of an airfoil. The present study applied a quarter-circle simplified ridge ice model and designed four parameters, including the lower ice horn, the height of the upper ice horn, the angle of the upper ice horn, and the location of the upper ice horn. Design of Experiments (DOE) was adopted to design the simulation process and analyze the obtained data. Numerical investigations were carried out to study the effects of these four design parameters on the lift coefficients (CL) and drag coefficients (CD) of three airfoils at various angles of attack. The results revealed that the four design parameters had influences on CL and CD in all simulation cases. The influence of the height of the upper ice horn was always dominant, followed by the angle and location of the upper ice horn. The influence degrees of the lower ice horn varied with the angles of attack and airfoils. The change trends of CL and CD were opposite while changing the value of any parameter in most simulation cases. In addition, the leading-edge radii of these three airfoils, as well as the shapes of the upper and lower surfaces, could alter the influences of design parameters on CL and CD.
Keywords
Introduction
Icing may occur on the windward side of the aircraft and engine, including the wing, windshield, rotor, tail rotor, engine intake device, instrument sensor, etc.1–4 A large number of tests have proved that a small amount of icing on the key parts of an aircraft can cause a considerable decrease in lift, an increase in drag, and a deterioration in maneuverability and stability. 5 Besides, the ice accretion in the intake port and power unit of the aircraft engine may induce fatal consequences such as engine damage and shutdown. At the same time, ice shedding might lead to internal engine damage. 6 In 1994, the famous Roselawn air crash in Indiana of USA revealed the existence of supercooled large droplet (SLD) icing condition.7,8 This accident brought the ridge ice to the attentions of the researchers. When the heated leading-edge ice-protected surface was not running at 100% evaporation, water flowed back on the surface from the heated section to freeze downstream on the cooler unheated surface, forming the ridge ice. Based on the ice geometries, the shapes of the ice can be divided into ridge ice, 9 horn ice 10 (usually produced in glaze ice conditions and had some horn-shaped protrusions), streamwise ice 11 (usually formed in rime icing conditions and appeared to be an extension of the airfoils), and so on. The ridge ice was found to cause a more striking aerodynamic deterioration than other ice shapes (e.g., horn ice or streamwise ice).
Considering the ice-tolerant design of the control surfaces of aircraft is a useful way to reduce the adverse effects of icing. Generally, a robust aerodynamic design of airfoil under ice accretion scenarios needs a better insight into the correlations between performance losses and icing conditions. There are many advantages of using simplified ice shapes to study the aerodynamic performance of airfoils. For example, it simplifies geometric modeling of the ice shape and lowers aircraft development costs. Therefore, it is of great research value and practical significance to develop a simplified ice shape that has similar influences on the airfoil as the original ice shape.
So far, a series of studies on the aerodynamic performances of ridge ice have been reported, which include flow field investigations and geometric simplifications. Miller and Addy12,13 recorded the icing photos of the ridge ice on the model with a pneumatic deicing system in the SLD icing test in the icing tunnel. The front area of the ridge ice was found to be relatively clean, with a certain inhomogeneity in the ridge direction. Lee and Bragg 14 studied the aerodynamic effects of simulated SLD ice accretion on a modified NACA 23012 airfoil with forward-facing quarter-round simulations. The height-to-chord ratio of the airfoil ranged from 0.0083 to 0.0139. They found that the simulated ice shape produced a large separation bubble as the real ice did. Moreover, Lee and Bragg 15 found that the variations in the simulated ice shape geometry had a considerable effect on the airfoil aerodynamics, with the half-round shape exhibiting a significantly higher lift coefficient. Dunn and Loth 16 predicted sectional aerodynamic characteristics for the quarter-round ice shape. Significant reductions in the lift were obtained for those relatively small protuberances, which was consistent with experimental findings. The results also showed a good predictive performance on drag, pitching-moment, and hinge-moment variations. Bragg and Loth 17 studied the different effects of ridge ice accretion on airfoil aerodynamics between airfoils NACA 23012m and NLF 0414. The results showed that the protuberance of ice affected the airfoil NLF 0414 very differently from the airfoil NACA 23012m, and the lift coefficient of the half-round shape was closer to that of the real ice. Lee, 18 Kumar and Loth 19 studied the airfoil lift, drag, pitching moment, and hinge moment with different chordwise locations, sizes, and shapes of the ridge ice simulations. By utilizing the Particle Image Velocimetry (PIV) technique, Gurbacki 20 found that the ridge ice and horn ice had a similar flow pattern. Lee and Bragg 21 found that increasing the ice-shape height generally resulted in more severe performance degradation. The exception was for the ice located at the leading edge of the airfoil. Meanwhile, the ice height no longer significantly degraded the aerodynamic performance once a critical height was reached.
In terms of numerical simulations, Pan and Loth 22 used the detached eddy simulation to improve the predictive ability of the stall behavior for an iced airfoil. The validation results were in good agreement with the experimental and previous numerical results concerning time-averaged aerodynamic forces as well as the unsteady flow pattern. Broeren et al. 23 presented the results of recent investigations on the aerodynamics of simulated runback ice accretion on airfoils and recorded the detailed geometrical shape and aerodynamic parameters of this ridge ice. In addition, Broeren et al. 24 reported the results of experimental studies which established a high-fidelity, full-scale, iced-airfoil aerodynamic performance database. Based on experimental data and previous studies, Li 25 numerically modeled the ridge ice of airfoil NACA23012. By using a forward quarter circle model, the aerodynamic changes caused by various ridge ice were studied. Pouryoussefi et al. 26 numerically investigated the aerodynamic behavior of three ice shapes proposed by Broeren et al. 23 They found that ridge ice had the most significant effects on the aerodynamics of an airfoil. Zhang et al. 27 numerically studied the relationship between the lift coefficient and flow field parameters. The results demonstrated that the zonal detached-eddy simulation model exhibited additional advantages compared to the Spalart-Allmaras turbulence model. Costes and Moens 28 further found that both the Spalart-Allmaras model and only the RANS model could effectively converge to a steady state, regardless of the flow conditions. Li et al. 29 developed a three-equation turbulence model, which proved to apply to a wide range of ice shapes. Mortensen et al. 30 compared different turbulence models by implementing the leading-edge icing calculation. The results showed that the S-A model worked best in coping with the aerodynamic force prediction.
The previous studies mainly focused on simplifying ridge ice into a forward quarter circle shape because the aerodynamics of this ridge ice was closer to the real ice. Some researchers compared the turbulence models used in the numerical simulations and found that the Spalart-Allmaras model performed better in this kind of study.27–30 However, previous studies mainly considered the effects of the height and the location of the ice horn,14–26 but ignored the lower ice horn. Moreover, few studies considered the effects of the same ridge ice shape on different airfoils. Thus, the present study numerically investigated the lift coefficients (CL) and drag coefficients (CD) of iced airfoils based on the forward quarter circle ridge ice with the Spalart-Allmaras model. In addition, the Design of the experiments (DOE) was adopted for the first time to design the simulation cases and analyze the obtained CL and CD. The influences of four design parameters (i.e., the height of the upper ice horn, the angle of the upper ice horn, the location of the upper ice horn, and the lower ice horn) of a ridge ice model on three airfoils (i.e., NACA23012, NACA64-215, and RAE2822) were carefully analyzed. The present study aimed to improve our understanding of the influences of ridge ice parameters on airfoils and propose some guidelines on ice shape simplification.
Methodology
Geometric model of the ridge ice
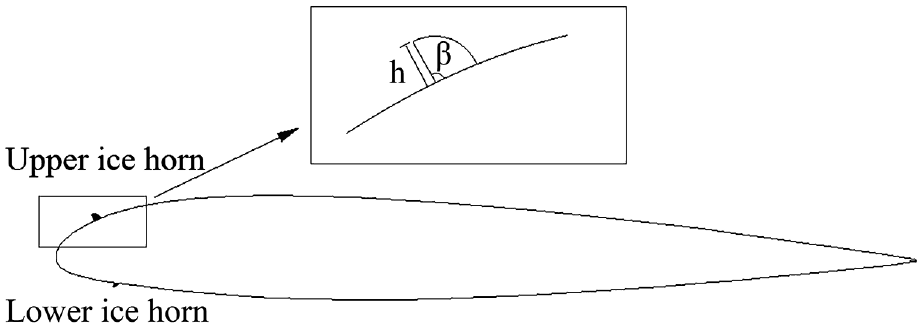
Based on previous studies,14,23,30 we investigated the quarter-circle simplified ridge ice model and defined four design parameters, namely the lower ice horn, the height of the upper ice horn (h), the angle of the upper ice horn (β), and the location of the upper ice horn. The 90º angle of the upper ice horn meant that the straight edge of the model was normal to the upper surface of the airfoil. The location of the upper ice horn was defined as the distance from the ice horn to the leading edge along the chordal direction, which was usually in units of chord length (c). The shapes of the lower ice horn remained unchanged in different cases. Besides, there were only two options for the lower ice horn: appearance and disappearance.
Numerical method
In this study, numerical investigations were carried out by the CFD tool, ANSYS-Fluent. The Spalart-Allmaras model was chosen according to the study of Mortensen et al.
30
In order to verify the accuracy of the numerical method, Broeren’s EG1159 ridge ice shape
23
on the airfoil NACA 23012 was simulated in this section. The chord length was 3.6 m and the diameter of the calculation domain was set at 20 times the chord length. Structured grids were adopted in this study. The thickness of the first-layer grids near the wall was set as
Information on ridge ice.

Validation of numerical investigation
Figure 2 shows the comparisons between the simulation and experimental results
23
with respect to the CL with different numbers of grids at AOA = 6°. The parameters of the simulation were consistent with those in the experiment described in Table 1. As the refinement of the grids, the discrepancy between the simulation and the experimental results converged to the order of
Airfoil NACA23012 and the ridge ice geometry.

Grid independence.

Grids. (a) The whole airfoil and (b) The upper ice horn.
Figure 4 shows the comparisons of the present simulations and the previous experimental results 23 at various angles of attack. It can be seen that the simulation curves had a similar regular pattern as the experiment curves, and the differences between these values were very small.

Comparisons between the simulation results and the experiment data. (a) Comparisons of the CL and (b) Comparisons of the CD.
Data analysis method
Design of experiments (DOE) is a structured and organized method to determine relationships between the input and output of a process. 31 The main objective of DOE is to obtain the maximum amount of information while limiting the number of experiments needed. 32 The DOE method specifically used is factorial design, which is a multi-factor and cross-classification design. 33 Factorial design enables an experimenter to study the effect of the design parameters on the objective coefficient.
The values for three design parameters are shown in Table 2. It should be noted that the parameter of the lower ice horn did not have a specific value. Instead, it only had two options: appearance and disappearance.
Design parameters and their values.

The analysis process with respect to geometric parameters of the ridge ice and airfoils was organized as follows. Firstly, a permutation and combination table of four parameters was designed (Table 3). The influences of four design parameters on CL and CD of a specific airfoil at a specific angle of attack required 20 simulations. The present study investigated the lift and drag coefficients of airfoil NACA23012 at three angles of attack (i.e., AOA = 2°, 5°, and 8°), as well as the airfoils NACA64-215 and RAE2822 at AOA = 2°. It should be noted that AOA = 2°, 5°, and 8° represented the cruise condition, the stall condition, and the post-stall condition, respectively. The total number of simulation cases was 100.
Permutation and combination table of four design parameters.

Secondly, the airfoil models and grids were generated respectively based on the permutation and combination table. Thirdly, the CL and CD of each model were simulated. Finally, the reference value and the standardized effects of each parameter were figured out. In the present study, the reference value was the 0.95 quantile of a t-distribution with degrees of freedom equal to the degrees of freedom for the error term. The standardized effects were calculated by some formula. 31 Taking 2 × 2 factorial design31,34–36 as an example, Table 4 shows the relationship between the lift coefficients of the airfoil and two ice shape parameters.
2 × 2 factorial design.

Each parameter had two values, which were denoted as A1, A2, B1, and B2. Due to the influences of these two parameters, the lift coefficients of the airfoil were A1B1, A1B2, A2B1, and A2B2. The standardized effect of the width of the upper ice horn can be calculated by equation (1).

The standardized effect of the height of the upper ice horn can be calculated by equation (2).

If the standardized effect of a parameter was larger than the reference value, it meant that this parameter was statistically significant at 0.1 level with the current model terms. In other words, this parameter had an influence on CL and CD. A larger standardized effect indicated that the influence degree of this parameter was greater. Meanwhile, the influence trends of the CL and CD with a certain ridge ice parameter were analyzed. The normalized effect (n) was defined as

while s is the standardized effect and r is the reference value in the same case. Through this method, the differences in standardized effects in different cases were narrowed, and the simulation results of different cases could be plotted in a single figure.
Results and discussions
CL and CD of airfoil NACA 23012 at different angles of attack
In this study, three angles of attack (i.e., AOA = 2°, 5°, and 8°) were selected for the analysis. It should be noted that AOA = 2°, 5°, and 8° represented the cruise, stall, and post-stall conditions, respectively. Figure 5 shows the influence degrees of the four design parameters on the CL of the airfoil NACA23012 at different angles of attack. The X coordinate represents the parameters, while the Y coordinate represents the normalized effect. The normalized effects of these design parameters were all greater than 1, which meant that they all had an influence on CL. At AOA = 2° and 8°, the influence degrees of design parameters on CL were in descending order: the lower ice horn, the height of the upper ice horn, the location of the upper ice horn, and the angle of the upper ice horn. At AOA = 5°, the influence degrees of design parameters on CL were in descending order: the height of the upper ice horn, the location of the upper ice horn, the angle of the upper ice horn, and the lower ice horn. It can be found that the influence degrees of the height of the upper ice horn on CL were always dominant. The influence degrees of the angle and location of the upper ice horn on CL were weaker than that of the height of the upper ice horn. The influence degrees of the lower ice horn on CL were significant at 2° and 8°, but relatively weak at 5°. It should be noted that there was no relationship between the normalized effects of these three angles of attack. For the convenience of illustration, the data of these three angles of attack were plotted in one figure hereafter.

Influence degrees on the CL of airfoil NACA23012.
Figure 6 shows the influence degrees of the four design parameters on the CD of the airfoil NACA23012 at different angles of attack. It can be seen that the normalized effects of four design parameters were all greater than 1, which meant that they had an influence on CD. At AOA = 2°, the influence degrees of design parameters on CD were in descending order: the lower ice horn, the height of the upper ice horn, the angle of the upper ice horn, and the location of the upper ice horn (Figure 6). At AOA = 5° and 8°, the influence degrees of design parameters on CD were in descending order: the height of the upper ice horn, the lower ice horn, the location of the upper ice horn, and the angle of the upper ice horn (Figure 6). It can be found that the influence degrees of the height of the upper ice horn on CD were always dominant. The influence degrees of the angle and location of the upper ice horn on CD were weaker than that of the height of the upper ice horn. These findings were consistent with those in Figure 5. It meant that these three design parameters had similar influence degrees on CL and CD. In addition, the lower ice horn had a significant influence on CD at these three angles of attack.
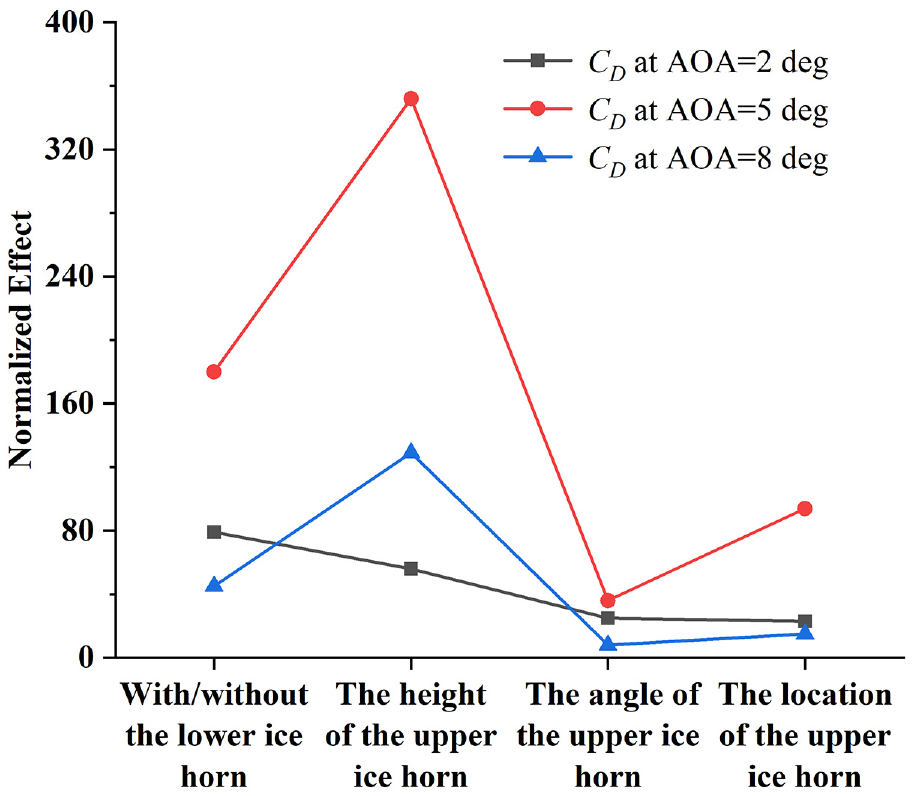
Influence degrees on the CD of airfoil NACA23012.
The influence degrees of four design parameters on CL and CD were obtained through the previous analysis. Further analysis was carried out in this study to get the influence trends of design parameters on CL and CD. Figure 7 shows the influence trends of the four design parameters on Cl and Cd of airfoil NACA23012 at AOA = 2°, 5°, and 8°. Considering the large difference between CL and CD at these three angles of attack, the values of CL and CD with specified parameters (i.e., 80° of the angle of the upper ice horn, 0.0855 c of the location of the upper ice horn, 0.0117 c of the height of the upper ice horn, and the existence of the lower ice horn) were selected as the benchmark. In order to better describe the influence trend, a term, namely the changes of coefficients (Δ), was defined as

while m is the value of the benchmark and l is the value of CL and CD of design parameters. Therefore, the rising line represented the increase of CL and CD along the positive direction of the X-axis, while the falling line represented the decrease of the coefficients.

Influence trends on the CL and CD of airfoil NACA23012. (a) The angle of the upper ice horn, (b) The location of the upper ice horn, (c) The height of the upper ice horn, and (d) The lower ice horn.
It can be seen that CL increased and CD decreased as the angle of the upper ice horn increased or the location of the upper ice horn moved towards the trailing edge of the airfoil (Figure 7(a) and (b)). In addition, CL decreased and CD increased with the increase of the height of the upper ice horn (Figure 7(c)). The influence trends of the lower ice horn were more complex. After removing the lower ice horn, CL at AOA = 2° and CD at these three angles of attack decreased, but CL at AOA = 5° and 8° increased (Figure 7(d)). In most simulation cases, the change trends of CL and CD were opposite when changing the values of the design parameters.
It should be noted that the detailed values of CL and CD were not indicated in Figure 7. Table 5 shows these values as a supplement. The slopes of lines in Figure 7 can be calculated from the data listed in Table 5. These slopes can be used to derive CL and CD for other values of parameters. For example, when the angle of the upper ice horn is 95° and the angle of attack is 2°, the CL of airfoil NACA23012 can be estimated as 0.25253.
CL and CD of NACA23012 at three angles of attack.

CL and CD of three airfoils at AOA = 2°
In this section, the CL and CD of three airfoils (i.e., NACA 23012, NACA 64-215, and RAE 2822) at AOA = 2° were simulated and compared in detail. Figure 8 shows the influence degrees of the four design parameters on CL of these three airfoils. The normalized effects of design parameters were all greater than 1, which meant that they all had an influence on the CL. The influence degrees of design parameters on CL of airfoil NACA23012 were in descending order: the lower ice horn, the height of the upper ice horn, the location of the upper ice horn, and the angle of the upper ice horn. The influence degrees of design parameters on CL of airfoil NACA64-215 were in descending order: the lower ice horn, the height of the upper ice horn, the angle of the upper ice horn, and the location of the upper ice horn. The influence degrees of design parameters on CL of airfoil RAE2822 were in descending order: the height of the upper ice horn, the lower ice horn, the angle of the upper ice horn, and the location of the upper ice horn. It can be inferred that the influence degrees of the height of the upper ice horn and the lower ice horn on CL were dominant, while the other two parameters had relatively less influence. The influence degrees of the same parameter were different for these three airfoils. This might be caused by the leading-edge geometries of different airfoils. It should be noted that there was no relationship between the normalized effect of these three airfoils. For the convenience of illustration, the data of these three airfoils were plotted in one figure hereafter.

Influence degrees on CL of three airfoils at AOA = 2°.
Figure 9 shows the influence degrees of the four design parameters on the CD of three airfoils. It can be seen that the normalized effects of four design parameters were all greater than 1. Each design parameter had an influence on the CD. The influence degrees of four design parameters on CD were in descending order: the lower ice horn, the height of the upper ice horn, the angle of the upper ice horn, and the location of the upper ice horn. Besides, the influence degrees of the height of the upper ice horn and the lower ice horn on CD were always dominant, while the other two parameters had less influence. These findings were consistent with those in Figure 8, which meant that these four design parameters had similar influence degrees on CL and CD.

Influence degrees on CD of three airfoils at AOA = 2°.
Figure 10 shows the influence trends of four design parameters on three airfoils at AOA = 2°. It can be seen that CL increased and CD decreased as the angle of the upper ice horn increased or the height of the upper ice horn decreased (Figure 10(a) and (c)). The CL of these three airfoils and CD of airfoil RAE2822 increased and the other coefficients decreased as the location of the upper ice horn moved towards the tailing edge of the airfoil (Figure 10(b)). In addition, the CL of airfoil RAE2822 increased and the other coefficients decreased after removing the lower ice horn (Figure 10(d)). It can be found that in most simulation cases, the change trends of CL and CD were opposite when changing the value of the parameters. This tendency applied to these three airfoils used in the present study.

Influence trends on CL and CD of three airfoils at AOA = 2°. (a) The angle of the upper ice horn, (b) The location of the upper ice horn, (c) The height of the upper ice horn, and (d) The lower ice horn.
Some phenomena can be explained by the geometric structure of the airfoils. The leading-edge radius of the NACA23012 airfoil was relatively big in comparison to the other airfoils, with an evident protrusion on the upper surface of the airfoil. Thus, its suction peak was close to the leading edge of the airfoil. The presence of the upper ice horn caused a significant decline in the pressure distribution curve on the upper surface of the airfoil. And this decline was delayed as the upper ice horn moved towards the trailing edge of the airfoil. This could increase the CL of the airfoil, as shown in Figure 10(b). The upper surface of RAE2822 was relatively flat and the maximum thickness point was closer to the mid-section of the airfoil. As a result, the CL of airfoil RAE2822 were less impacted by the location of the upper ice horn throughout the parameter ranges of this study. The increased CL of the airfoil RAE2822 after removing the lower ice horn in Figure 10(d) might be due to the convex lower surface of the airfoil, while the lower surfaces of the other two airfoils were flatter. In addition, the subtle differences between the three airfoils in Figure 10(a) and (c) might be due to the different leading-edge radii of the airfoils.
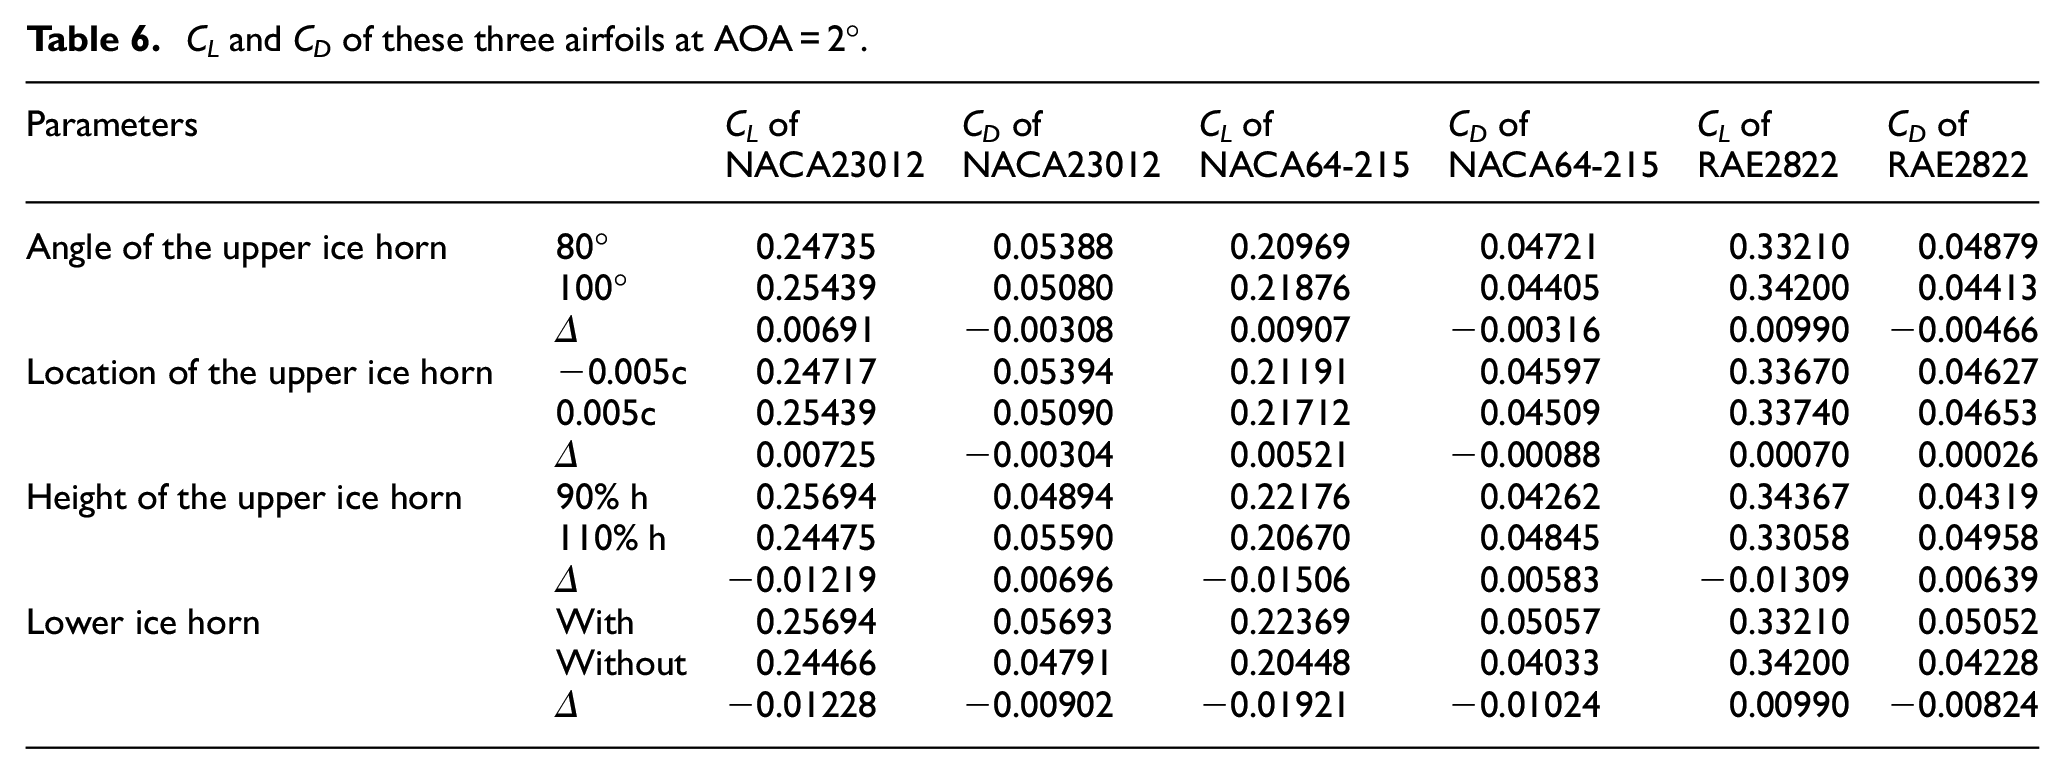
Table 6 also lists detailed values of CL and CD of these three airfoils as a supplement.
CL and CD of these three airfoils at AOA = 2°.
Conclusion
The present work mainly focused on the simplified ridge ice parameters and investigated the qualitative and quantitative changes in CL and CD of airfoils caused by changes in these parameters. To the authors’ best knowledge, this study adopted the DOE method for the first time to analyze the influences of ridge ice parameters on the lift and drag coefficients. Four design parameters (i.e., the height of the upper ice horn, the angle of the upper ice horn, the location of the upper ice horn, and the lower ice horn) were selected for analysis. Numerical investigations were carried out to study the influences of four design parameters on the CL and CD of three airfoils (i.e., airfoil NACA23012, airfoil NACA64-215, and RAE2822) at three angles of attack. Since there were no apparent interactions between the design parameters within the parameter ranges of this study, the present work mainly focused on the individual effects of design parameters. The following conclusions were obtained:
For airfoil NACA23012, the influence degrees of the height of the upper ice horn on CL and CD were always dominant. The influence degrees of the angle and location of the upper ice horn were weaker than that of the height of the upper ice horn. The CL increased and CD decreased when the angle of the upper ice horn increased, the location of the upper ice horn moved toward the trailing edge of the airfoil, or the height of the upper ice horn decreased. These conclusions were applicable to the cases of three angles of attack.
For airfoil NACA23012, the influence of the lower ice horn on CL and CD was more complex. As far as the influence degrees were concerned, the lower ice horn had less influence on CL at AOA = 5°, but had significant influences in other cases. As far as the influence trends were concerned, removing the lower ice horn increased CL and decreased CD at AOA = 5° and 8°, but decreased CL and CD simultaneously at AOA = 2°.
For different airfoils at AOA = 2°, the height of the upper ice horn and the lower ice horn always had significant influences on CL and CD, while the other two parameters had relatively less influence. In most simulation cases, changing the values of parameters could increase CL and decrease CD. However, CL and CD increased simultaneously when the location of the upper ice horn moved towards the tailing edge of airfoil RAE2822. In addition, CL and CD decreased simultaneously when the lower ice horn of airfoils NACA23012 and NACA64-215 were removed.
Changes in the height and angle of the upper ice horn exhibited comparable effects on the CL and CD of various airfoils. The location of the upper ice horn had less influence on the airfoil with a flat upper surface (RAE2822). The presence of a lower ice horn increased the CL and CD of airfoils with a flat lower surface (NACA23012 and NACA64-215). The presence of the lower ice horn decreased the CL of the airfoil RAE2822 since the lower surface of the airfoil RAE2822 had a protrusion near to the leading edge.
The present work provides some valuable insights into the ice shape simplification methods, which could not only improve our understanding of the simplification methods of ridge ice, but also provide a reference for researchers to carry out further experimental and numerical analyses. A larger range of design parameters is recommended to be investigated in future studies to establish more comprehensive relationships among design parameters, airfoils, and angles of attack.
Footnotes
Appendix
Handling Editor: Chenhui Liang
Authors’ contributions
Chengyi Zheng contributed to the investigation, methodology, simulations, data analysis, and writing—original draft; Qiaotian Dong was involved in methodology; Zhigang Yang was involved in project administration; Zheyan Jin contributed to supervision, methodology, writing, review, and editing, project administration, funding acquisition.
Declaration of conflicting interests
The author(s) declared no potential conflicts of interest with respect to the research, authorship, and/or publication of this article.
Funding
The author(s) disclosed receipt of the following financial support for the research, authorship, and/or publication of this article: This work was supported by National Natural Science Foundation of China (No. 12372279), Shenyang Key Laboratory of Aircraft Icing and Ice Protection, and National Engineering Research Center of New Energy Vehicles and Power Systems.
Availability of data and materials
All data generated or analyzed during this study are included in this published article.