
Abstract
In this paper, a series of leaf-like piezoelectric elements are proposed by using laminated structure of polypropylene (PP) and Polyvinylidene fluoride (PVDF) film to collect wind energy through vortex induced vibration. Topology optimization based on solid isotropic material with penalization method is employed in seeking optimal configurations of the elements. The PP and PVDF layer were set as optimization variables respectively to obtain topological layouts that would be equivalent to maximizes the overall strain energy as the objective function. Four simple shapes of piezoelectric elements with different topological configurations are manufactured and tested in wind tunnel to estimate the energy harvesting capabilities. The experimental results show that the reinforcement optimized long trapezoid model has the highest open-circuit output voltage of 4.01 V and output power of 6.125 μW at the wind speed of 12 m/s. For the optimization of piezoelectric materials, the short trapezoid model can reach the open circuit output voltage of 2.061 V and output power of 1.158 μW. It indicated that the topology optimization can indeed improve the energy harvesting efficiency of the piezoelectric element. However, this method is not universal at present, which means that the external shape of the model will influence the performance of the relevant optimization results.
Introduction
In recent decades, the rapid development of microelectronics and information science has greatly promoted the sensors and detectors to be wireless, networked and intelligent.1,2 For these systems, if the traditional battery is used as the energy source, the node life will mainly depend on the battery power and life. In addition, the replacement of the battery will also increase costs and reduce adaptabilities, especially for components placed outdoors and difficult-to-reach environment. 3 Therefore, a large number of studies have confirmed that energy harvesting technology is one of the feasible methods to overcome the above limitations. 4 Piezoelectric transduction is the prominent mechanical energy harvesting mechanism owing to its high electromechanical coupling factor and piezoelectric coefficient compared to electrostatic, electromagnetic, and triboelectric transductions. 5 In addition, piezoelectric devices are more suitable for miniaturization than electromagnetic energy harvesting. 6 Compared to triboelectric energy harvesting technology, piezoelectric has greater advantages in reliability and avoiding wear and tear. 7
Wind is one of the commonly used energy sources in energy harvesting, just like solar, hydro, thermo, and kinetic energy. It can generate electricity through traditional wind turbines or combine with smart materials such as piezoelectric materials for small-scale energy harvesting. 8 Because it is very suitable for the above-mentioned wireless sensor network and other similar systems, more and more scholars are devoted to the research of piezoelectric wind energy harvesters.9–11 In terms of energy conversion mechanism, many studies used devices similar to windmills or small turbines to convert wind energy into rotational motion to drive piezoelectric elements for power generations.12–14 In the other hand, some investigations indicated that aeroelastic mechanism, such as galloping, 15 flutter, 16 and vortex, 17 has more promising potential in producing an energy harvester in smaller scale.18,19
Energy harvesting efficiency is the most important key point for practical applications of piezoelectric energy harvesters. 20 Although power management strategies, 21 protocols, 22 and advanced electrical circuits 23 can indeed improve the energy efficiency of the system. But structural optimization of the system is still regarded as the fundamental way to solve the above problem. 24 By modifying the physical parameters of the system, such as size, 25 shape, 26 connections, 27 or attachments 28 etc., more suitable dynamic or fluid-solid coupling characteristics of the structure can be meet to achieve higher output power 29 or wider bandwidth. 30 Topological methods are more common for the design and optimization of piezoelectric energy harvesting systems. 31 This method can not only be implemented in system-level, but also suitable for the design of piezoelectric elements.32,33 From the perspective of materials, piezoelectric ceramic materials in energy harvesters typically need to be attached to an elastic substrate layer to ensure reliability. 34 Therefore, a large number of studies have mainly focused on topology optimization of the distribution of piezoelectric ceramic materials 35 or substrate materials. 36 Compared to piezoelectric ceramic materials, there is relatively little research on topology optimizing the PVDF material in energy harvesters. 37 Because PVDF is more flexible and can be used directly with a simple conductive coating. However, more and more researchers are realizing that optimization for the shape, distribution, and substrate structure of PVDF materials is necessary to achieve better energy harvest efficiency. 38
In this paper, a general topology optimization method was used to optimize the material distribution of PVDF wind energy collection units to achieve better energy collection efficiency. The optimization object is derived from our previous research, a leaf-like piezoelectric element based on PVDF film to collect wind energy through vortex induced vibrations. It has been proved that the additional reinforcements/substrate structures, which has the layout of bioinspired plant leaf veins, can greatly improve the energy harvest efficiency. 39 Furthermore, we studied the energy harvesting characteristics of the piezoelectric element by modifying its bionic shapes and configurations. 40 The literature 41 and our research indicate that the shape of piezoelectric elements, as well as the distribution of PVDF materials and reinforcements/substrate materials, are important factors affecting energy collection efficiency. In order to further obtain a more universal and superior configuration of the energy harvesters, we optimized the material distributions of a series of laminated piezoelectric elements through a general topological method.
Modeling of the piezoelectric wind energy harvester in vortex flow
Vortex-induced loads applied on the piezoelectric elements
The piezoelectric wind energy harvesting system in this paper is made up of three parts: flow field, bluff body and cantilever rod, piezoelectric element. In order to simplify the experiment and simulation, the force condition of the piezoelectric element in the flow field is shown in Figure 1.

Vortex loads applied on the piezoelectric element.
The parameter D in Figure 1 denotes the diameter of the bluff body and the value is 0.2 m. The parameter U0 and μ represent the velocity and dynamic viscosity of the air at 20°C. The inlet wind speed is set between 4 and 12 m/s. Then, the Reynolds number of the system ranges from 1.22 × 10⁴ to 3.66 × 10⁴. In this range, the Strouhal number St has a certain value of 0.21. 42
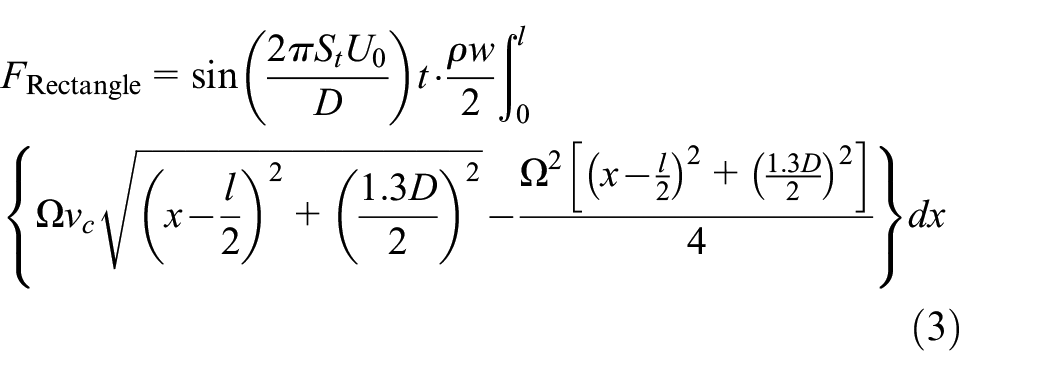
The fluid flows into the wind tunnel from the left side and generates Karman vortex street on the back side of the bluff body through the action of cylindrical turbulence. Vortex-induced vibration occurs when the eddy current acts on the piezoelectric element. Taking the lateral center of the piezoelectric element as the origin coordinate, the vortex coordinate is assumed to be C(xc, yc), and the point on the piezoelectric element is A(x, 0). The force exerted by the eddy current on the piezoelectric element can be expressed as43,44:

Where F is the force on the piezoelectric element, ρ is the fluid density, l is the length of the effective surface, w(x) is the width of the effective surface, Ω is the intensity of vortex, vc is the velocity at the point C in the center of the vortex. In our work, the piezoelectric element models have four different shapes: triangle, short trapezoid, long trapezoid and rectangle. These simple shapes have been applied in relevant optimization research26,45 and can minimize the influence of the initial shape of the element on the optimization results. The outlines and dimensions of the models are shown in Figure 2.
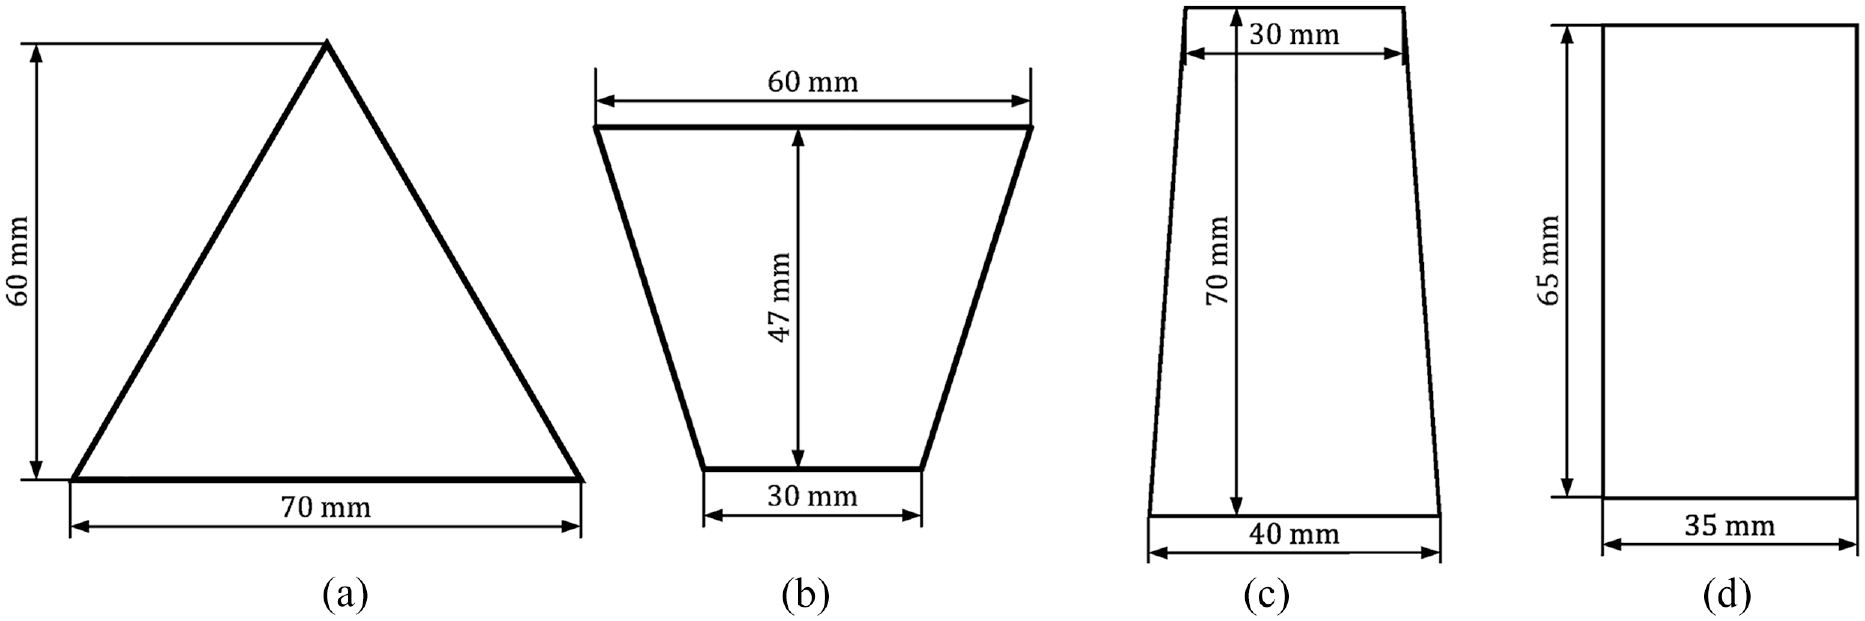
Outlines of the four piezoelectric elements: (a) triangle, (b) short trapezoid, (c) long trapezoid, (d) rectangle.
Then, the relation between width and length of piezoelectric element of different models can be expressed as follows:

Where C is constant; for isosceles triangle, w0 is the length of the base and l is the height; for isosceles trapezoid, w0 and w1 are the length of bottom and top edges respectively, and l is the height.
The corresponding eddy forces for different model are as follows:


Where D is the diameter of blunt body.
Topology optimization model for piezoelectric elements
As we have mentioned before, the piezoelectric elements we developed can be seen as laminate structures that consist of piezoelectric layer and reinforcement layer (Figure 3) that were bonded together with resin-based silicone adhesive (bonding layer). On the other side, we have also proved that the layouts of the stiffeners can greatly influence the energy harvesting efficiencies. Thus, it is necessary to find a general method for the distributions of the reinforcement layer materials on piezoelectric base and vice versa.

Structures and configurations of piezoelectric elements.
Topology optimization method is applied in our work to maximize the energy conversion efficiencies. As for piezoelectric elements, it can also be equivalent to the maximum strain energy. Therefore, based on Solid Isotropic Material with Penalization (SIMP) method, 46 the piezoelectric material element and the reinforcement element are taken as design variables respectively while volume fraction as constraint condition. The objective function is to maximize the flexibility of piezoelectric energy harvesters. The topology optimization model are as follows:

Where
The iterative equation based on the optimization criterion method can be written as:

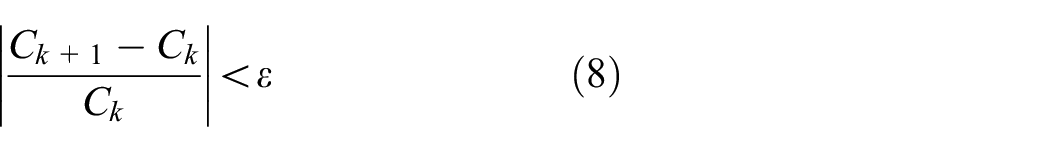
The design variables are iteratively updated by the above equation until it converges. The criterion of convergence is to check the absolute difference between the two maximal components of the adjacent design variables. In this study, the flexibility of the harvesters by modified certain material distribution was set as design variables. Then, the evaluation criteria of convergence criteria can be expressed as follows:
Topology analysis and numerical results
Topology analysis are carried out base on the SIMP model in equation (6) and criterion in equation (7). The optimization process can be expressed in Figure 4 and a brief description is provided as follows:
(1) The initial regions to be optimized are defined first according with the patterns in Figure 2, while the reinforcement material fully covered with piezoelectric element.
(2) The model with the structures shown in Figure 3 will be endowed with some initial material properties. External loads, which derived from equations (3)–(5), and fixed constrains at the midpoint of the bottom edge will be imposed on the model.
(3) The optimization model will be established base on equation (6). Finite element method is used to calculate the objective function. The volume ratio
(4) Iterative formula and its evaluation criteria of convergence above will form an iterative loop to achieve topology reconfiguration. The evaluation criteria of convergence criteria ε in equation (8) is set to be 0.001 for all the models. The topology analysis can be carried out for optimization of matrix reinforced material element and piezoelectric material element respectively.

Topology optimization procedure.
Taking the matrix reinforcement material element as the design variable
In this section, the reinforcement material element is selected as the design variable while the volume fraction was set as the constraint. The maximum compliance is taken as the objective function to complete the topology optimization process.
The piezoelectric elements with four basic shapes were optimized and the results are shown in Figure 5.
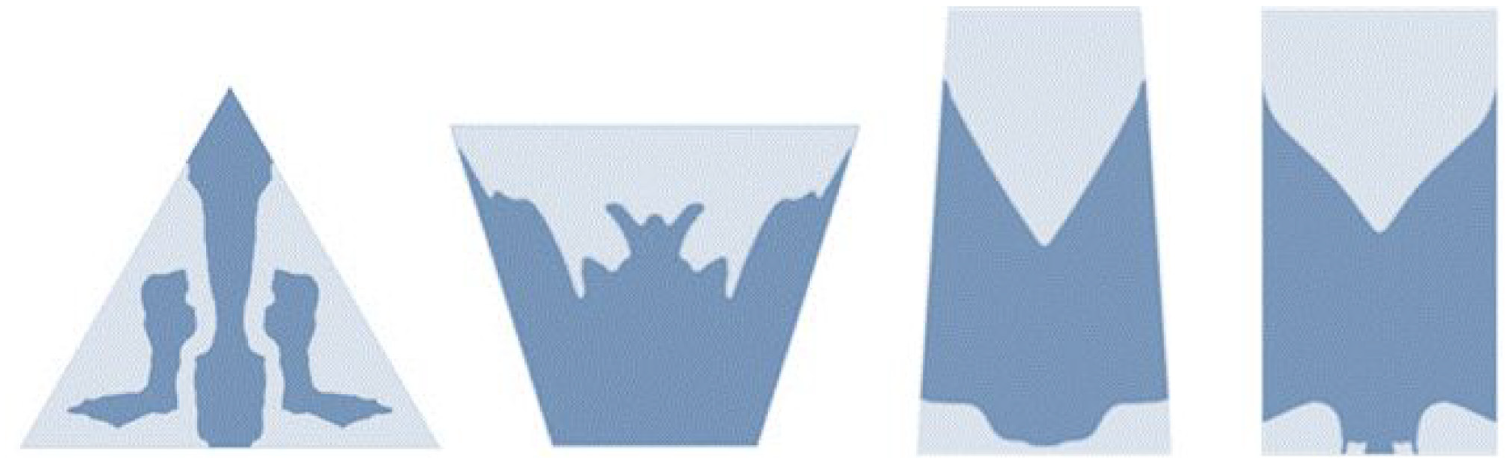
Optimized results for reinforcement material element.
The dark areas in Figure 5 are the distribution of reinforcement material. The borders of these areas are smoothed to achieve better processability for experimental models. The areas enclosed by the outlines are the piezoelectric material arrangements, that is also, the areas before reinforcement material optimized. In the process of optimization, the triangle model reached convergence after 80 iterations, and the final volume was reduced by about 47.7%. the number of iterations for short trapezoid was 23 times with the volume reduction of about 40%. The number of long trapezoid iterations was 26 times, as the volume decreased about 36%. The number of rectangular iterations is 25 while the final volume is reduced by about 37.9%.
Taking the piezoelectric material element as the design variable
Generally, for a laminated structure, it can be optimized for any single layer material according to the optimization object. So, in order to evaluate the piezoelectric laminated structure model more comprehensively, we also conducted a topology optimization for the material distribution of the piezoelectric layer. Another main purpose of this part is to estimate the most economical use of piezoelectric materials.
For the case of taking piezoelectric material element as design variable, the optimization method is similar with the process in section 3.1 above. The four basic shape piezoelectric models were optimized and the results are shown in Figure 6.

Optimized results for piezoelectric material element.
The dark areas in Figure 6 are the distributions of piezoelectric material on the reinforcement material matrix that were enclosed by the outlines of the four elements. The borders of these areas are also smoothed to achieve better processability for experimental models. In the optimization process, the number of iterations when the above four models reach convergence is 28, 80, 20, and 24, respectively. The volume reduction is about 40.5%, 26.5%, 45.5%, and 49% respectively.
Experiment for model evaluation of optimization
In order to verify the effectiveness of the optimization process, experimental models were processed according to the above optimization results and the energy output characteristics of each model were measured through wind tunnel tests. Moreover, we used a 110 μm-thick poled flexible PVDF film (METALLIZED FILMSHEETS, TE Connectivity Ltd.) and commercial PP sheets to fabricate the models. Evaluations were carried out by comparing and analyzing of the experimental results.
Experimental setup
In the experiments, the piezoelectric wind energy harvesting elements were fixed in a small wind tunnel with the surface of the models parallel to the wind direction, as shown in Figure 7, which allows them to be placed in the vortex street of the bluff body and excited by the periodic vortex load perpendicular to the surface of the elements. The wind speed in experiment ranges from 2 to 12 m/s, that is, the wind level ranges from 2 to 6, which is a common wind level range in daily life. The wind speed can be measured by a small digital thermal anemometer (GM8903, Benetech) with a resolution of 0.001 m/s. The real-time output voltage generates by the energy harvester is collected by a dynamic signal acquisition instrument (DH5922, Donghua) that can use the supporting software for real-time analysis and data storage.
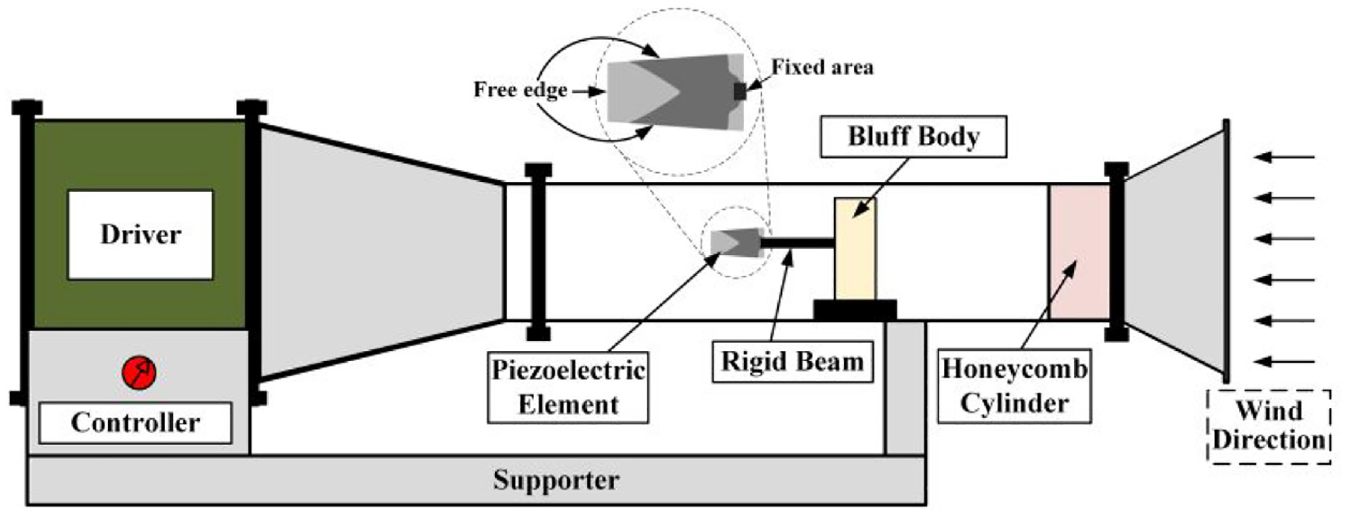
Piezoelectric energy harvesting elements in wind tunnel tests.
In addition to the two types of optimization models in third section above, a set of single-layer piezoelectric models without reinforcement layer, which have the shapes shown in Figure 2, were tested and analyzed as the control group.
Output voltage of single- layer PVDF piezoelectric models
The output characteristics of four single-layer PVDF piezoelectric elements in vortex induced vibration were measured. The root mean square (RMS) values of open-circuit voltage of different models with the wind speed range of 2–12 m/s can be calculated from the measurements and shown in Figure 8.

Output characters of single layer PVDF modes.
It can be seen from the above results that the maximum output voltage of the four models from high to low are rectangle, long trapezoid, triangle and short trapezoid. The overall RMS values of open circuit voltage ranges from about 0.04 to 0.3 V at the inflow speed of 2–12 m/s. All the output curves have a similar trend that increases monotonously with the raising of the wind speed. For triangle and short trapezoid models, the upward trend slows down at wind speeds greater than 6 m/s. In contrast, the turning point of rectangle and long trapezoid model appears at the wind speed of 8 m/s. Therefore, it can be considered that the shape of the structure has a greater impact on the output characteristics for the single-layer piezoelectric elements. The models with a larger length-width ratio have higher output voltages when the wind speed is greater than 8 m/s.
Generally, for the energy supply of a real-time working device, the output voltage of the above four piezoelectric elements is relatively low. The reason is that the piezoelectric film we used is more flexibility. Although the vortex load acting on it makes the total displacement of the structure large, but the stress and strain are mainly concentrated near the fixed constraint points. Then, the overall strain energy is relatively small, and the overall output capacity of the structure is relatively low. So, the solution in this paper is to further maximize the overall strain energy by using a laminated structure, which is mainly solved by the topology optimization method described above.
Output voltage of the models that have optimized reinforcement materials
The RMS open circuit output voltages of the laminated models that have been optimized for the reinforcement layer, which are listed in Figure 4, are tested by using the same wind tunnel system above. The results can be seen in Figure 9.
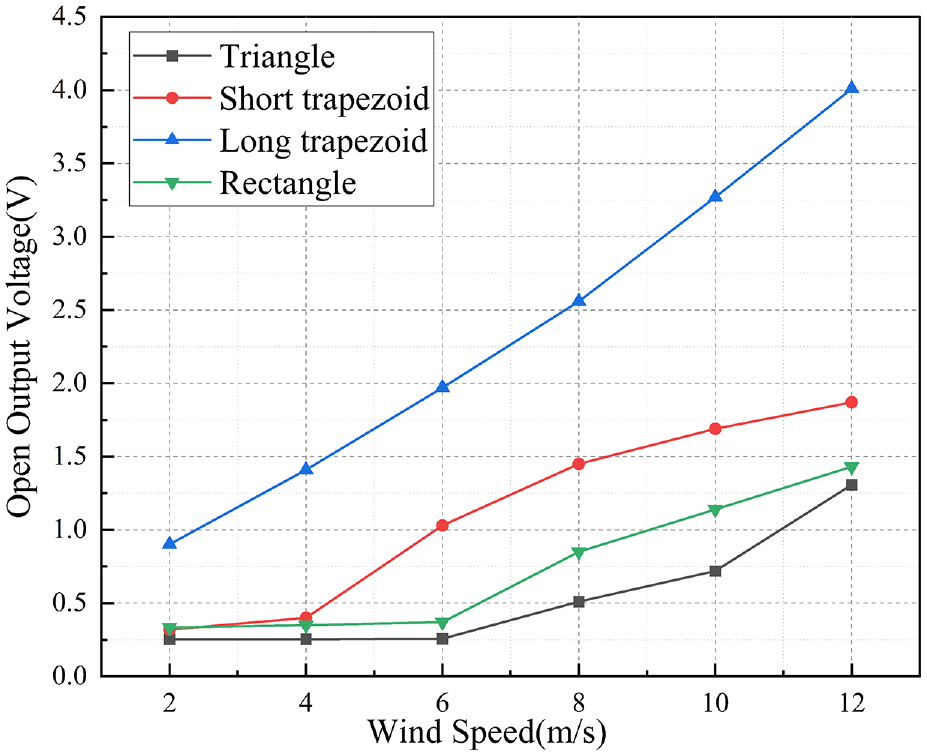
Output open circuit voltage of the reinforcement optimization model.
For this series of models, there is still a monotonically increasing relationship between output voltage and wind speed. The four piezoelectric elements have obvious contrasts. The output voltage of long trapezoid model, which increase linearly with the wind speed, is much larger than the other three models for about three times. The output voltages vary from 0.902 to 4.01 V that are 10 to 13.5 times higher than the corresponding model in the control group list in the section above. The output voltage of the triangular topology optimized model will not increase significantly when the inlet wind speed is less than6 m/s, but show an approximate linear increasing afterward. The value ranges from 0.254 to 1.308 V, which are 5.4 to 6.6 times the pre-optimization. The output characteristics of the rectangular model are similar to those of the triangle model, and the voltage value range from 0.334 to 1.431 V, which are 4.2 to 5.3 times higher than the pre-optimization. As for the short trapezoid model, the turning point appears at the wind speed of 4 m/s. The output voltages are from 0.32 to 1.871 V and 3.8 to 6.5 times higher than the model in control group.
It can be seen from the comparison of the results in Figures 8 and 9 that the output voltage of the laminated model after topology optimization is significantly higher than that of the single-layer piezoelectric material model for about 3.8–13.5 times. This not only proves the effectiveness of the optimization method deduced in the second part of this article, but also proves the conclusion of our previous research that the energy harvesting ability of the model can be effectively improved by placing a reinforcement structure on the piezoelectric material.
Output voltage of the models that have optimized piezoelectric materials
For the laminated structure with piezoelectric material as the optimization variable, a group of physical models which shown in Figure 4 were also produced and tested in wind tunnel. The experimental results can be illustrated in Figure 10.

Output open circuit voltage of the piezoelectric material optimization model.
The figure above shows the RMS value of output open-circuit voltage with the variations of wind speed for the piezoelectric optimization models. The output voltage of this group ranges from 0.14 to 2.1 V, and the curves overlap each other except for the triangle model, which is always the lowest at any wind speed. In the case that the wind speed is less than 5 m/s, the output of the rectangular model is the highest, followed by the, long trapezoid and triangular model. When the wind speed is higher than 5 m/s, the short trapezoid model shows the best output capacity. The long trapezoid model exceeds the rectangle model at the wind speed of 7.5 m/s and above. At the inlet wind speed of 12 m/s, all models have reached the maximum output voltage. The final order from high to low is: short trapezoid, long trapezoid, rectangle and triangle.
In general, the maximum output voltages of this group of models are not much different, and the ratio of the maximum to the minimum value does not exceed 1.5 times. Compared with the output voltage results of the reinforcement optimization models shown in Figure 8, there is no structure with outstanding characteristics in this group of models. Except for the long trapezoidal model, the output voltages of the other three models in this group are all greater than the corresponding reinforcement optimization model. Since relatively few piezoelectric materials are used in this group of models, it can be considered that topological optimization of piezoelectric materials can indeed improve the output efficiency of the structure in most cases.
Output power and output power density
Optimal resistance and output power of piezoelectric elements
The open-circuit output voltage value only represents the energy conversion capability of the piezoelectric element, and the actual working performance of the energy harvesters are usually described by the output power properties.
For piezoelectric elements under vortex-induced load, the output power is not only related to the capacitance value of the model, but also related to the dynamic characteristics of the external load. In other words, there is an optimal resistance

Where
Since the wind speed of the flow field in our experiment is 4–12 m/s and the vortex shedding frequency
The above optimal load resistance is connected with the piezoelectric element to form an electric circuit. The voltages across the resistance can be measured and used to calculate the relevant real-time output power. The root mean square (RMS) values are also applied to evaluate the properties of the different models that illustrated in Figure 11.

Output power of the energy harvesters: (a) single layer models, (b) piezoelectric optimization models, (c) reinforcement material optimization models, (d) enlarge the curves of (c) without long trapezoid model.
It can be concluded from the above experimental data that the output power of all models will increase in varying degrees with the raising of wind speed. This is similar to the trend of open circuit output voltage. Another similarity is that the output power of the single-layer model is relatively small, and its maximum value is only 0.035 μW. In addition, the long trapezoidal model also has a particularly prominent maximum output power among all models, which can reach 6.152 μW. The real values of output power for different group and conditions are listed in Table 1, which also gives the comparisons before and after optimization in the form of multiples.
Comparison of output power value before and after optimization.

SL-Single Layer Model; PO-Piezoelectric Optimization Model; RO-Reinforcement Optimization Model. (Unit: μW).
PO/SL-ratios between PO and SL; RO/SL-ratios between RO and SL. (Unit: multiple).
For the triangle model, the output power after piezoelectric optimization is 1.87–11.46 times higher than before optimization. After the reinforcement material optimization, it has increased by 2–36.63 times. Except for the wind speed of 8 m/s, the reinforcement optimization method has more significant influence on output powers. At all wind speeds, the effect of piezoelectric optimization on the long trapezoidal model is greater than that of the reinforcement optimization method. The former brings an improvement of 52.52–175.77 times, while the latter can reach 1.47–9.74 times.
As for the short trapezoidal model, its characteristics are just opposite to the long trapezoidal model. Piezoelectric optimization can bring greater output power with an increase rate of 40.06–60.40 times, while reinforcement optimization can only bring 5.08–16.90 times increase. The rectangular model is similar to the short trapezoidal model, that is, the effect of piezoelectric material optimization is better than that of reinforced material optimization. The two improved multiples are 27.53–41.5 times and 6.5–36.67 times respectively.
Output power density of piezoelectric elements
In addition to open circuit output voltage and output power, the most important indicator of the energy harvesting capability of a piezoelectric element is the output power density, which is the maximum energy produced with the least amount of material. Besides, the output power density is also the basis for comparing the results between similar studies.
The power density can be calculated by the following formula:

Where
The volume of piezoelectric materials for different harvesting elements (cm3).

The output power density of each model can be calculated by using the data in Table 2, and its variation trend under different wind speeds is shown in Figure 12.

Output power density of the energy harvesters: (a) single layer models, (b) piezoelectric optimization models, (c) reinforcement material optimization models, (d) enlarge the curves of (c) without long trapezoid model.
By comparing the curves in Figures 11 and 12, it can be seen that the variations of the output power density are basically congruous with the output power. Before optimization, the absolute value of the power density of each model is relatively small, and the maximum is only 0.131 μW/cm3. After the reinforcement optimization, the long trapezoid model still has a prominent performance with the maximum value of 22.785 μW/cm3 and followed by the triangular model with that of 3.784 μW/cm3. The result of piezoelectric optimization is just the opposite of the above situation. The output power density of the short trapezoidal and rectangular models is greater than the other two models. The short trapezoidal model has a power density of 6.769 μW/cm3, while the rectangular model can achieve the maximum of 6.143 μW/cm3.
Under the same wind speed condition (10 m/s), the output power density can be compared with the results of similar studies in Table 3. It can be seen that the topological optimization for reinforcement structures can great improve the energy harvesting capacity of long trapezoid model and slightly promote the ability of the triangle model. But for rectangle model and short trapezoid model, the effect of piezoelectric optimization is more significant. That is to say, the existing results cannot fully explain the essential connection between the shape of elements and optimization method. Therefore, exploring the unified optimal design criteria for piezoelectric energy harvesting element is still one of our main research contents in the future.
Comparison of output power density with similar studies (μW/cm3).

Conclusions
In this work, piezoelectric energy harvesting element models with laminated structures composed of polypropylene sheets and PVDF piezoelectric film materials and four basic external shapes were designed and fabricated. By using the general SIMP method, topological optimization analysis of the distributions of the two materials were carried out. The optimized results were validated by wind tunnel experiment.
With the reinforcement material as the design variable, the long trapezoid model has the highest piezoelectric harvesting capacity. For the case of piezoelectric material as design variable, the short trapezoid model shows the best energy harvesting characteristics. Overall, optimizing the distribution of the reinforcement can achieve the best energy harvesting efficiency. Therefore, it should be paid more attention to optimizing the distribution of reinforcement/substrate structures than that of piezoelectric materials itself. In addition, the findings indicated that there is no strict correspondence between the external shape of the model and the optimized configuration. In further research, we will explore the possibility of unified optimization methods through more structures, while seeking the optimal configuration in the wind-structure coupling process to obtain practical distributed micro wind energy harvesters.
Footnotes
Handling Editor: Chenhui Liang
Declaration of conflicting interests
The author(s) declared no potential conflicts of interest with respect to the research, authorship, and/or publication of this article.
Funding
The author(s) disclosed receipt of the following financial support for the research, authorship, and/or publication of this article: This work was supported by the National Natural Science Foundation of China (No.51105087 and 51875112) and the Fundamental Research Funds for the Central Universities (No. HEUCF170704 and HEUCF180702).