
Abstract
In the welded structure of railroad vehicles, the bogie frame requires a service life more than 25 years, cracks occur in the weld zone owing to the application of repetitive fatigue loading during operation. When cracks occur and propagate in the weld zone, they are removed through gouging, and gas metal arc welding is performed for repair. After the first weld repair, the second weld repair process is performed if crack is visible in the same area. In this study, the effects of repetitive repair welding on the fatigue characteristics were investigated using materials applied in railway vehicle structures. Three types of specimens (weld specimen, first weld repairs specimen, and second weld repairs specimen) were prepared, and fatigue and residual stress tests were performed. The results indicated that the weld specimen had the longest fatigue life, and the first weld repairs specimen had the shortest fatigue life. The fatigue life of the second weld repairs specimen was longer than that of the first weld repairs specimen. Residual stress tests and finite-element analysis results indicated that the first weld repairs specimen had the shortest fatigue life among the specimens tested, because the highest residual stress was generated.
Introduction
The railroad system plays an important role in all countries as an ecofriendly means of mass transportation. In recent years, the railroad operation environment has become increasingly harsh because of the high speed of railroad vehicles and an increase in axle weight due to mass transportation. A railroad vehicle is composed of a carbody and a bogie. The bogie is a structure that supports all loads and allows the vehicle to travel on rails. It consists of a bogie frame, a suspension, wheels, and axles. The bogie frame is an important component that directly supports the loads of the carbody and parts. It is manufactured via welding owing to its complex geometry and is subjected to various types of loading. Such kind of loading can be classified into static ones caused by cargo and passengers, quasi-static loading generated while the vehicle passes through curved tracks, and cyclic ones occurred during travel. Therefore, static tests, fatigue tests, and various analyses are needed to evaluate the soundness of the bogie frame.1–3
Because a long service life of >25 years is required for the bogie frame, its safety is ensured through regular inspections. As the bogie frame is subjected to fatigue loading during long-term operation, cracks occur in the weld zone. There are various methods for holding cracks, but in the case of the bogie frame, weld repairs is performed after removing cracks. As welding is applied to the carbody and bogie frame, which are the main parts of railroad vehicles, requirements for welding during production are specified, but requirements for repair welding during operation have not been specified.4,5
Studies on repair welding are conducted in the fields of piping components, aeronautic structures, and bridges, and most of them focused on changes in the mechanical properties, microstructure, and residual stress of the weld zone after repair welding.6–12 Luo et al. 6 investigated the effect of the welding heat input in repair welding using 304 stainless steel. They reported that cracks easily occur when the welding heat input is small because the mechanical properties of the heat-affected zone (HAZ) deteriorate. Gorka et al. 7 reported that when repair welding is conducted using the S700MC steel, the impact absorption decreases, and the hardness increases in the weld metal and HAZ. Chen et al. 9 suggested a method for simulating repair welding using finite element analysis (FEA). Bonnaud 10 compared a 3D finite element model and a 2D finite element model for simulating repair welding and observed a difference in the residual-stress distributions. Schubnell et al. 11 compared the fatigue strength of welded joints made of S355J2+N and S960QL steel and their repair welds. Repair welding followed the procedure of removing material around the crack and rewelding it using gas metal arc welding GMAW). The fatigue test results showed that nearly all repaired specimens reached at least the fatigue life of the original specimen. Ahola et al. 12 investigated the fatigue strength for weld and repair weld specimen using welded high-strength steel (EQ47TM) and extra-high-strength ship structural steel grades (EQ70QT). For repair welding, TIG welding and HFMI treatments (High-Frequency Mechanical Impact Treatment) were performed after gouging the crack. The fatigue test results showed that the fatigue strength of the repair weld specimen was almost twice that of the weld specimen.
Repair welding is conducted when cracks is visible in a welded structure, and there are cases where cracks occur at the same position during operation. Studies are focused on changes in the microstructure and mechanical properties caused by repetitive repair welding at the same position.13–16 AghaAli et al. 13 investigated changes in mechanical properties when repetitive repair welding was performed using 316L stainless steel. As the number of repair welding processes increased, the grain size of the HAZ decreased, along with the hardness. Vega et al. 14 performed repetitive repair welding using API X52 PSL2 steel. They found that the hardness was increased by the first weld repairs but gradually decreased thereafter. Nascimento et al. 15 studied the change of mechanical properties when repair welding was performed using AISI 4130 steel. They prepared repair weld specimens and subjected them to fatigue tests, finding that the fatigue limit of the repair weld specimen was decreased compared to that of the weld specimen from the fatigue test results. Akyel et al. 16 studied the fatigue properties change during repair welding in high-strength steel structures. Partial repair welding approximately to the half thickness from the surface was performed rather than full repair welding in the thickness direction of the specimen. According to fatigue test results, the fatigue properties did not deteriorate even when repair welding was performed. Thus, when repair welding is performed, the change in fatigue characteristics is determined according to the material of the structure and the welding method, but the relevant studies are insufficient.
In most previous studies on repair welding, repair welding was performed after removing the same weld zone on the assumption that cracks occurred at the same location. However, in welded structures such as the bogie frame, cracks occur and propagate at the weld toe. Even after repair welding is performed, cracks appear at the weld toe. Therefore, the position of the crack after repair welding differs from that of the first crack, implying that the position of the second weld repairs is different from that of the first weld repairs. In this study, the effect of repetitive repair welding on fatigue characteristics was investigated using materials applied in railway vehicle structures. To this end, three types of specimens (weld specimen, first weld repairs specimen, and second weld repairs specimen) were prepared via gas metal arc welding (GMAW), which is used for the repair welding of the bogie frame. Fatigue tests and residual stress tests were performed using three types of specimens. Residual stress characteristics of welded specimens were verified and investigated using finite element analysis.
Materials and specimens
Materials
Figure 1(a) shows the bogie used in railroad vehicles, and Figure 1(b) illustrates the geometry and structure of the bogie frame. The bogie is composed of various parts, such as the bogie frame, wheelsets, air spring, motor, damper, and gear box. Among them, the bogie frame is a core structure that support static loads including passengers and freight as well as the applied loading of the components. The bogie frame is manufactured via welding owing to its complex geometry, and repair welding is performed when cracks occur during operation.

Railroad bogie frame and weld zone: (a) railroad bogie and (b) Bogie frame and weld zone.
Tables 1 and 2 present the chemical compositions and mechanical properties of the main materials used in the bogie frame. The main member of the bogie frame is SM355A. The transom pipe is made of STKM18B, and the bracket is made of SS275.
Chemical compositions.

Mechanical properties.

Fatigue test specimen
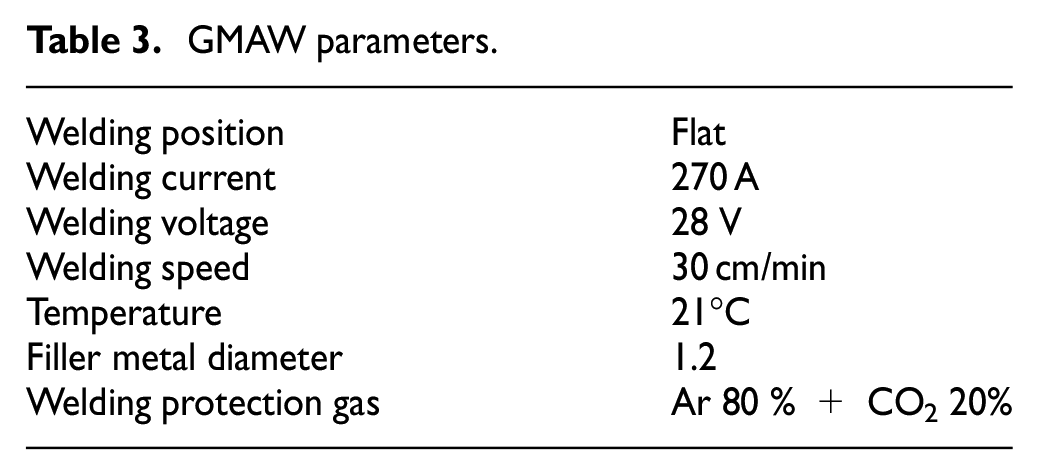
Fatigue test specimens were prepared to investigate changes in fatigue properties due to repeated repair welding. Table 3 presents the parameters for GMAW – a welding method used for the bogie frame. Three types of specimens (weld specimen, first weld repairs specimen, and second weld repairs specimen) were prepared. Figure 2 shows the geometry and size of the weld specimen. It was fabricated with a large size of 300 × 100 mm2 for application of the repair welding method. Figure 3 shows two types of repair welding methods. Figure 3(a) shows the method used for fabricating the first weld repairs specimen. In the weld zone of the bogie frame, cracks mostly occurred and propagated at the weld toe. Regarding the repair welding method of the bogie frame, the cracked area was removed via arc gouging, and repair welding was performed. For the first weld repairs specimen, it was assumed that cracks occurred at the weld toe and propagated, generating through cracks in the thickness direction. The through cracks in the thickness direction of the specimen were removed, and repair welding was performed with a ceramic backing placed on the opposite side of the specimen.
GMAW parameters.

Weld specimen.

Repair welding method: (a) first weld repairs and (b) second weld repairs.
Figure 3(b) shows the fabrication method for the second weld repairs specimen. After the first weld repairs was performed owing to cracking in the weld zone, the second weld repairs was performed when cracking occurred again. The second weld repairs was performed when a surface crack occurred at the end of the repair weld bead after the first weld repairs. The first weld repairs was performed in the same manner as the first weld repairs specimen fabrication method, and the second weld repairs was performed under the assumption that cracking occurred at the end of the weld bead of the first weld repairs specimen. For the second weld repairs specimen, repair welding was performed after removing some of the weld zone by applying arc gouging (up to 7 mm) to the end of the weld bead of the first weld repairs specimen. When repair welding is performed, the welding characteristics at the starting and ending positions are important. Thus, repair welding was applied to 60 mm within the specimen width of 100 mm. Figure 4 shows the geometry and images of the first and second weld repairs specimens.

Repair weld specimen: (a) first weld repairs specimen and (b) second weld repairs specimen
Fatigue tests
Figure 5 shows the fatigue testing system and the weld specimen placed in it. The three-point bending test was used, and the specimens were mounted so that the weld zone could be positioned below the actuator to apply a loading. A 250-kN fatigue testing machine (Instron) was used, which consisted a load cell, actuator, and a data acquisition system that collected values of force and displacement. Regarding the fatigue test conditions, the load ratio (R = Pmin/Pmax) was equal to R = 0, and the test frequency was represented by 4 Hz.

Fatigue test system and weld specimen.
Residual stress determination
The residual stresses of the weld, first weld repair, and second weld repair specimens were measured and verified using finite element analysis. Among the various residual-stress measurement methods, the cutting method in which strain gauges are attached to the measurement positions and the change in strain is measured after cutting was used in this study. Figure 6 shows three types of specimens and strain gauges for residual stress test. Because the residual stress in the longitudinal direction was important for each specimen, five strain gauges were attached along the weld bead. The resistance of the strain gauges was 120Ω and the gauge length was 5 mm. To facilitate the cutting of the specimens, the strain gauges were attached at positions 10 mm from the weld toe.

Weld specimen and strain gauges: (a) Weld specimen, (b) first weld repairs specimen, and (c) second weld repairs specimen.
Test results
Fatigue test
In general, the fatigue characteristics of a material are expressed using the S-N curve. To obtain the S-N curve, it is necessary to calculate the nominal stress of the specimen for each test loading. Thus, an FEA was conducted. Figure 7 shows the FE models of the three types of specimens. Figure 7(a) shows the FE model of the weld specimen. For the shape for the finite element analysis, the weld bead shape observed through polishing and etching after cutting the specimen was modeled. The elements used for the FEA were C3D20R (Quadratic Hexahedral Elements). The number of elements was 102,312, and the number of nodes was 436,982. The general-purpose code ABAQUS was used for the FEA. Figure 7(b) and (c) show the FE models of the first and second weld repairs specimens, respectively, which were modeled in the same way as the weld specimen. To compare the notch stress distribution at the weld toe for the three test specimens, the elements were modeled to the same size. The elements in the weld toe were designed to be square and modeled with a size of 1.0 mm. Regarding the loading and boundary conditions, two points on the lower part of the test specimen were fixed at the same point as the supported position in the fatigue test, and then a loading was applied from the top of the specimen to implement the three-point bending state, similar to the fatigue tests.

FEA models of the specimens: (a) weld specimen, (b) first weld repairs specimen, and (c) second weld repairs specimen.
Figure 8 shows the stress distribution from the weld toe under 24,400

Stress distribution at the welded part of the weld specimen (
Figure 9 presents the S-N curves of the weld specimen and the first and second weld repairs specimens. The stress in the S-N curve represents the nominal stress obtained according to the definition of EN 17149. As shown, the three types of specimens had different S-N curves. The weld specimen had the longest fatigue life, and the first weld repairs specimen had the shortest fatigue life. The fatigue life of the second weld repairs specimen was longer than that of the first weld repairs specimen.

Comparison of the S-N curves of the three types of specimen.
Residual stress
For the cutting method – one of the methods to measure the residual stress – the strain before cutting and the strain after cutting must be measured after attaching strain gauges to the specimen. Figure 10 shows the metal saw used for cutting the specimens and the datalogger used for measuring the strain. The strain was measured before and after cutting each specimen, and lubricating oil was sprayed onto the specimen during cutting to remove frictional heat. The residual stress was obtained via equation (1), using the change in the strain before and after cutting the specimen.

where,

Specimen saw cutting and DAQ for strain measurement.
Figure 11 compares the residual stress of the three types of specimens obtained via the cutting method. For all the specimens, compressive residual stress occurred at both ends of the specimen, and tensile residual stress occurred in the center of the specimen. This is identical to the residual-stress distribution of typical fillet welding. 18 In the case of tensile residual stress, the lowest residual stress occurred in the weld specimen. The tensile residual stress of the first weld repairs specimen was slightly higher than that of the second weld repairs specimen.
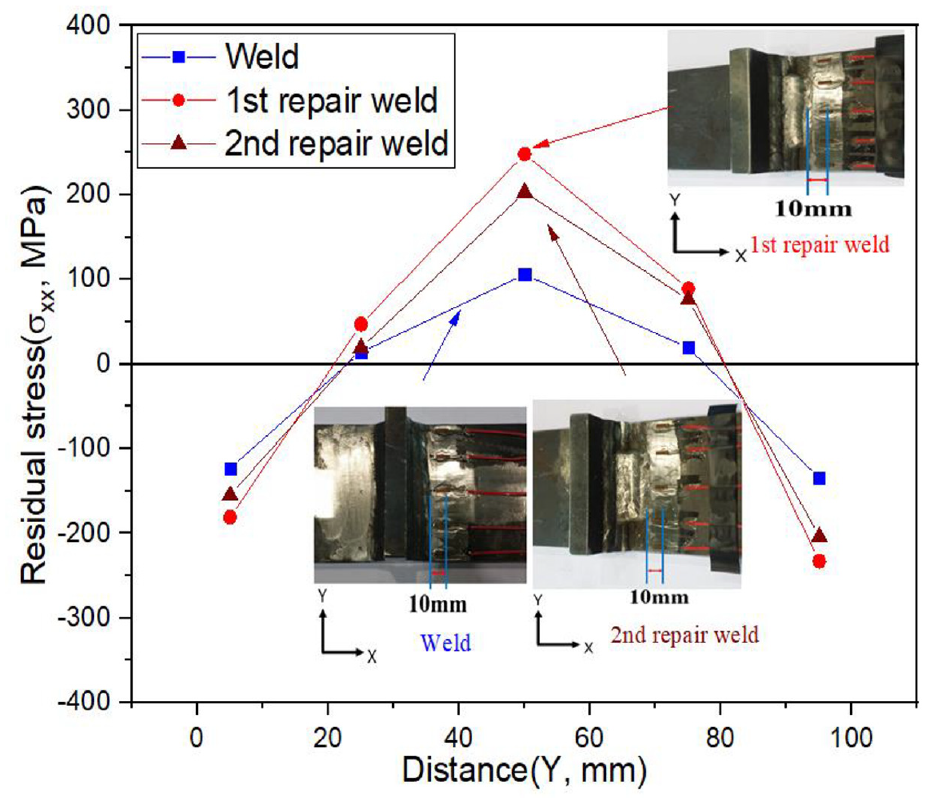
Comparison of the residual-stress measurement results of the three types of specimen.
Crack and microstructure
Crack positions
If cracks occur and propagate in the specimen during a fatigue test, the actuator displacement of the fatigue test system increases. When the displacement exceeded a preset value, the test system was stopped, and the cracks were examined using a mobile microscope. Cracks occurred at similar positions for the same fatigue specimen.
Figure 12 shows the cracks of the weld specimen after the fatigue test. In the case of weld specimens, six out of eight specimens had cracks in the center of the welded part, and in the other two specimens, cracks occurred in the center and end of the weld specimens. The cracks occurred at the weld toe, that is, the end of the weld bead, and propagated along the weld bead.

Crack positions of the weld specimen.
Figure 13 shows the cracks of the first weld repairs specimen. Crack initiated at the center of the welded part for seven specimens and at the weld toe and the center for one specimen. Figure 14 shows the cracks of the second weld repairs specimen. Cracks initiated at the center of the second weld repairs for seven specimens and at the boundary between the first weld repairs and the second weld repairs for one specimen. For most of the fatigue specimens, cracks initiated at the center of the welded part and propagated along the weld bead. In general, in the case of cracks in the welded part, the residual stress and stress concentration generated in the weld bead have a great influence on the cracks. Because the same welding method was used for all the fatigue specimens, it was assumed that the stress concentrations at the weld toe were similar. However, the residual stress depended on the three specimen types. As shown in Figure 11, the highest tensile residual stress occurred at the center of the weld for all types of specimens. This indicates that most of the cracks initiated at the center of the weld owing to residual stress. The residual stress of the weld specimen was measured to be much smaller than that of the first and second weld repair specimens. As shown in the finite element analysis results in Figure 30, in the case of the weld specimen, the residual stress at the 10 mm point was measured to be very small because the residual stress from the weld toe rapidly decreased.
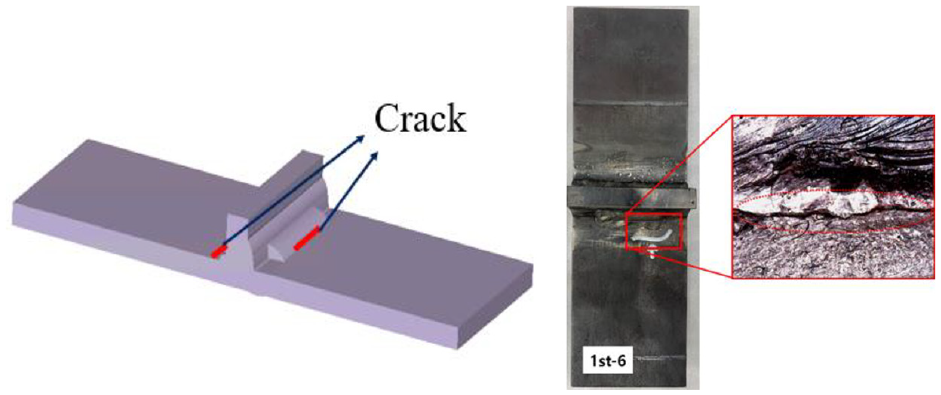
Crack positions of the first weld repairs specimen.

Crack positions of the second weld repairs specimen.
Microstructure and microhardness
To examine the weld bead shape and microstructure of the weld specimen and the repair weld specimens, the specimens were cut and polished, and etching was performed with 2% Nital solution. Figure 15 shows the internal geometry of the weld zone for the three types of specimens. Figure 15(a) shows the weld bead of the weld specimen. The base metal, HAZ, and weld metal are clearly distinguished. Figure 15(b) shows the weld bead of the first weld repairs specimen. It can be seen that repair welding was performed through the entire thickness, because through cracks were repaired. Figure 15(c) shows the weld bead of the second weld repairs specimen. The first weld repairs and the second weld repairs are distinguished. In the case of the second weld repairs, a surface crack was repaired, Repair welding was performed to a depth of about 9 mm from the surface of the weld bead.

Internal geometry of the weld zone for the weld specimen and repair weld specimens: (a) weld specimen, (b) first weld repairs specimen, and (c) second weld repairs specimen.
Figure 16 shows the microstructure of the base metal, HAZ, and weld metal of the weld specimen. The base metal was composed of perlite and ferrite as a typical microstructure. The microstructures of the HAZ and the weld metal differed from that of the base metal, and the grain sizes of the HAZ and the weld metal were smaller than that of the base metal.

Microstructure of the base metal, HAZ, and weld metal of the weld specimen.
Figure 17 compares the microhardness of three types of weld specimens. The microhardness was measured at positions 2 mm from the surface, which were close to the crack position. All the microhardness measurement positions were in the weld zone, and they passed through the first weld, the first weld repairs part, and the second weld repairs part for the second weld repairs specimen. The hardness of the first weld ranged from 180 to 200 HV for all types of specimens. However, for both the first and second weld repairs parts, the hardness was approximately 220 HV, which was higher than the hardness of the welding part. This is consistent with the phenomenon that the hardness increases at the welding part when repair welding is performed. 7

Comparison of the microhardness of the weld specimen and repair weld specimen.
Finite element analysis
Finite element model
Different factors affect the fatigue properties of the welded part, and residual stress is still important. When the residual stress is measured using the cutting method, only local parts where strain gauges are attached are measured, and it is difficult to measure the residual stress at the weld toe owing to its complex geometry. Because cracks occurred at the weld toe for the weld specimen and repair weld specimens, the residual stress had to be evaluated at the weld toe. Therefore, the residual stress distributions of the weld specimen and repair weld specimens were obtained using FE analysis.
In general, FEA for welding is conducted using the element birth technique and a heat source that moves at the same speed as the welding. In the case of repair welding, a general welding analysis is conducted first, and then a welding analysis is conducted again after removing the FE model for the part removed by gouging.19,20 For the residual stress analysis, Simufact Welding 21 –an analysis software program for welding–was used.
Figure 18 shows the CAD and FE models of the weld specimen used for the residual stress analysis. Figure 18(c) shows the weld bead of the weld specimen, which consisted of seven pieces. Figure 18(d) shows the FE model of the weld bead, which was simplified for the convenience of analysis. The elements used for the analysis were eight-node hexahedral elements. For the weld specimen, the number of elements was 88,699, and the number of nodes was 97,656.
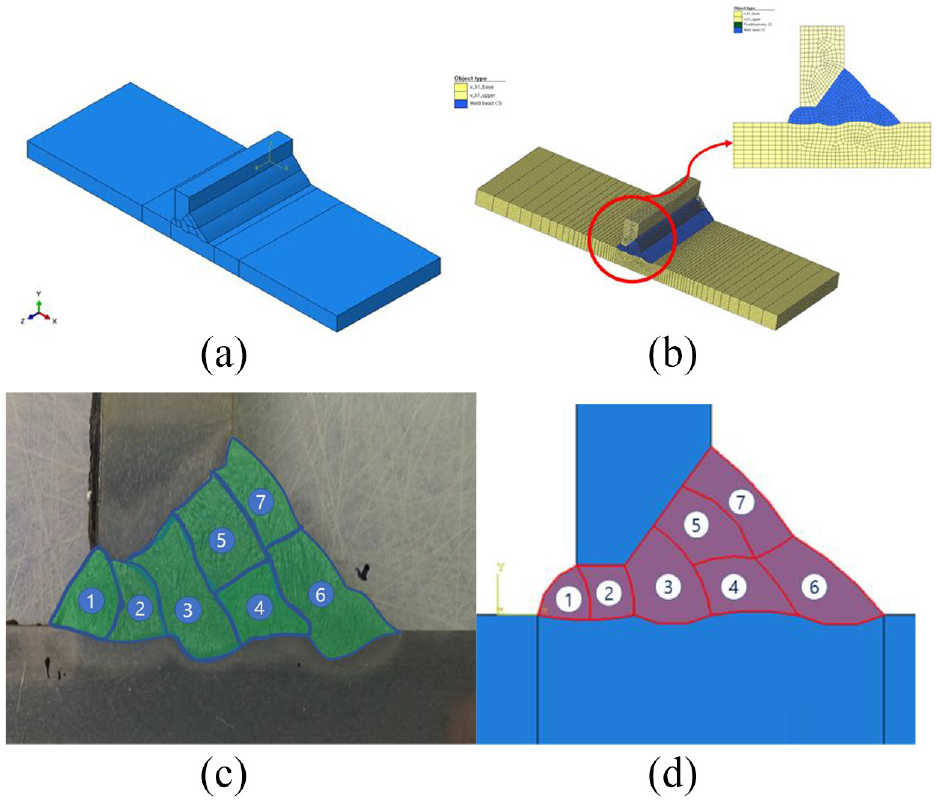
FE model of the weld specimen used for the residual-stress analysis: (a) CAD model, (b) FE model, (c) Bead of the weld specimen, and (d) FE model of the weld bead.
Figures 19 and 20 show the residual-stress analysis models of the first and second weld repairs specimens, respectively. Figure 19(c) and (d) show the weld bead and FE model, respectively, of the first weld repairs specimen. The weld bead consisted of 11 pieces. Some of the sixth weld bead was removed by gouging. The first weld repairs part consisted of four weld beads. Figure 20(c) and (d) show the weld bead and FE model, respectively, of the second weld repairs specimen, which had three welding parts. The model consisted of 14 weld beads, including seven weld beads caused by the first welding, four weld beads caused by the first weld repairs, and three weld beads caused by the second weld repairs. For the first weld repairs specimen, the number of elements was 96,205, and the number of nodes was 105,480. For the second weld repairs specimen, the number of elements was 102,401, and the number of nodes was 114,720.

FE model of the first weld repairs specimen used for the residual-stress analysis: (a) CAD model, (b) FE model, (c) bead of the weld specimen, and (d) FE model of the weld bead.

FE model of the second weld repairs specimen used for the residual-stress analysis: (a) CAD model, (b) FE model, (c) bead of the weld specimen, and (d) FE model of the weld bead.
Material properties and boundary conditions
A heat-source model must be constructed for welding analysis. In this study, Goldak’s double-ellipsoidal heat-source model, which is known to be suitable for a 3D arc heat source, was used. 22 The power-density distribution of the front quadrant of Goldak’s heat-source model is given by equation (2), and that of the rear quadrant is given by equation (3).
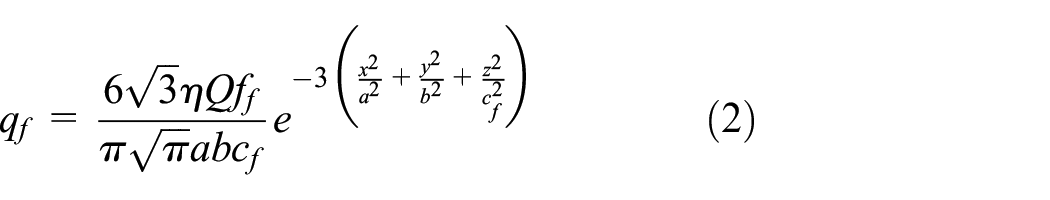

Where, Q is the heat input, η is the welding efficiency, a is the width of the fusion zone, b is the depth of the heat flux, and C r and C f are the front and rear lengths of the heat flux, respectively, as shown in Figure 21(a). f f and f r are defined as shown in equation (4).
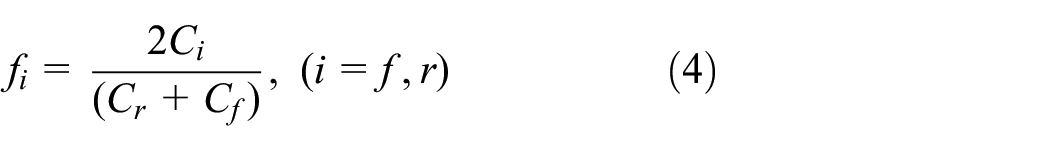
Figure 21(b) shows the weld bead and heat source model used in Simufact Welding. Table 4 shows the welding parameters used for the analysis. In Simufact Welding, the heat source is expressed as Q (J/cm), which is the energy per length, according to the welding speed, current, and voltage. Figure 22 shows the mechanical and thermal properties used for the residual stress analysis.

Welding heat-source model: (a) Goldak’s weld heat-source model and (b) Weld bead and heat source.
Parameters of Goldak’s model.


Mechanical and thermal properties of SM355.
Figure 23 shows the boundary conditions used for the welding analysis. In Simufact Welding, boundary conditions can be applied in a similar manner to actual welding conditions. The bed on which welding is performed was modeled, and welding was performed on it. The specimen to be welded and the bed were modeled under the contact condition so that the specimen could be separated from the bed during deformation after the welding. The weld specimen was fabricated by welding the top and bottom plates, and modeling was performed so that track welding could be performed on both sides at the beginning of the welding. To prevent deformation during the welding, the specimen was fixed by modeling clamps on the bottom plate, similar to the actual welding conditions.
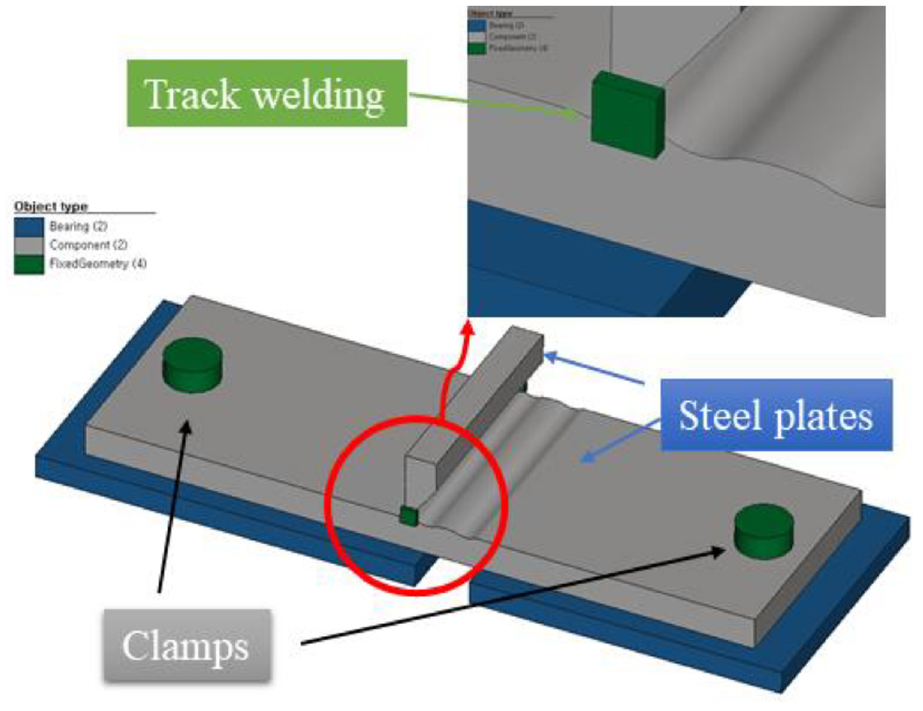
Boundary conditions.
Heat-transfer analysis and temperature distribution
Figure 24 presents the heat transfer analysis results for the weld specimen and the repair weld specimens. The heat transfer analysis was set so that the weld bead could be generated from the end of the specimen, similar to the actual welding phenomenon. As shown in the figure, as the welding progressed, the temperature increased at the welding part.
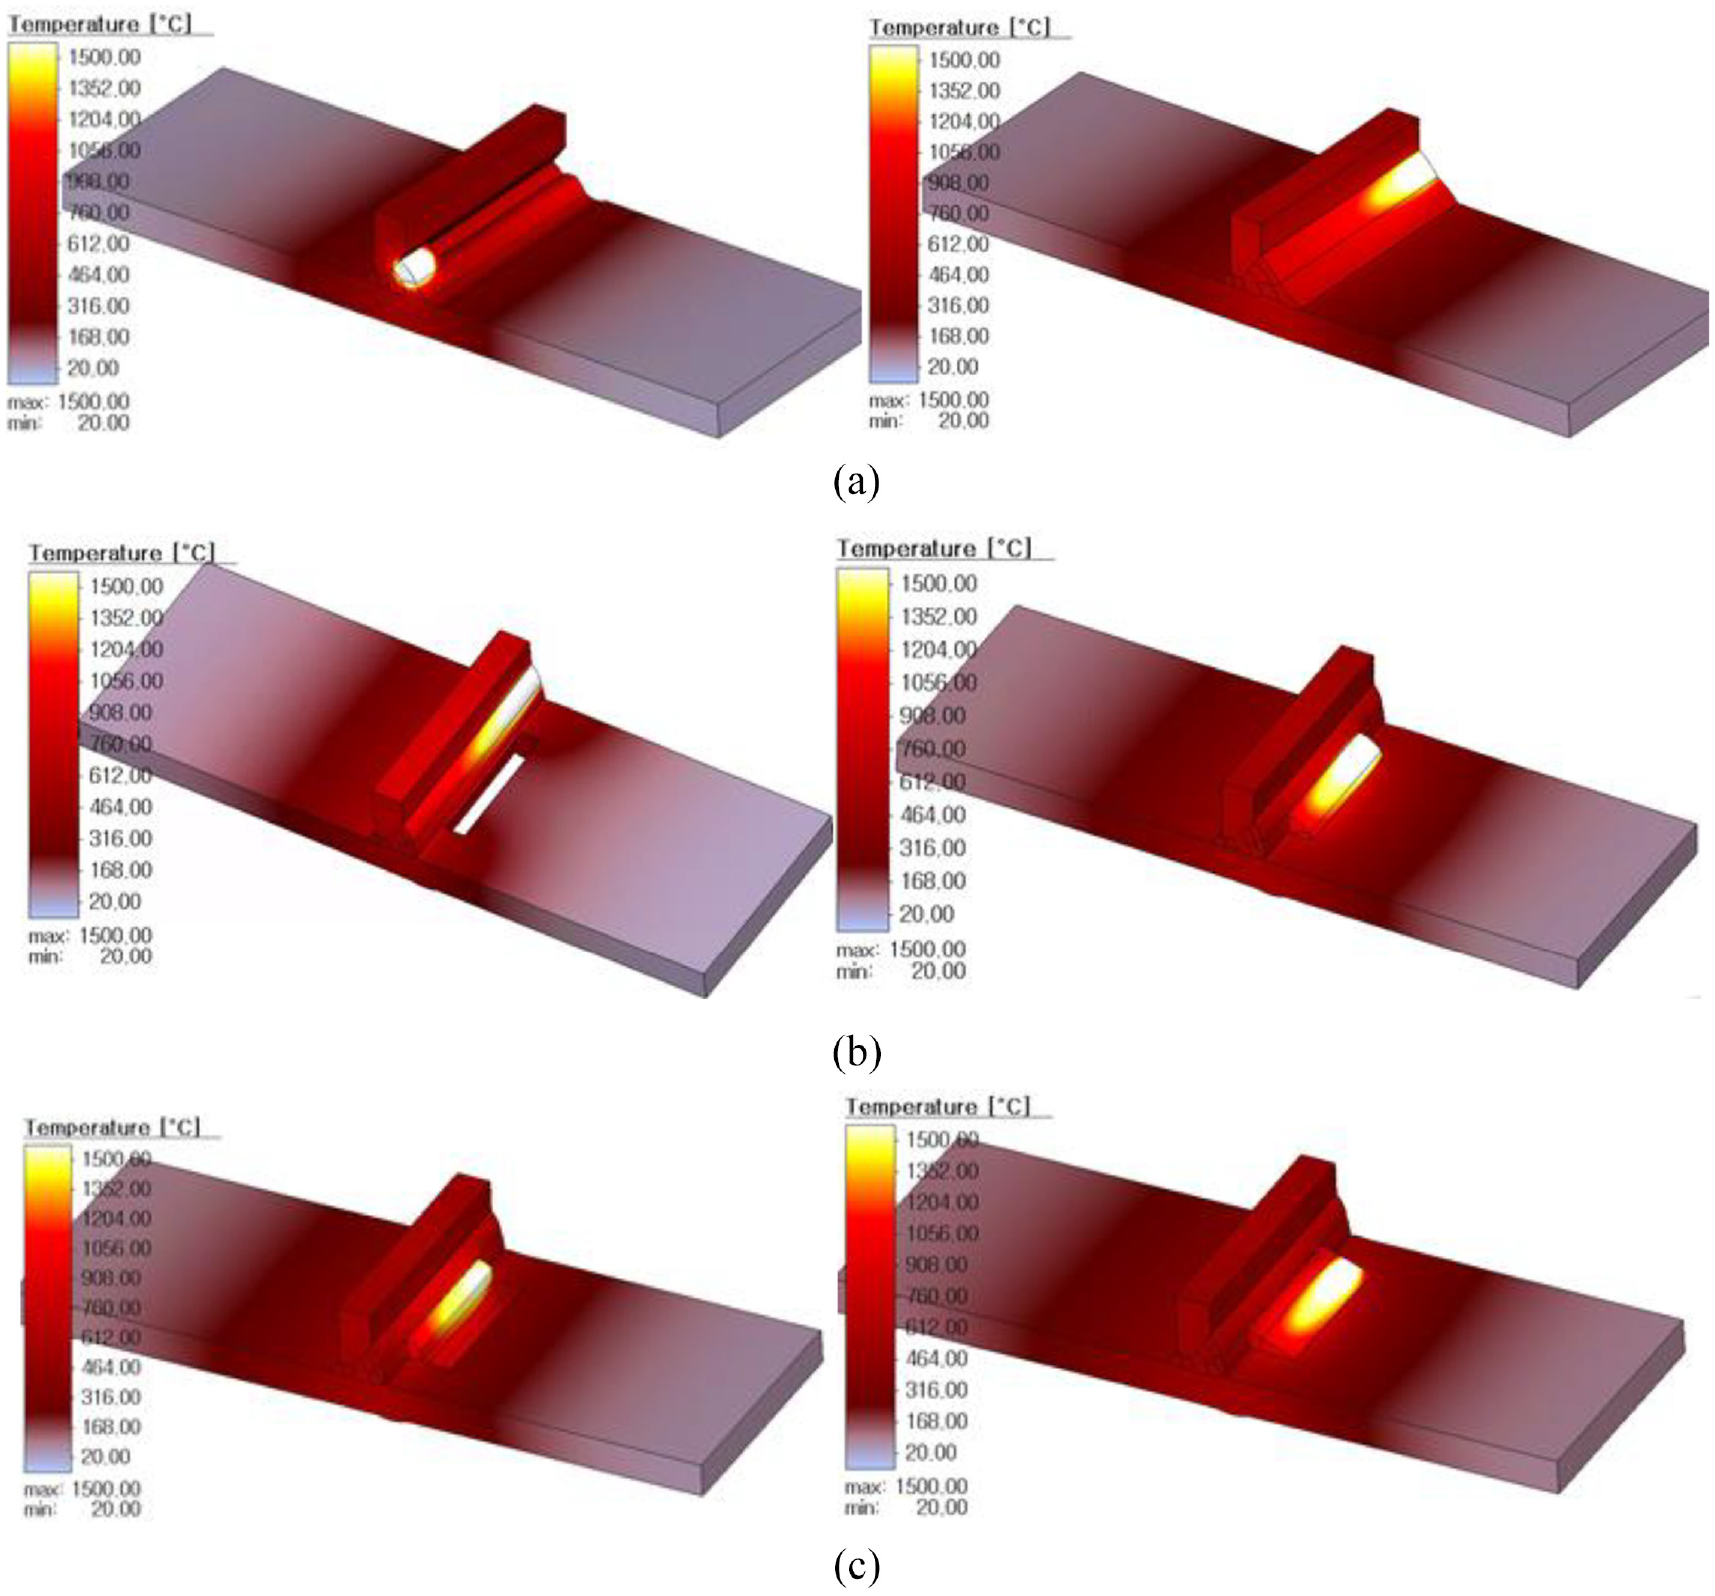
Heat-transfer analysis results for the welding and repair weld specimens: (a) weld specimen, (b) first weld repairs specimen, and (c) Second weld repairs specimen.
To verify the residual-stress analysis results, the welding and repair weld specimens were cut, and the weld beads and HAZs were compared. The FEA results for the weld zone and HAZ were compared with the test results, as shown in Figure 25. Here, the color red represents temperatures above the melting point (1500°C), yellow represents temperatures between the melting point and the solidus temperature (1300°C), and blue represents temperatures below the solidus temperature. Here, the color yellow can be assumed as the HAZ. A comparison of the weld bead and HAZ of the FEA results with the experimental values indicated that they had similar sizes.

Comparison of simulated and experimental weld-bead cross-sectional profiles: (a) weld specimen, (b) first weld repairs specimen, and (c) second weld repairs specimen.
Analysis results and discussion
Figure 26 shows the result of finite element analysis of the weld specimen. The residual stress exhibited a similar distribution to the general welding residual stress. Compressive residual stress occurred at both ends of the weld specimen, while tensile residual stress occurred at the center. As shown in Figure 26(b), the residual stress distribution of the bottom surface was similar to that of the top surface. Figures 27 and 28 show the result of finite element analysis of the first and second weld repairs specimens, respectively. As with the weld specimen, Compressive residual stress occurred at both ends of the weld specimen, while tensile residual stress occurred at the center. However, at the bottom surface, a high value of tensile stress occurred at the weld toe, because the repair weld bead generated by the first weld repairs was located at the center of the bottom surface.
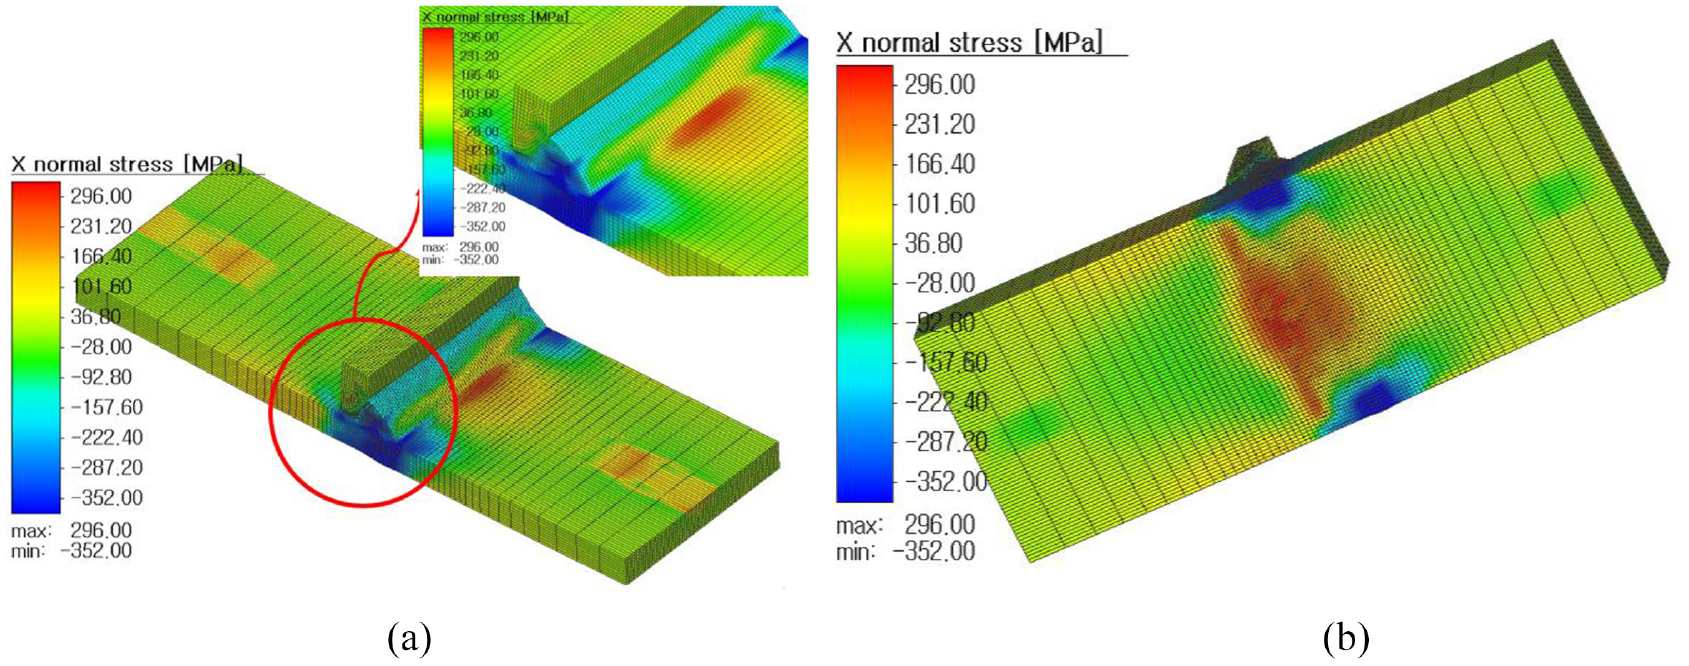
Residual stress distribution for the weld specimen (σxx): (a) top surface and (b) bottom surface.
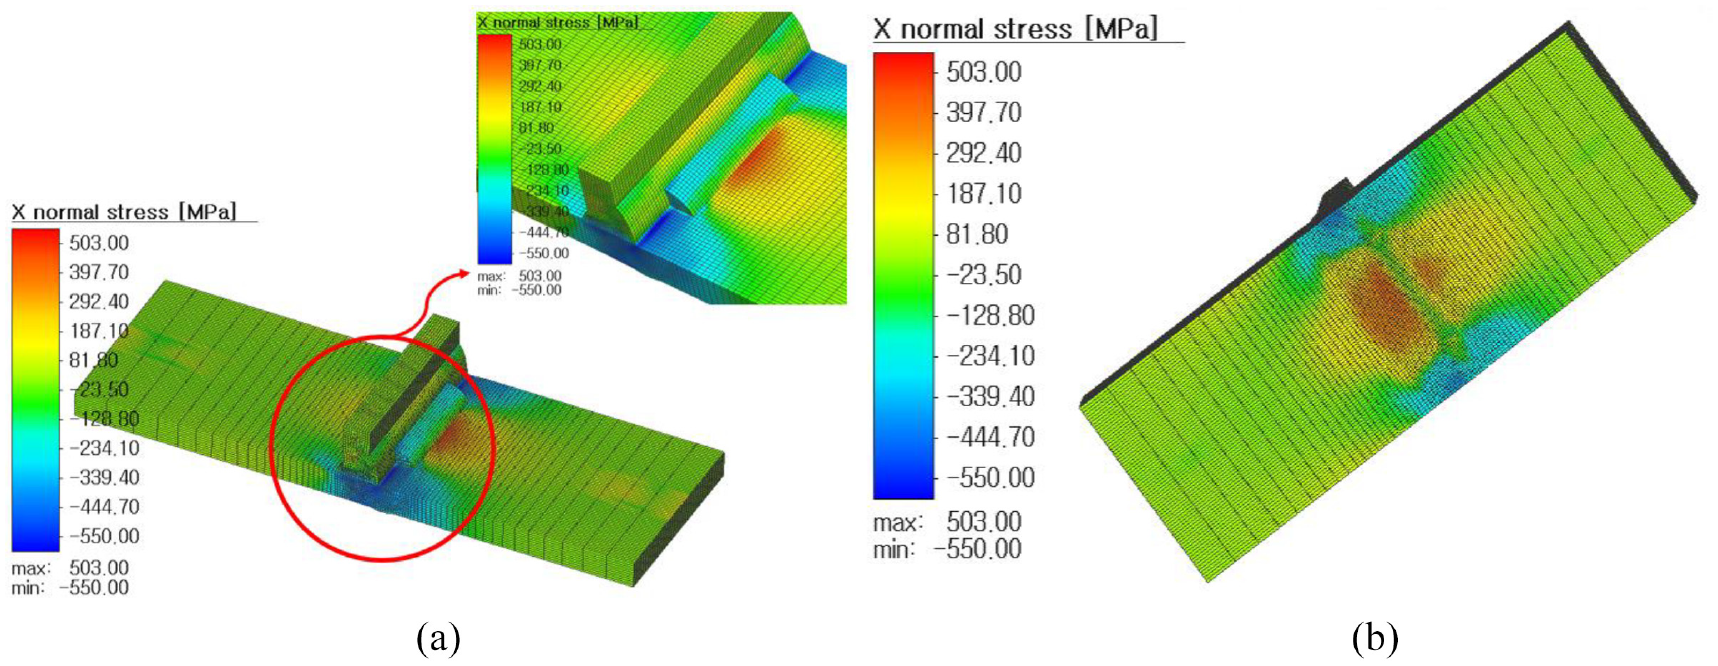
Residual stress distribution for the first weld repairs specimen (σxx): (a) top surface and (b) bottom surface.

Residual stress distribution for the second weld repairs specimen (σxx): (a) top surface and (b) bottom surface.
Figure 29 shows a comparison between the residual stress measurements and the FEA results. Because the residual stress was measured at positions 10 mm from the weld bead, the residual stress analysis results at the same positions are also shown in the graph for the FEA results. The residual stress measurements and the FEA results were generally consistent, but the measurements were found to be lower. This is because the measurements represented the average values for the strain gauge length of 5 mm. The residual stress at the center of the specimen was lowest for the weld specimen and highest for the first weld repairs specimen.

Comparison between residual stress measurements and FEA results.
Figures 30 and 31 show comparisons of the residual stress distributions of the weld specimen and two types of repair weld specimens. Figure 30 shows a comparison of the residual stresses on the top surfaces of the specimens. The three types of specimens exhibited significant differences in the residual stress at the weld toe. The weld specimen exhibited the lowest residual stress, and the first weld repairs specimen exhibited the highest residual stress. The maximum residual stress of the weld specimen (296 MPa) occurred at the weld toe. The maximum residual stress of the first weld repairs specimen was 503 MPa, and that of the second weld repairs specimen was 389 MPa.
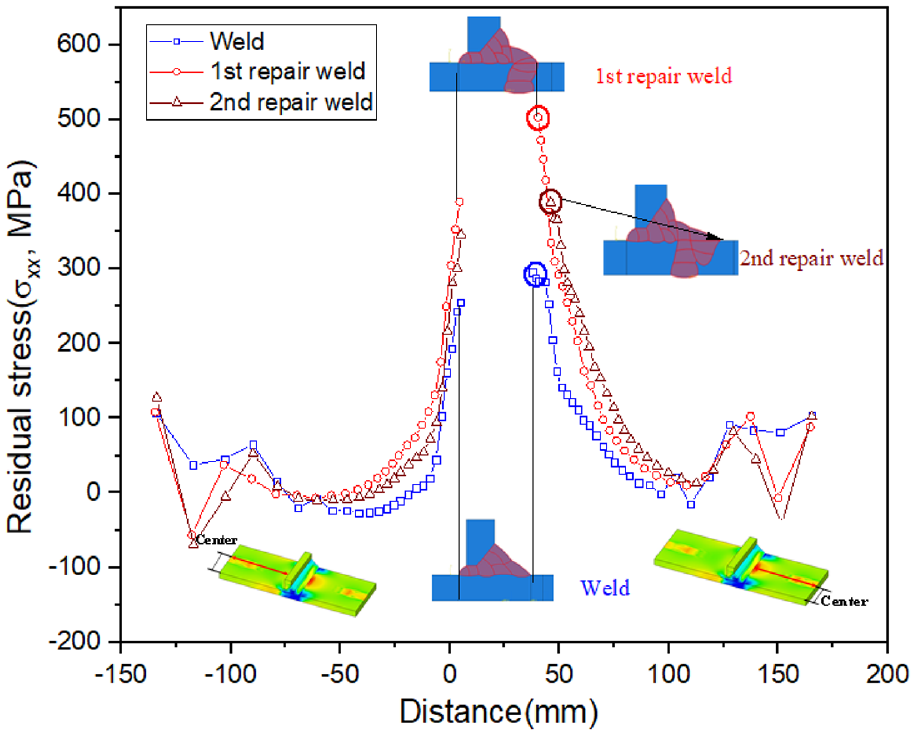
Comparison of the residual stress of the weld specimen and the repair weld specimens (top surface).
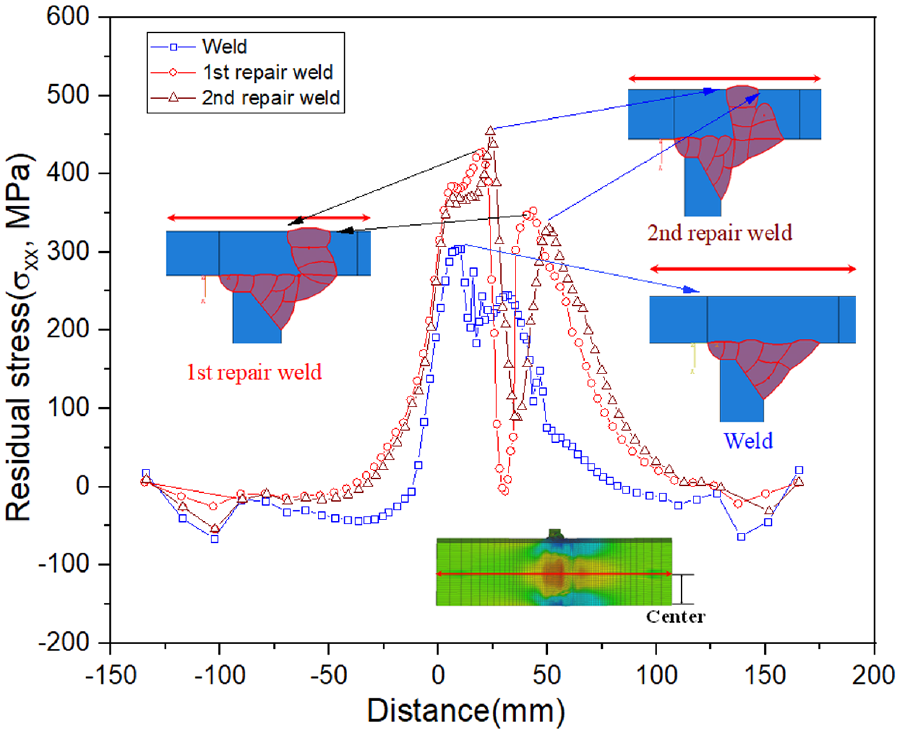
Comparison of the residua stress of the weld specimen and the repair weld specimens (bottom surface).
Figure 31 shows a comparison of the residual stresses on the bottom surfaces of the specimens. The residual stress distribution of the weld specimen differed from that of the repair weld specimens in shape, and the residual stress values were lower. In the case of the repair weld specimens, a high residual stress occurred because welding was performed to repair through cracks; thus, a large amount of heat was supplied to the bottom surface. The first and second weld repairs specimens exhibited similar residual-stress tendencies and values.
Figure 32 shows the peak temperature distributions of the weld specimen and two types of repair weld specimens. For all the specimens, the peak temperature was highest at the weld toe and decreased with the increasing distance from the weld bead. The weld specimen exhibited the lowest peak temperature, and the first weld repairs specimen exhibited the highest peak temperature. The peak temperature of the first weld repairs specimen was highest at the weld toe, and the temperature difference increased with the distance from the weld bead.
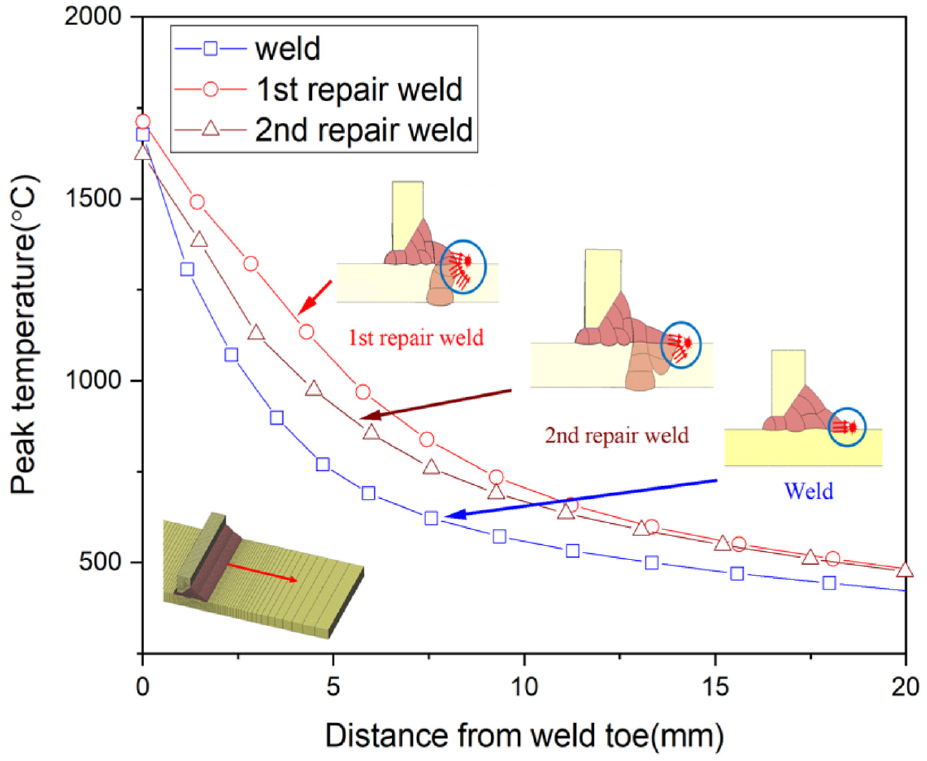
Peak temperature distributions of the weld specimen and the repair weld specimens.
Figure 33 shows the magnitude of the heat input due to welding in the vicinity of the weld beads for the weld specimen and repair weld specimens. For the weld specimen, welding heat was transferred only on the surface, because welding was performed on the specimen surface, as shown in Figure 33(a). For the first weld repairs specimen, a large amount of heat was introduced to the inside of the specimen and on the specimen surface because through cracks were repaired, as shown in Figure 33(c). In this case, before the repair welding, residual stress was removed while the crack was removed, as shown in Figure 33(b). For the second weld repairs specimen, again, a large amount of heat was introduced to the inside of the specimen and the specimen surface because surface cracks were repaired, as shown in Figure 33(e). However, the amount of heat introduced was smaller than that in the case of the first weld repairs specimen, for which through cracks were repaired because surface cracks were repaired.

Mechanism of residual stress generation during repair welding.
Owing to the heat input to the inside as well as the surface of the specimen, the repair weld specimens exhibited higher residual stresses than the weld specimen for which heat input occurred only on the surface. The first weld repairs specimen exhibited the highest residual stress because through cracks were repaired; thus, the amount of heat introduced was larger compared with the second weld repairs specimen, for which surface cracks were repaired. The first weld repairs specimen exhibited the shortest fatigue life because a large amount of heat was introduced to repair through cracks; thus, the highest residual stress was generated.
Conclusions
The fatigue properties and residual stress of SM355A – a material used in the bogie frames of railroad vehicles – for the first weld repairs and second weld repairs were investigated. To this end, fatigue tests and FE analysis were conducted, and the following conclusions can be formulated.
(1) The weld specimen, first weld repairs specimen, and second weld repairs specimen were fabricated, and fatigue tests were conducted to obtain S-N curves. The fatigue life of the weld specimen was the longest, and that of the first weld repairs specimen was the shortest. The fatigue life of the second weld repairs specimen was longer than that of the first weld repairs specimen.
(2) As a result of the fatigue test of the weld specimen, the first weld repairs specimen, and the second weld repairs specimen, most cracks occurred at the weld toe in the center of the specimen. Because tensile residual stress occurred in the center of the specimen and compressive residual stress occurred at both ends of the specimen, the crack initiated in the center of the specimen.
(3) The residual stress was measured for the weld specimen and two types of repair weld specimens, and the residual stress distribution was obtained through FEA. The maximum residual stress occurred at the weld toe at the center of the specimen. The maximum residual stress was 296 MPa for the weld specimen, 503 MPa for the first weld repairs specimen, and 389 MPa for the second weld repairs specimen; thus, the first weld repairs specimen had the highest residual stress.
(4) The fatigue life of the first weld repairs specimen was shorter than that of the second weld repairs specimen, for which the same position was repaired twice because a large amount of heat was introduced to repair through cracks; thus, the highest residual stress was generated. The second weld repairs specimen exhibited a lower residual stress than the first weld repairs specimen because all the residual stress generated during the repair of through cracks was removed by gouging before repair welding.
Footnotes
Handling Editor: Chenhui Liang
Declaration of conflicting interests
The author(s) declared no potential conflicts of interest with respect to the research, authorship, and/or publication of this article.
Funding
The author(s) disclosed receipt of the following financial support for the research, authorship, and/or publication of this article: This work is supported by the Korea Agency for Infrastructure Technology Advancement (KAIA) grant funded by the Ministry of Land, Infrastructure and Transport (Project code : RS-2021-KA163504, Development of Technology for Commercialization of Active Steering Bogie for Electric Railway Vehicle in a Sharp Curve).