
Abstract
Severe local heating and the mechanical constraints caused by the initial tack welding or clamping of parts to be arc-welded create undesirable residual stress or distortion in the parts. A three-dimensional model using a finite element method has been developed for the analysis of T-fillet welds with initially different tack-welded types. The temperature-dependent material properties, linear strain hardening, and Von-Mises yield criterion were applied in an uncoupled thermal and mechanical analyses, and the heat source of the weld has been modeled by a combination of volumetric and surface heat flux. The reliability of the modeling procedure has been verified with temperature, displacement, and residual stress measurements found in the literature and from experiments. The results show that the residual stresses and the extent of distortion are influenced by the type of constraint. The residual stress could be reduced but at the expense of enhanced distortion.
Introduction
In shielded metal arc welding (SMAW), sound connection of parts relies on intense local heat, where a certain amount of the base metal is melted and fused with the addition of filler metal. This intense heating induces a severe thermal gradient in the components of the weld, and causes non-uniform expansion and contraction of the weld and the surrounding base material. Due to the mechanical constraints imposed by the initial tack welding of the parts in the welding arrangement, the thermal gradient may produce residual stress and/or distortion in the joined metals.1,2
The distortion and residual stress in welded components are undesirable and major efforts have been directed to control and reduce them. In T-fillet welds of beams and column joints in steel constructions, different types of mechanical constraint is achieved by the change in sequence of tack welding the parts. Hence, there has been a need to study the effect of the initial mechanical constraints on structures to be welded to obtain an accurate estimation of the final deformation and residual stresses.2,3
In steel-welded structures, the distortion is due to local shrinkage in the weld caused by rapid heating and cooling, and can be categorized by longitudinal, transverse, and angular forms. 4 These are inherent deformations and their extent can be influenced by the heat input intensity, design of joint geometry, plate thickness, and ultimately by the position and sequence of tack welding of the parts during the welding process.1,2
Accurate simulation of welding process should be carried out by considering thermal, metallurgical, and mechanical aspects of the process.5–11 In many researches particularly where the weld of low carbon steel has been studied, the modeling was achieved by only sequentially coupled thermal–mechanical analysis. In this type of analyses, the thermal analysis is performed first, then using the temperature pattern obtained, the structural analysis has been carried out neglecting metallurgical aspects. In this structural analysis, the temperature field is applied as a thermal initial condition and the mechanical constraints are used as a boundary condition.
Numerous analytical and numerical models have been proposed for predicting weld distortion and residual stress. The influence of the flange thickness on welding deformation in T-fillet welded joints has been investigated by Deng et al. 5 Barsoum and Lundbäck 6 studied two- and three-dimensional (3D) finite element welding simulations of a T-type fillet weld and the residual stress measurement was carried out by X-ray diffraction technique. Although the residual stress measurement is complicated and typically obtained by errors, Pearce et al. 8 measured the residual stresses around a high-strength, quenched and tempered steel plate weld using complicated neutron strain-scanning technique. In their work, the effect of mechanical constraints induced by the fixtures or clamps on residual stresses is not addressed.
Heinze et al. 11 recently considered the restraint effects on distribution of residual stresses and distortion in butt-welded parts by a numerical analysis. The importance of structural characteristics of the welded construction on residual stresses was analyzed and an appropriate boundary condition for mechanical constraints was applied in their structural analysis. Also, Liu and Zhang 12 discussed the effect of clamping force on residual stresses. However, the different mechanical constraints produced by changes in the sequence of clamping were not discussed even for conventional T-fillet welds.
In this study, a thermoelastic–plastic finite element method (FEM) is employed to estimate the temperature field and induced inherent deformations in the T-fillet welds. Also at different mechanical constraints, the residual stresses and distortions are estimated. The ABAQUS/Standard finite element code is used in the FEM simulation. Experiments have been carried out to verify the simulated results for temperature gradients and distortions.
Experimental procedures
In order to verify the results of finite element (FE) simulation, the experimental measurements were carried out on a T-fillet welded joint. The dimensions of flange and web plates, and welding positions are shown in Figure 1. The T-fillet welded structure was constructed from a general structural steel whose composition is given in Table 1.
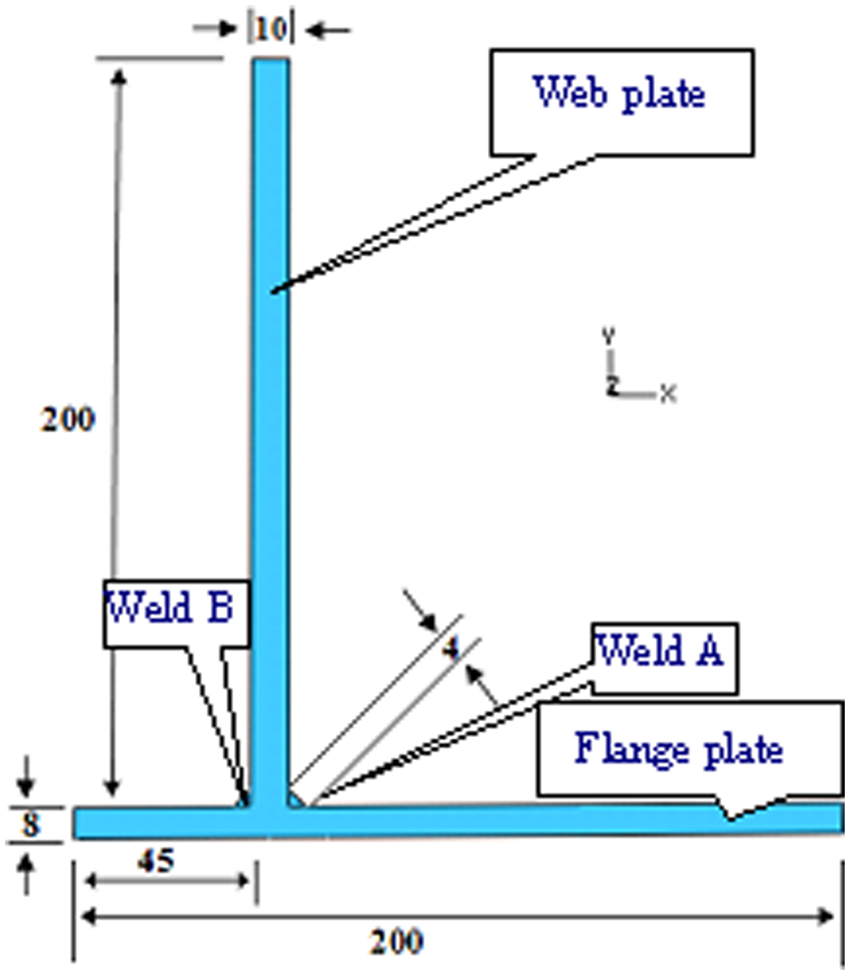
Geometry of flange and web plates, and welds.
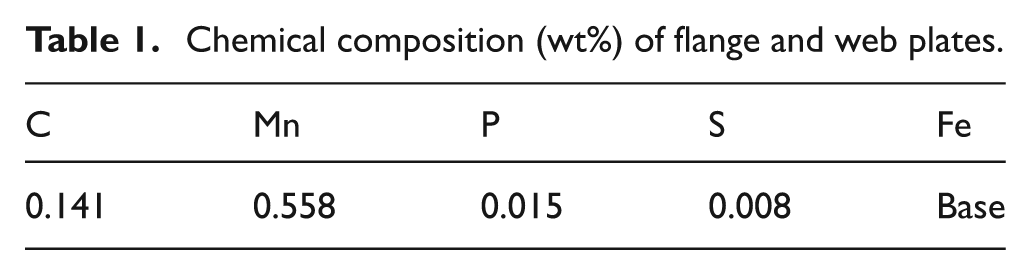
Chemical composition (wt%) of flange and web plates.
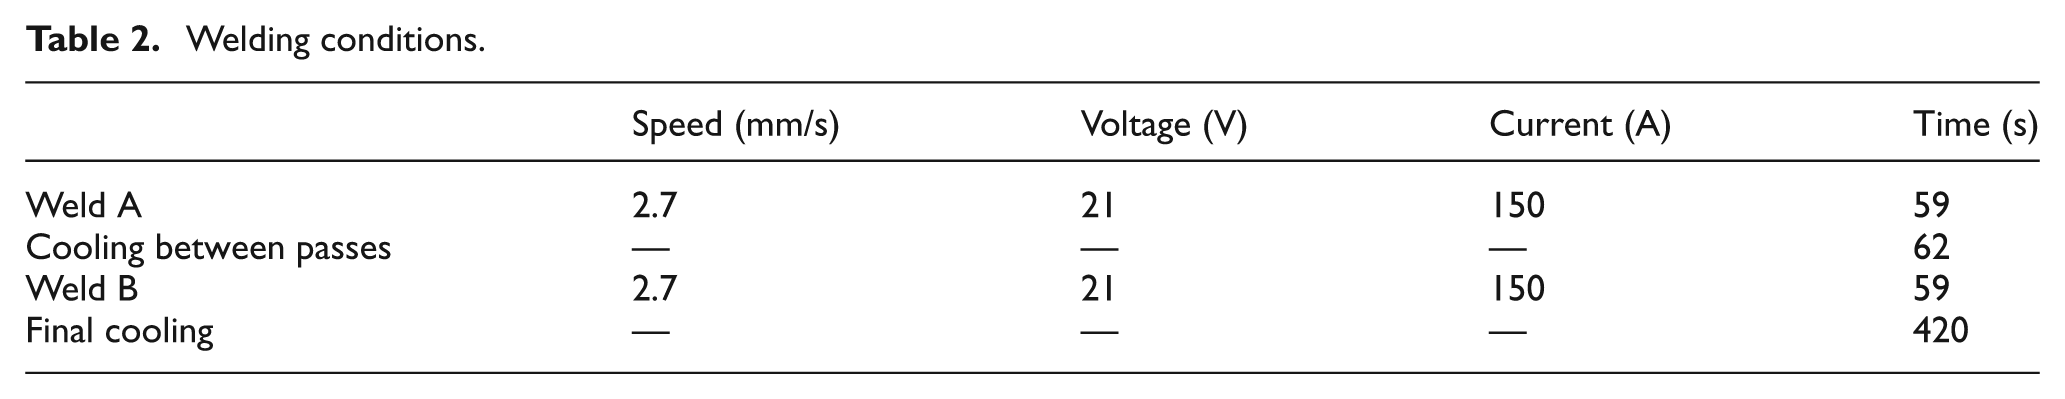
The SMAW method was used with a 3.2-mm diameter E6013 electrode. Table 2 shows the welding conditions.
Welding conditions.
An infrared thermometer was used to record the temperature near the fusion zone (FZ) during heating and cooling cycles. The experimental setup, position of the temperature measurement points, and the location of the infrared thermometer is shown in Figure 2.
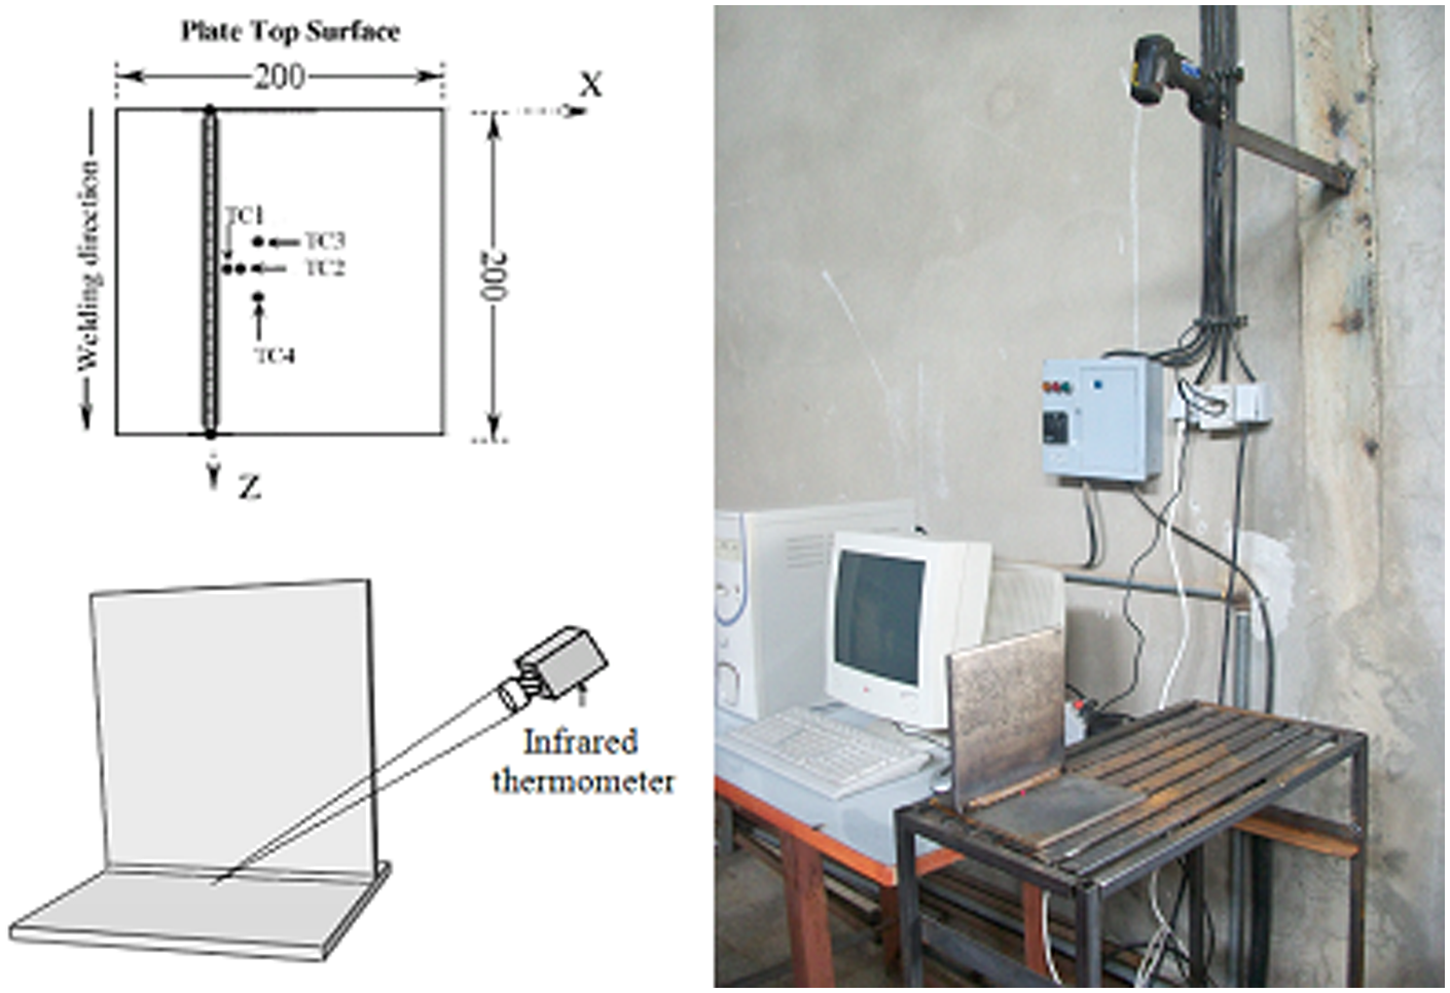
Weld direction, experimental setup, and infrared thermometer geometry used in experiments.
An indicator gauge with an accuracy of 0.01 mm was used for measuring the deflections at various points on the upper surface of the flange plate after welding. The paths selected for measurement deflection of flange plate is shown in Figure 3.
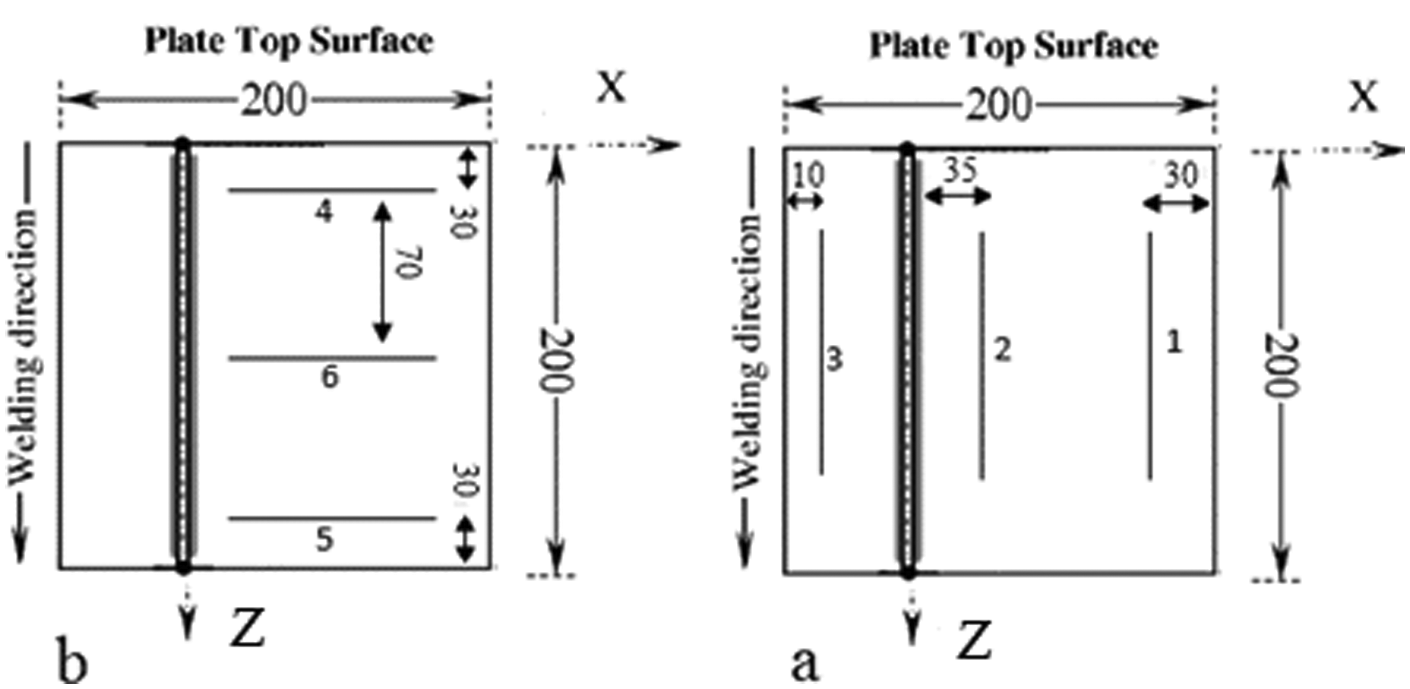
Description of paths selected for measurement deflections in flange plate.
The optical microscopy was used to examine the interface between the welded parts. In order to distinguish the microstructures, the welded samples were cut perpendicular to the welding direction. The cut surfaces were ground with 240, 600, 800, and 1200 grinding paper, and etched with a Nital 2% (nitric acid in ethanol) etchant for revealing the microstructure; a sample of photographs is given in Figure 4.
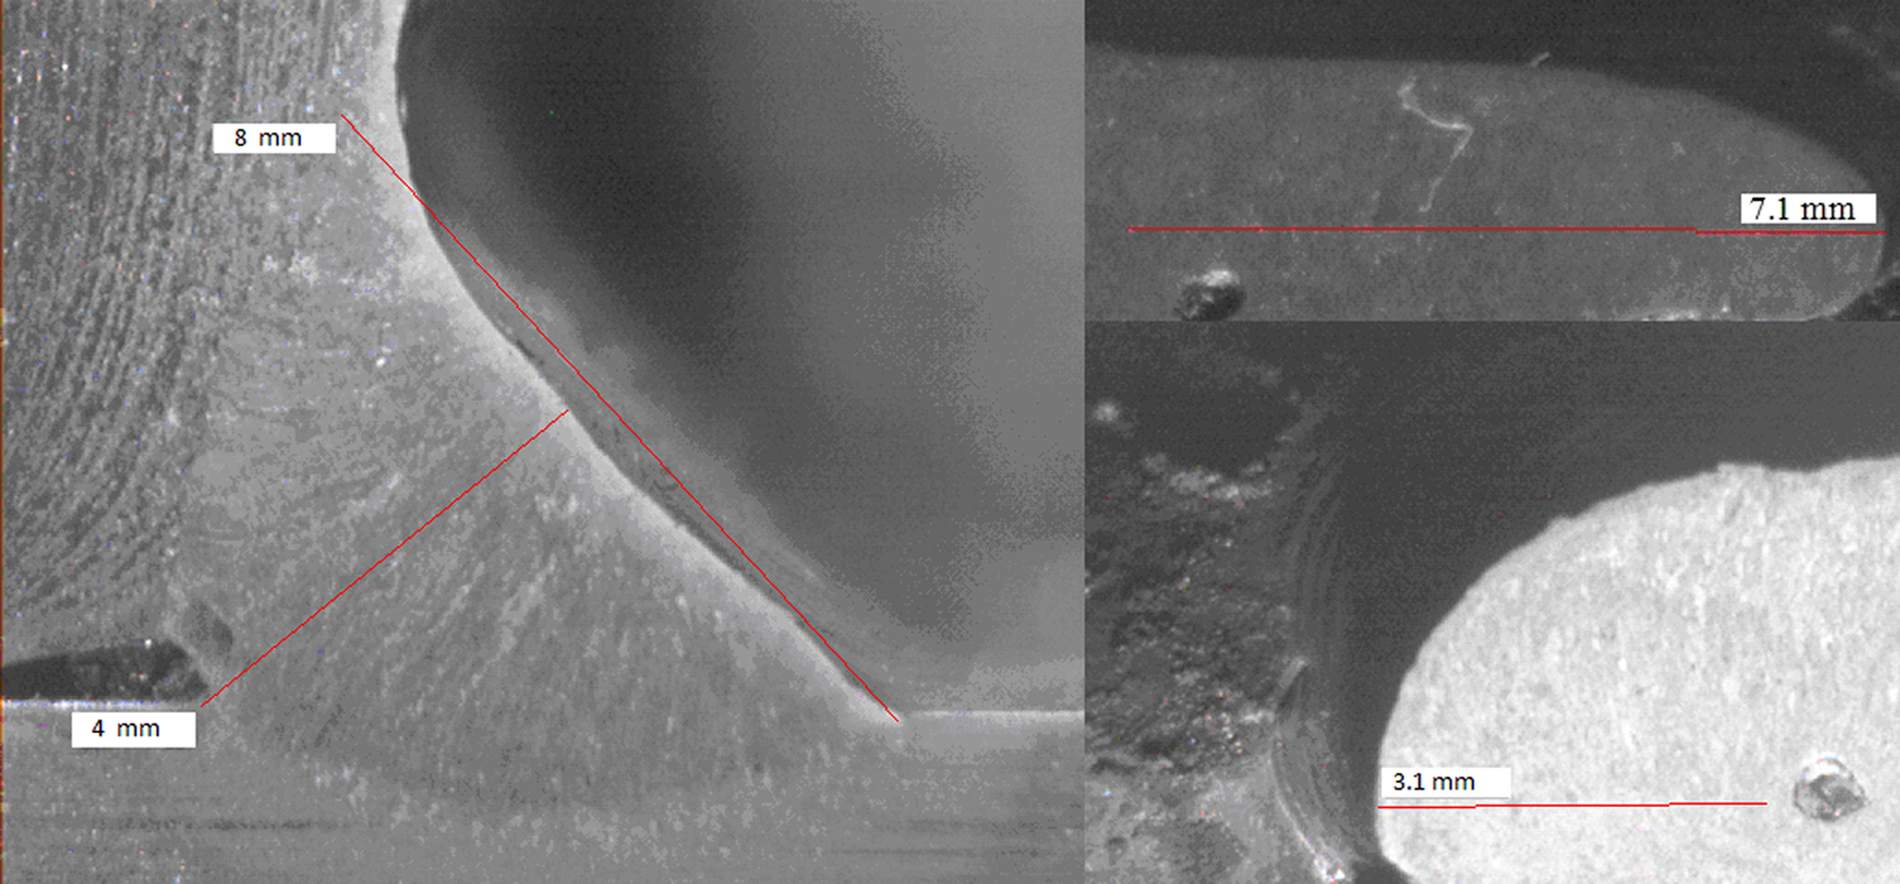
Optical microscopy of the fusion zone.
FEM simulations
In this section, a thermal elastic–plastic finite element computational procedure using the ABAQUS 6.10-1 code is developed to calculate the temperature field, deformations of fillet-welded joints, and residual stresses. The thermomechanical behavior of the welding joints is simulated using an uncoupled formulation, because mechanical work done is insignificant compared with the thermal energy from the welding heat source.
The temperature-dependent thermal–physical properties of steel such as specific heat, conductivity, density, and temperature-dependent thermal–mechanical properties, such as Young’s modulus, Poisson’s ratio, thermal expansion coefficient, and yield strength are used for thermal and mechanical analysis, respectively. Figure 5 shows the variation of these parameters with temperature. In this work, the mechanical properties of the weld metal are considered to be the same as the parent metal. 13
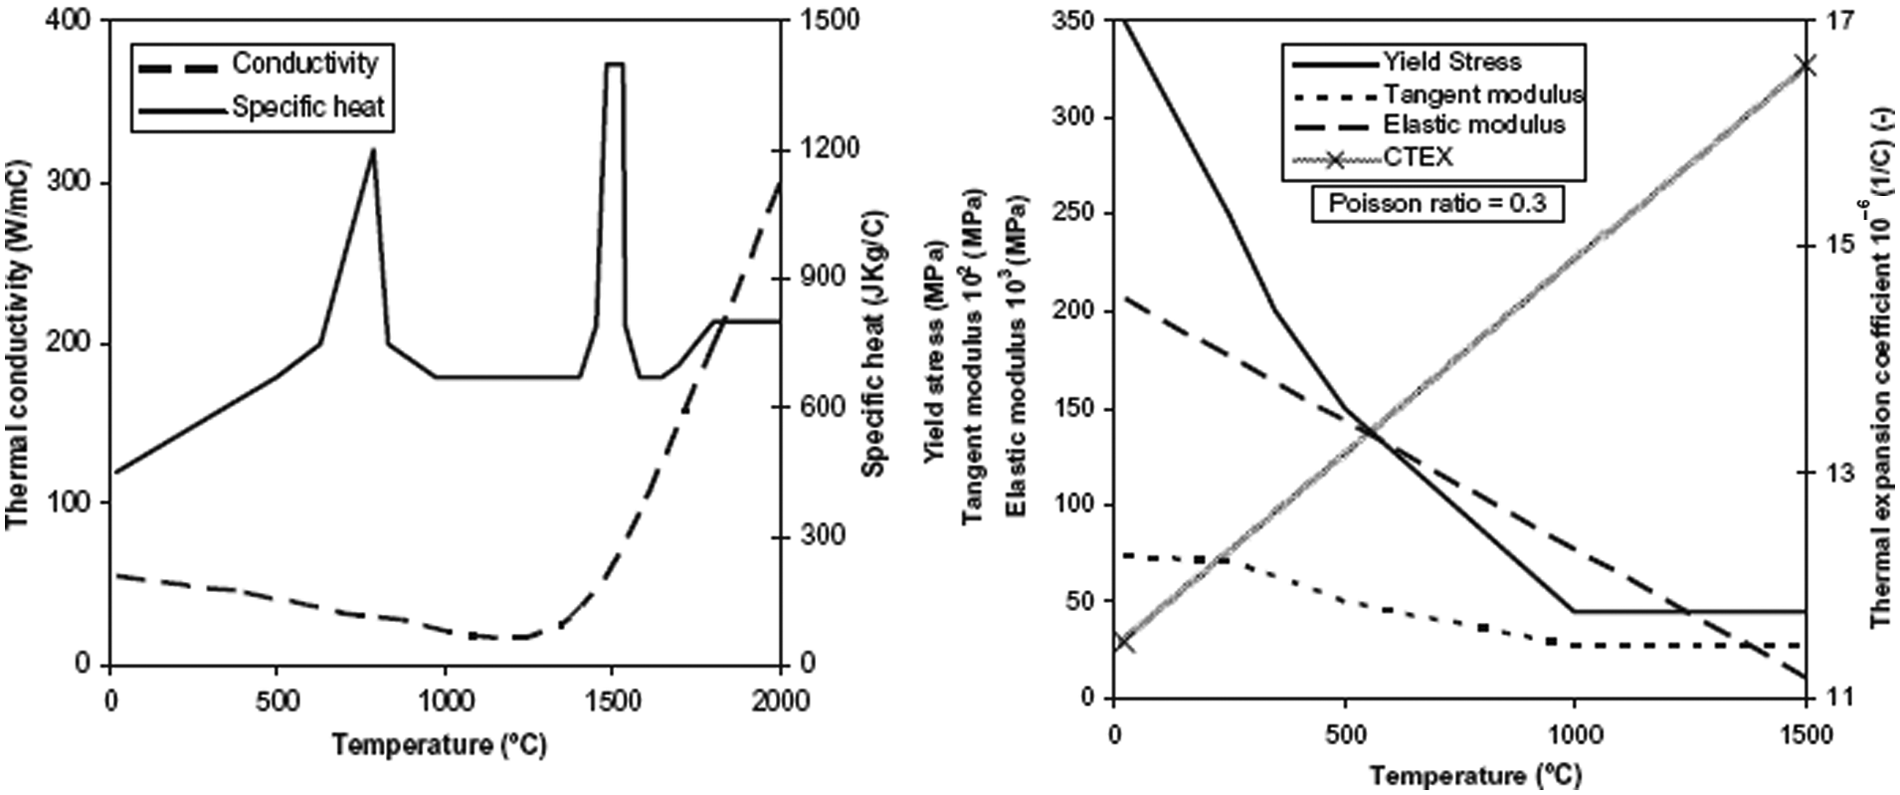
Thermal–physical properties and mechanical properties of steel structure. 6 CTEX = Coefficient of Thermal Expansion.
The analysis is performed in two stages: first, the temperature distribution is computed using a heat source model and heat conduction analysis. This is then used as an initial condition in the subsequent mechanical analysis. The eight-node linear transfer brick element (DC3D8) has been employed in a 3D thermal analysis, and structural analysis has been achieved using the eight-node bi-quadratic stress/displacement quadrilateral element with reduced integration points (C3D8R).
The mesh density analysis in order to obtain the best accuracy of the results has been evaluated; the appropriate mesh density is obtained where the smallest element size is fixed to be 2 mm × 2 mm × 1.7 mm approximately. A relatively dense mesh has been adopted close to the weld line in order to accurately represent the temperature and strain gradients; further away, the size of elements were made larger. The complete model contains approximately 5800 elements and 7700 nodes.
The technique of element birth and death has been adopted to simulate the adding of beads by the electrode and activating elements. All elements were initially created with the same physical properties; however, the elements in the weld beads and which were born in the later stages of the process are subjected to change in the stiffness value.
Heat source model
The heat source simulation of the weld has a major influence on the prediction of weld pool dimensions and gradient of temperatures. According to the nature of the welding process, the heat input to the work piece for SMAW can be divided into two parts, namely, surface heat flux that concerns the heat energy transferred by radiation from the arc and the volumetric heat flux from the thermal energy of molten metal droplets. In this analysis, the surface heat flux is modeled by a Gaussian distribution, whilst the volumetric heat flux is modeled uniformly. The rear and front sides of the electrode in the welding process have dissimilar thermal regimes due to the absorption of thermal energy by the molten metal in front and ejection of energy from the rear side due to the occurrence of the solidification process and latent heat. The surface heat flux for front and rear side of welding zone has been modeled by the following equations 14
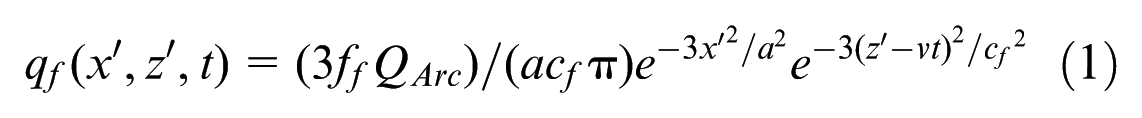
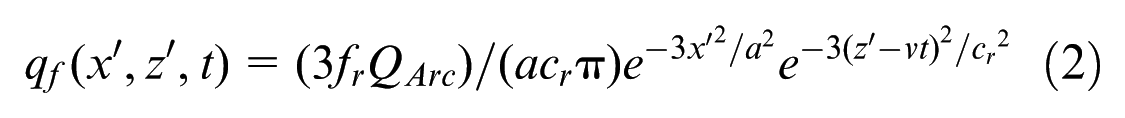
where
The total power from the welding arc (Q Arc ) and volumetric part of the heat source (Q Wire ) that is attributed to the power of the molten metal droplets are given in equation (3). In equation (3), h is the arc efficiency, I is the arc current, and U is the arc voltage as follows
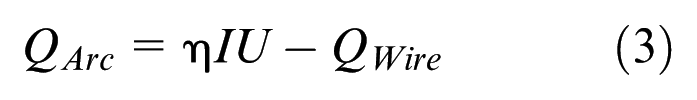
In this thermal analysis, the heat flux from the molten metal droplets is assumed to be 70% of the total heat input, and the surface heat flux 30%, also the arc efficiency, h, is assumed to be 0.7.
A user subroutine (DFLUX) has been defined in the ABAQUS code for modeling the moving surface heat flux source.
The convection and radiation are both taken into account in modeling the boundary condition of thermal analysis, and their combined effects are represented via the following equation for heat transfer coefficient, h 13
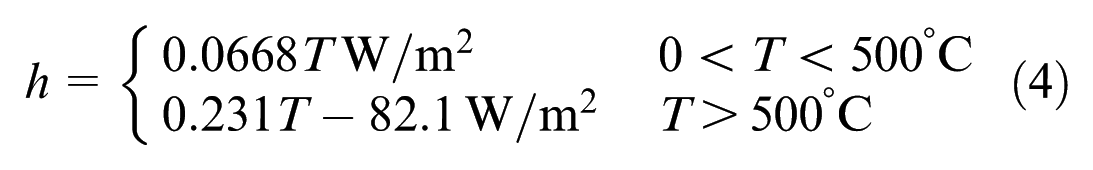
The user-defined subroutine FILM has been developed to simulate the combined thermal boundary condition in the ABAQUS code.
Mechanical (structural) model
The second part of the simulation, the mechanical analysis, uses the thermal histories predicted by the first part of the model. Due to the temperature gradient, the thermal strain is computed using the temperature-dependent coefficient of thermal expansion. The material behavior and the types of constraints determine the final residual stresses. The types of mechanical constraints that were used in numerical simulation are shown in Figure 6.
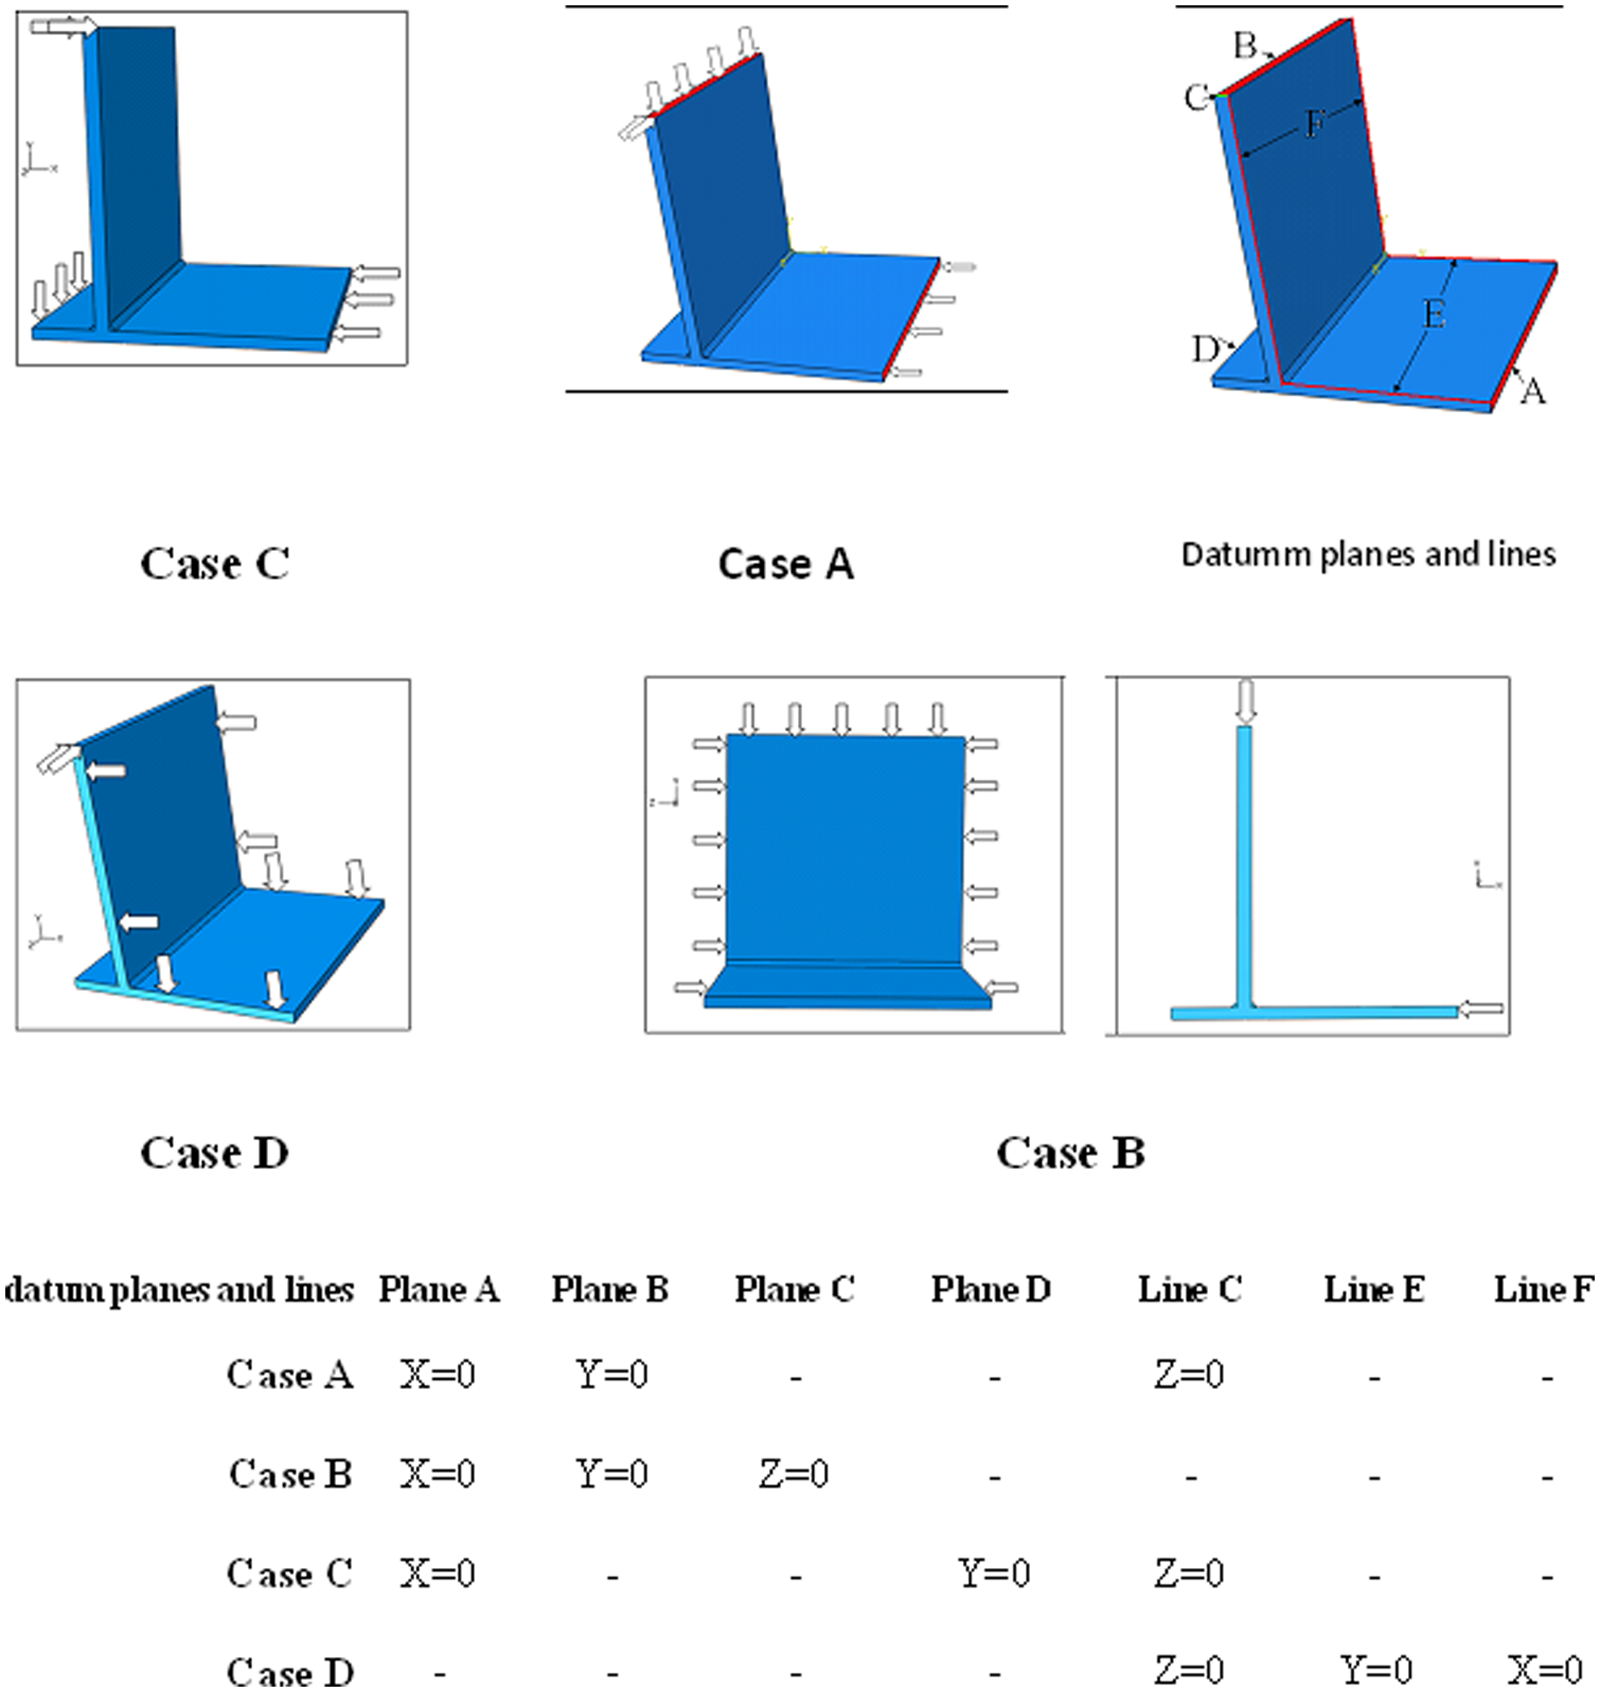
Types of mechanical constraint and their descriptions based on the restrains for deformations with respect to the datum planes and lines applied in modeling process.
In this research, four different types of constraint have been examined. The tack weld of the beam to column in Case A is arranged to prevent elongation of the web and flange plates. Case B has more constraints than in Case A for deformation in the z direction. Whilst Case C allows the deformation of the longer side of the flange plate in y direction, the shorter side is kept fixed (deformation in y direction is prevented in plane D). In Case D, the angular deformation of the flange and web plates is restricted. These are provided in numerical modeling of the weld process by appropriate structural constraints as a boundary condition in structural analysis.
Results and discussion
Thermal results
The predicted temperature distribution near the heat-affected zone (HAZ) is shown in Figure 7(a). Figure 7(b) shows a section of the welded plate based on measurement of the HAZ zone by optical microscopy and chemical etch of the weld surfaces. Comparison of the two profiles in Figure 7 shows that the geometry of the weld pool is similar to the profile of the high temperature regions. This suggests good agreement between experiment and the assumed heat source model. Figure 8 shows the temperature profile predicted by the FEM analysis in plates during the weld process. In Figure 8(a), the time–temperature profile at a specified point (TC1) is compared with the experimental measurement. Good agreement between the results has been observed. Similar results also obtained for other thermal calibration points (TC2–TC4). Figure 8(b) shows a contour plot in scale of degree Celsius for temperature that represents high gradient of temperature in plates during the weld process.
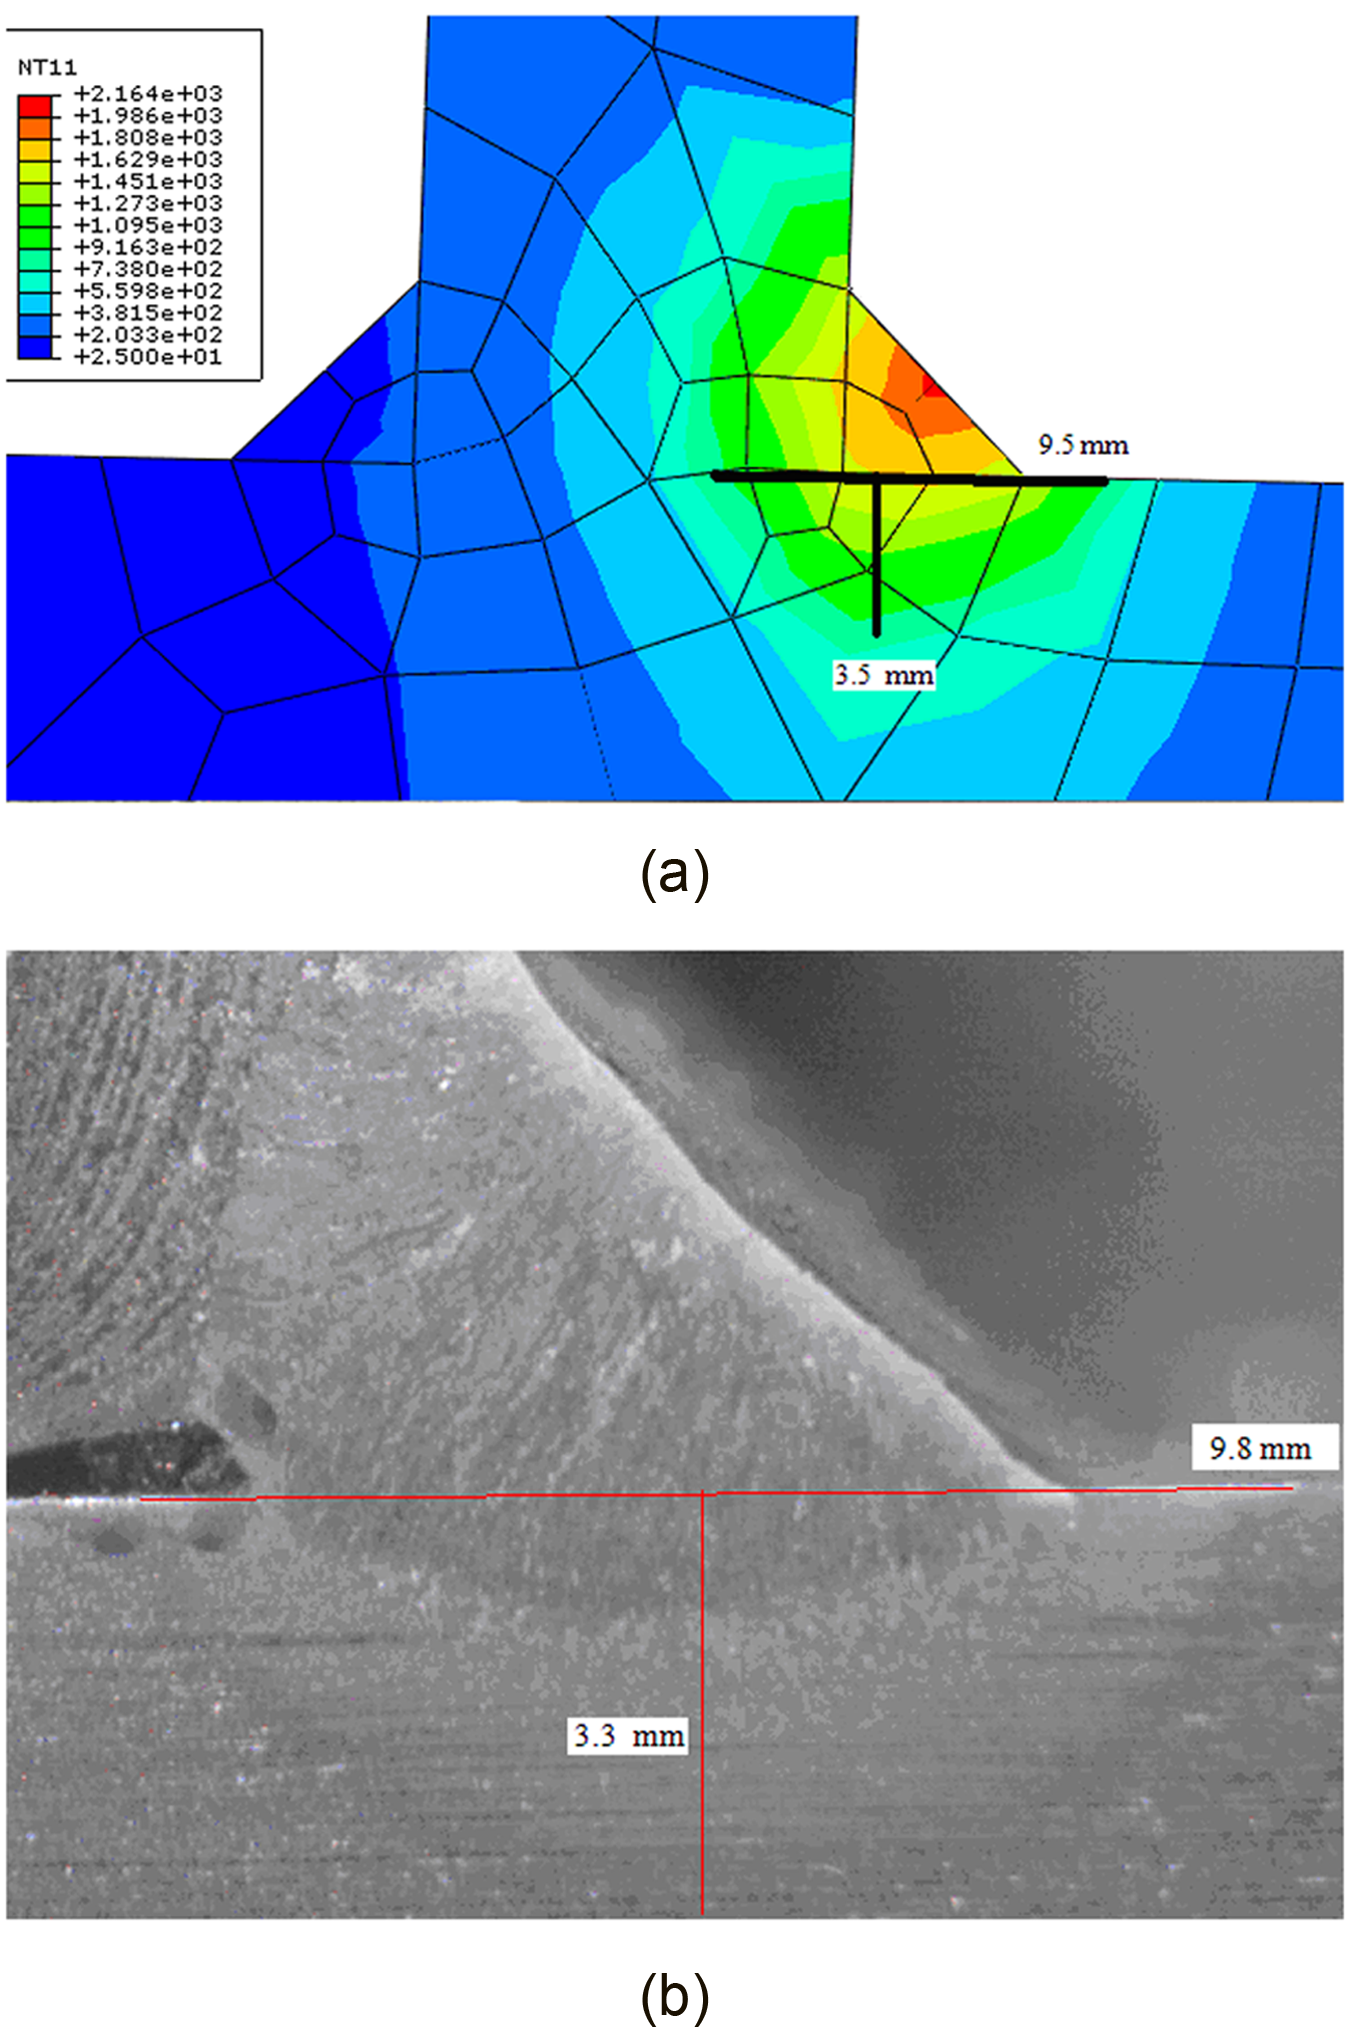
Sectional view of the weld pool analyzed by: (a) finite element modeling result, and (b) metallographic and chemical etch of a specimen.
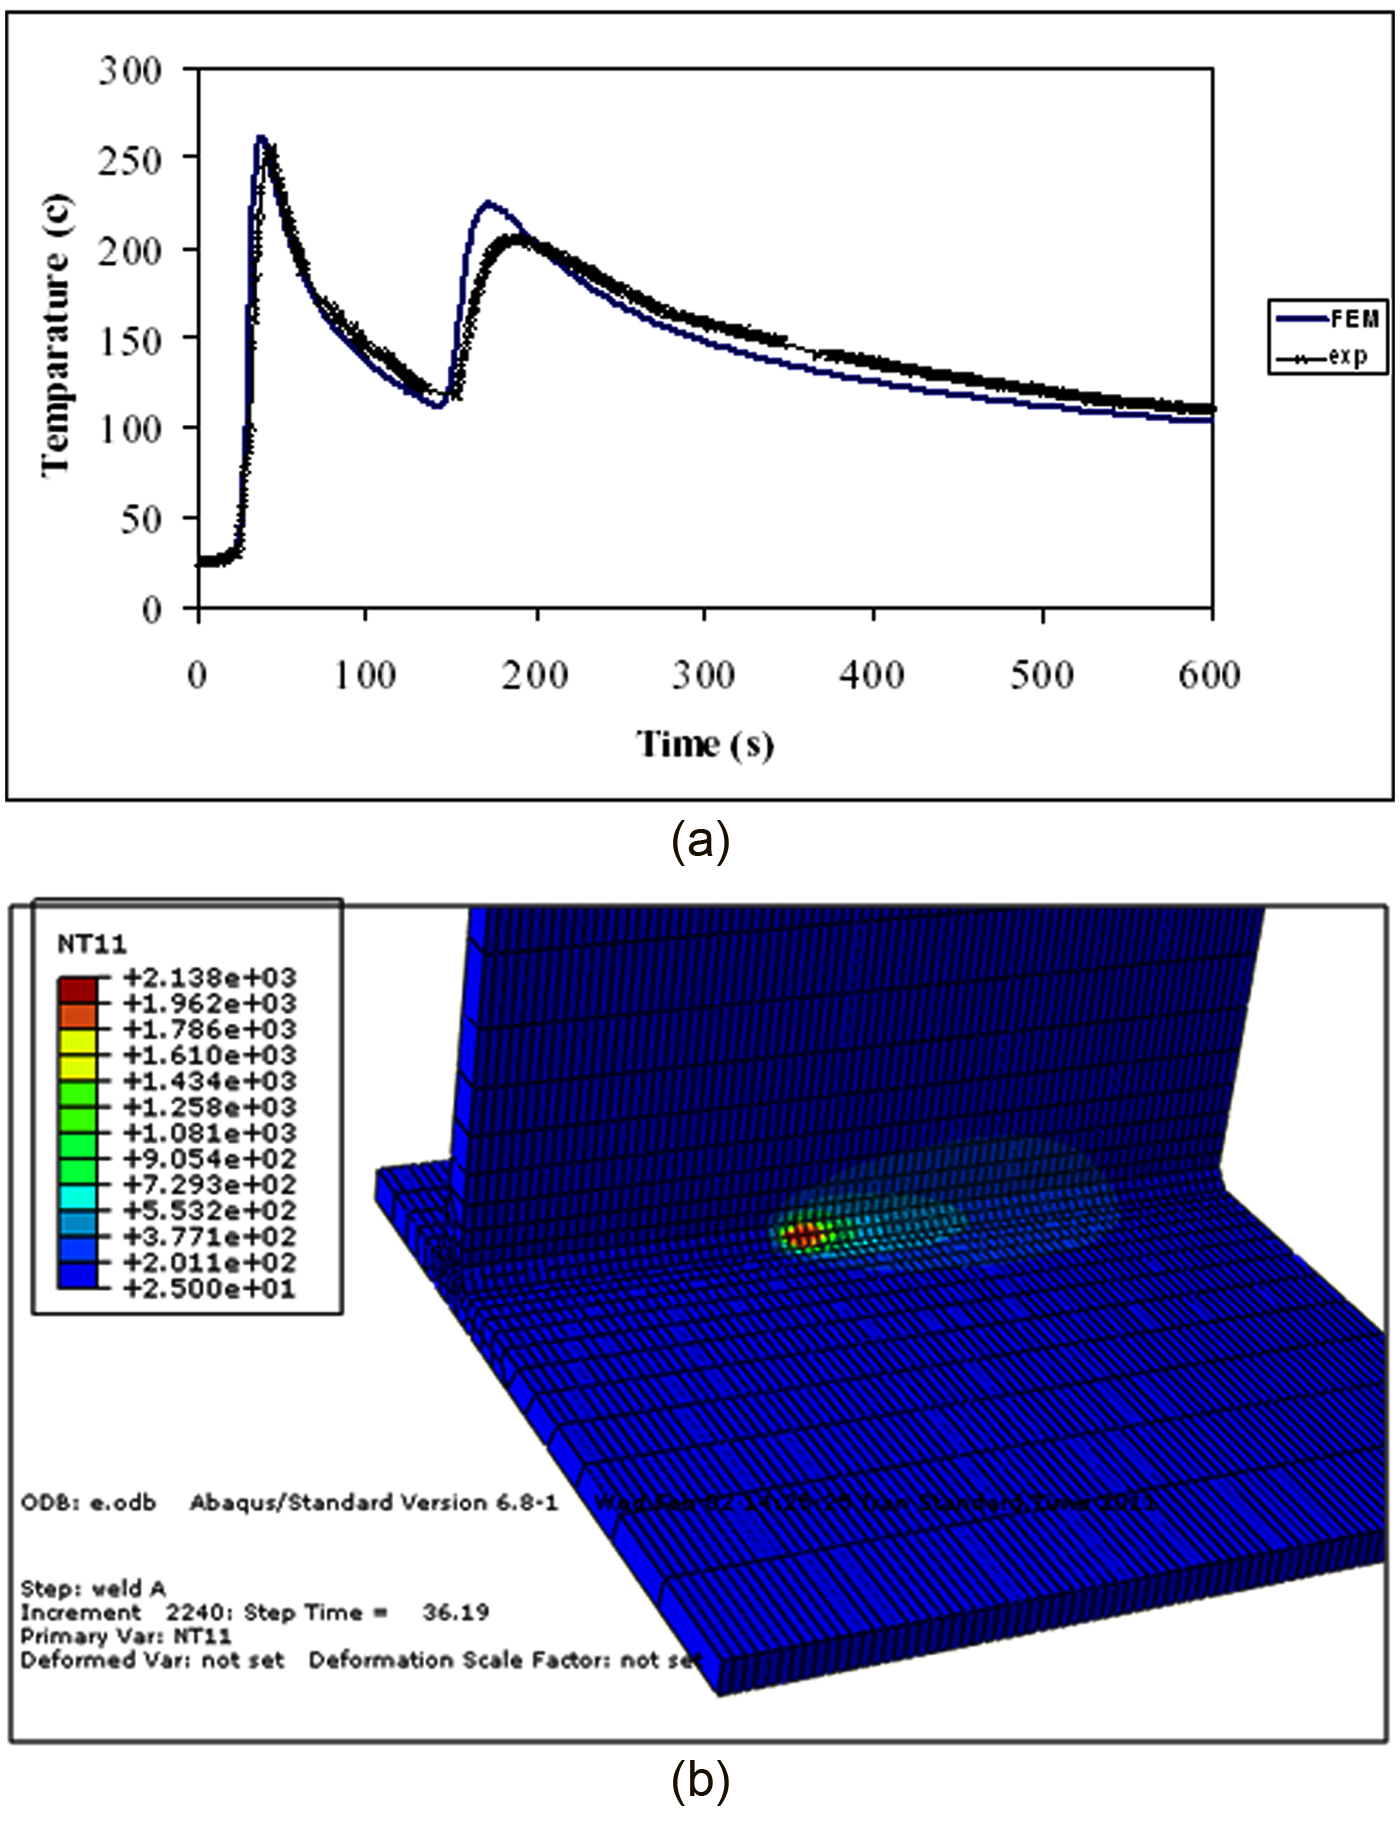
Temperature profiles (a) at point TC1 (x = 12 mm and z = 100 mm) compared with the FEM result and (b) in flange and web plates during the weld process in scale of degree Celsius.
Figure 9 shows the temperature–time history for points A and B located at the weld toe of the weld lines. It indicates that the rate of heat conduction in the direction of welding is lower than the speed of the heat source movement, also when the heat source reaches to the recorded cross-section, the temperature quickly rose and peaked to 1550°C. This indicates that the welding parameters were correctly chosen so as to create a melt and eliminate defects such as lack of fusion or the formation of cracks.
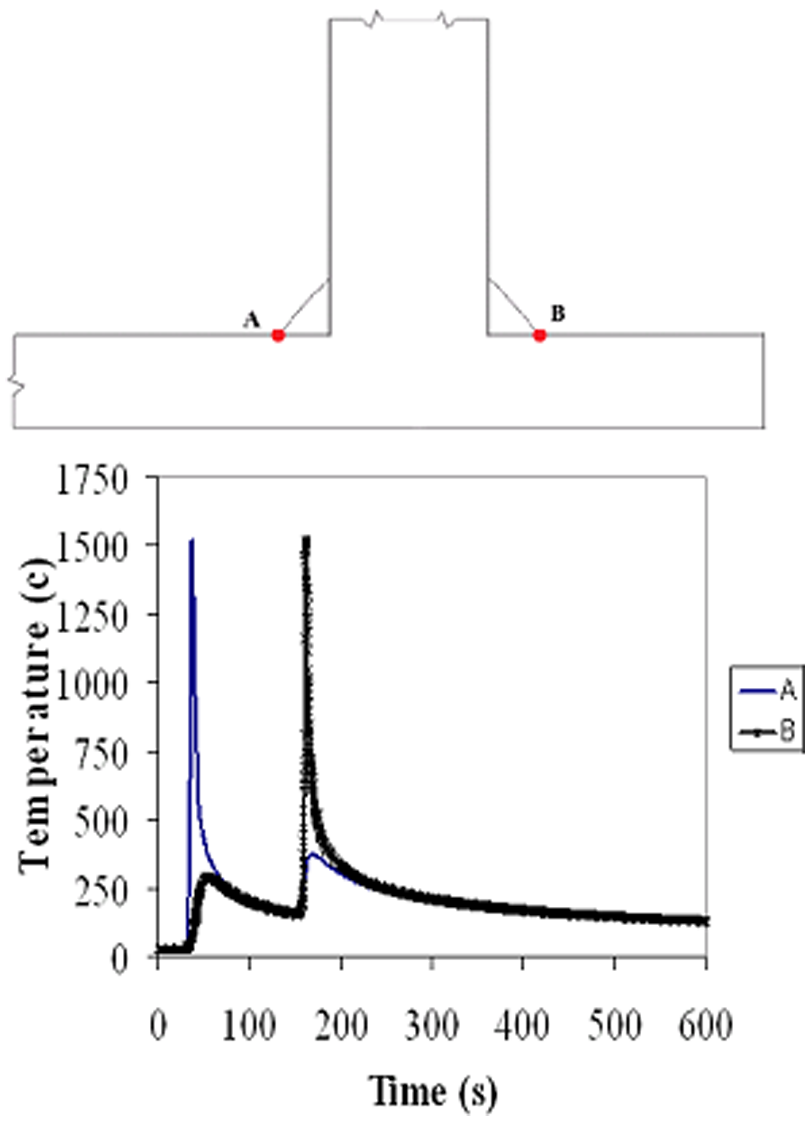
Temperature–time history at weld toe points.
Mechanical results
The effect of mechanical constraint on deflection for Case A of restrictions has been presented in Figure 10. The deflection in y direction has been compared for three paths, which they are described in Figure 3. The FE simulation results are consistent with the experiments particularly for path 1. Considering the results obtained for path 3, it indicates that the shorter side of flange plate exhibits greater deformation; this may be due to high gradient of temperature and shorter length. The y displacement of path 1 is greater than that of path 2 due to the addition of linear deformation to the angular distortion.
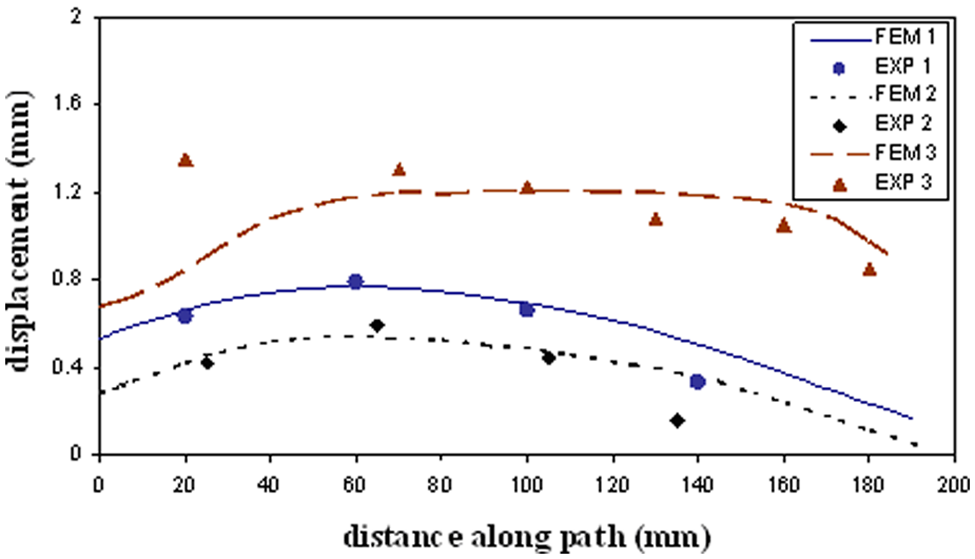
Comparison of deflection in y direction after weld along the three selected paths in flange plate.
From this 3D FEM analysis, the pattern of deformation along transverse paths can also be obtained (see Figure 11). It has been shown that the angular distortion causes greater deformation at the points more distant from the weld line. Considering the deformations obtained for path 4 in comparison to paths 5 and 6, it shows closer point to the start point of weld has less deformation. However, for paths 5 and 6, the heat transfer in weld zone is obtained a steady state and is fewer dependants to the start point of the weld.
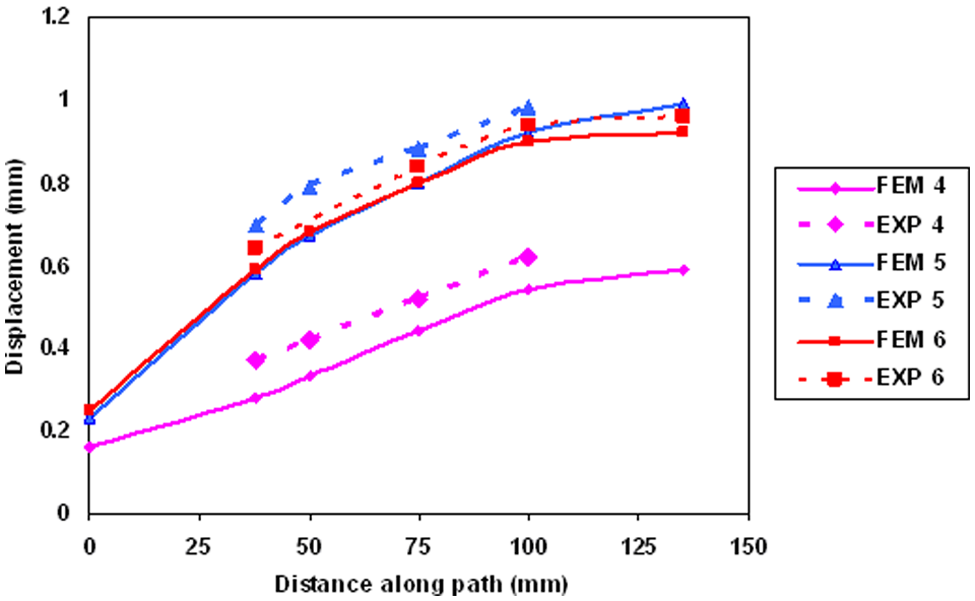
Deflection of flange plate in y coordinate and along transverse directions (paths 4, 5, and 6).
The distribution of transverse (σ xx ) and longitudinal (σ zz ) residual stresses obtained by FE simulation in the flange plate for the Case A is shown in Figure 12. It demonstrates that for a tensile residual stress, a maximum value of ∼200 Mpa occurs near the end of weld line; this is reasonable when compared with a value of ∼150 Mpa that is measured by Barsoum and Lundbäck 6 in a T-fillet weld by a thicker web plate. The stress measurement result for transverse residual stress along the weld line by Barsoum and Lundbäck, 6 when compared with the 3D FEM analysis, demonstrates principally a similar trend.
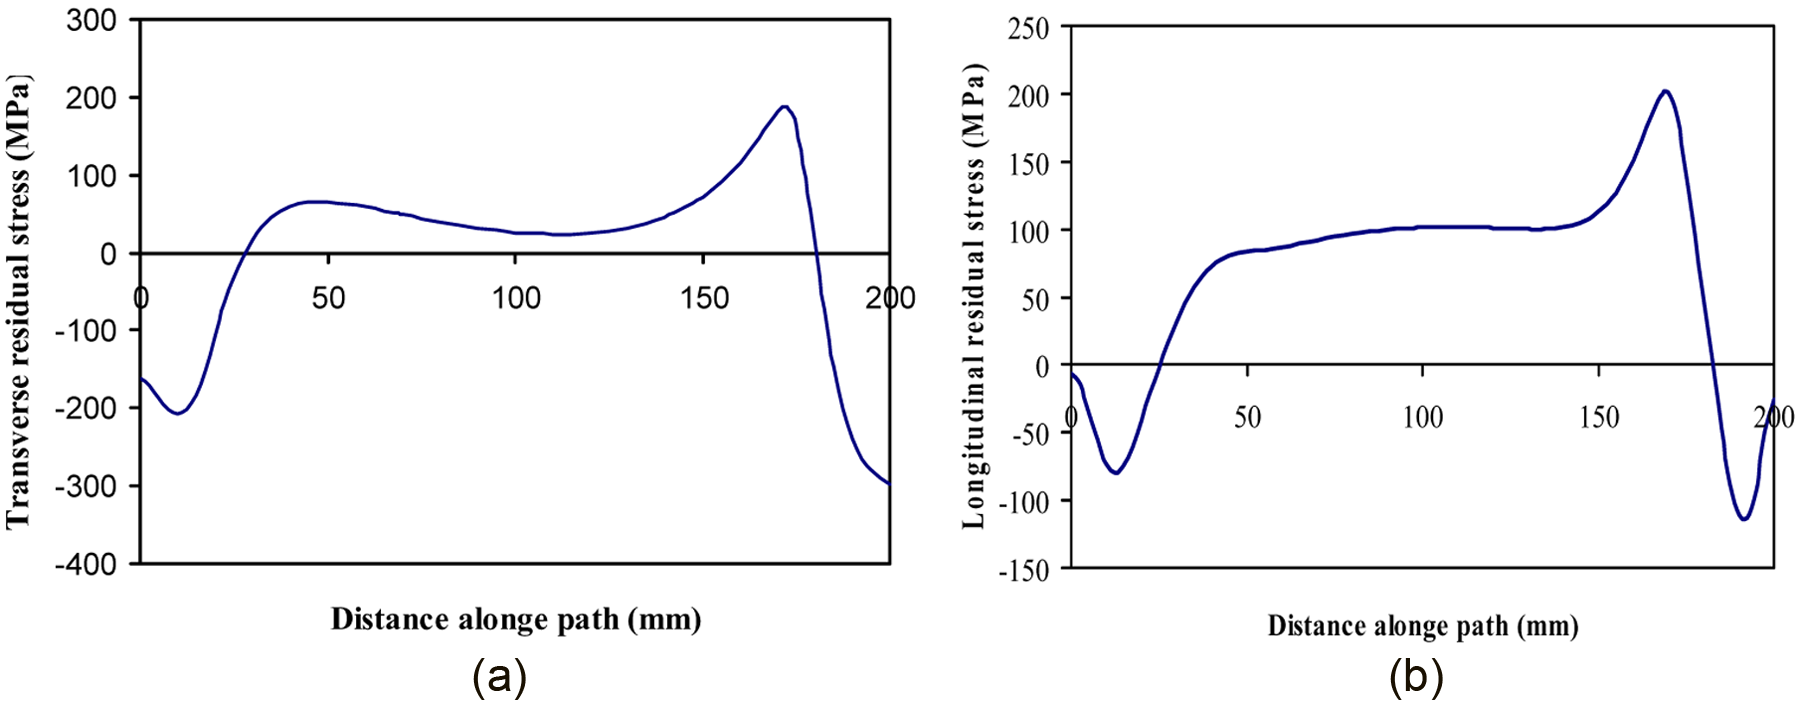
Distribution of (a) transverse (σ xx ) and (b) longitudinal (σ zz ) residual stresses obtained by the finite element analysis for a path parallel and in a distance of 5 mm far from the weld line.
The FEM analysis as an appropriate and reasonable tool is applied in order to investigate the effect of mechanical constraints on residual stress and distortion. The transverse and longitudinal residual stress distribution for four types of mechanical constraints has been compared (see Figure 13). The path for the calculation of residual stress was selected parallel to the weld line at a distance of 5 mm. The patterns for residual stresses show a rise in maximum residual longitudinal stress up to ∼280 Mpa. The transverse residual stresses for Case D are greater than that of Case A. This may be attributed to the higher level of restrictions and prevention of angular deformation of the web and flange plates.
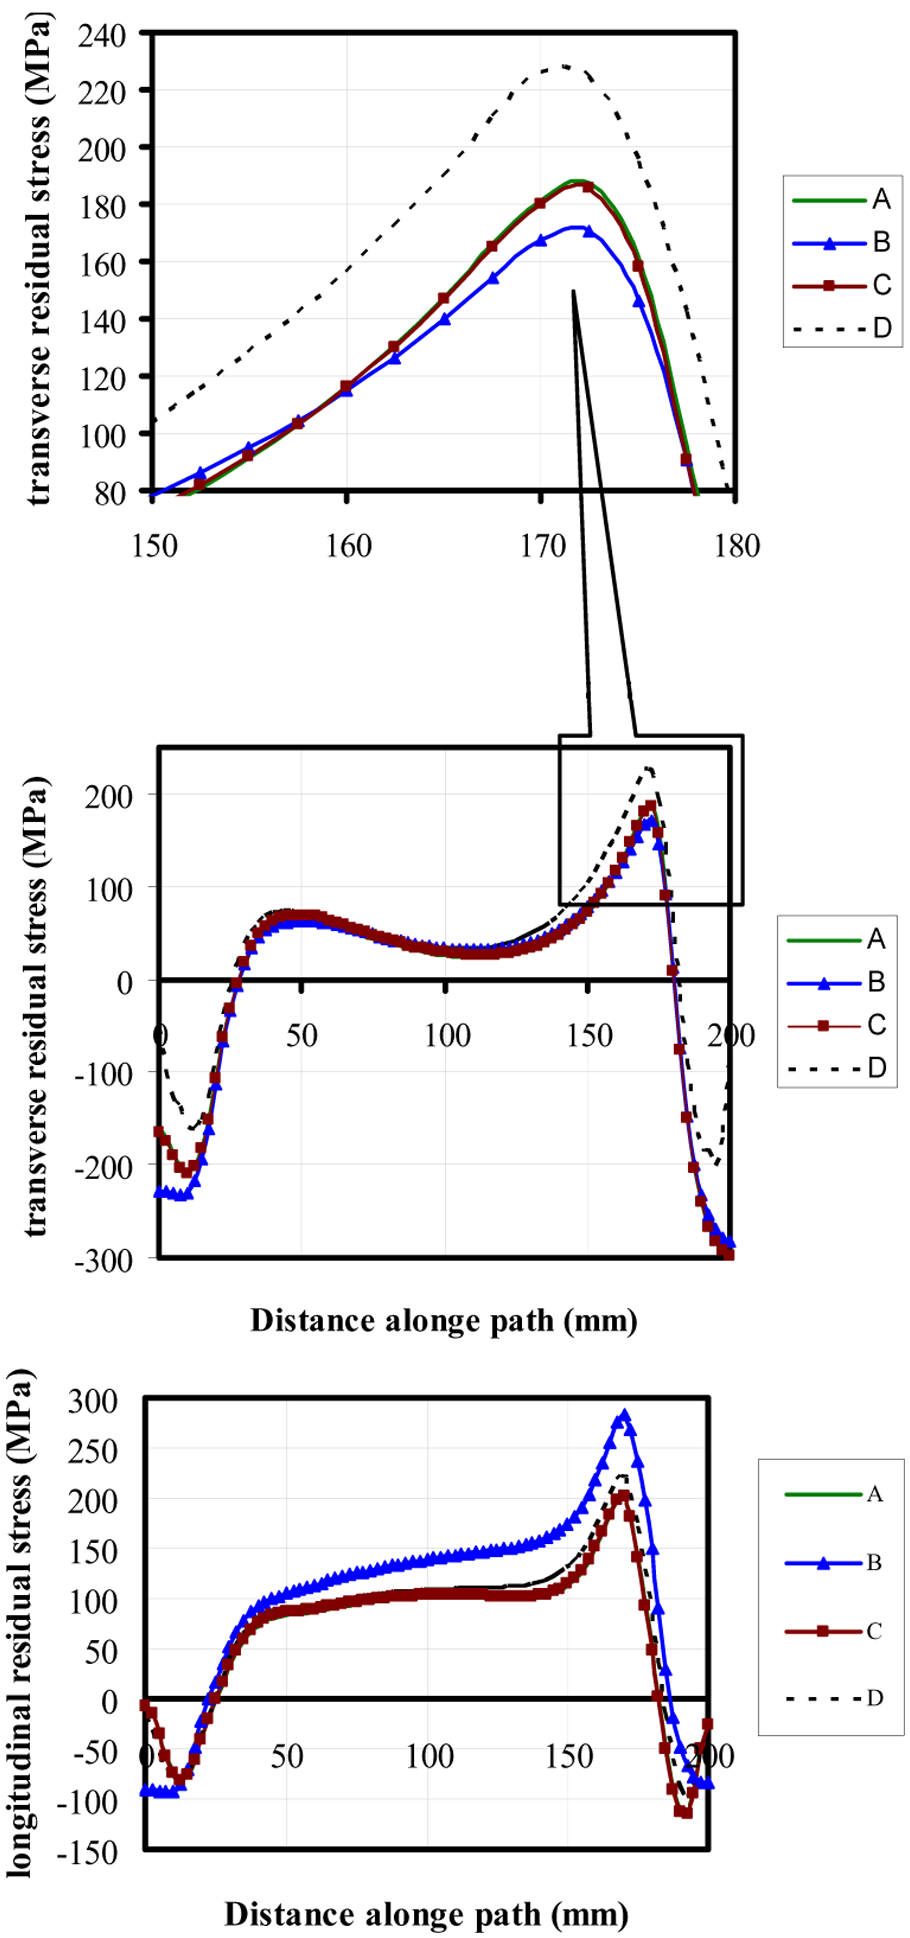
Pattern of residual stresses for four types of constraint.
In Figure 14, the displacement of flange plate in y direction due to the weld along a transverse path (no. 6) for the effect of mechanical constraint has been plotted. The greatest deformation occurs for the Case C constraint that is probably caused by the restriction in the y direction. Part of the deformation may be attributable to an angular component, as was shown for Case A (∼0.9 mm). Figure 14 also shows that the greatest deformation of the flange plate in the y direction was 3 mm. The lowest level of deformation was seen for Case D, whose structural analysis included the strongest mechanical constraints to minimize the deformation.
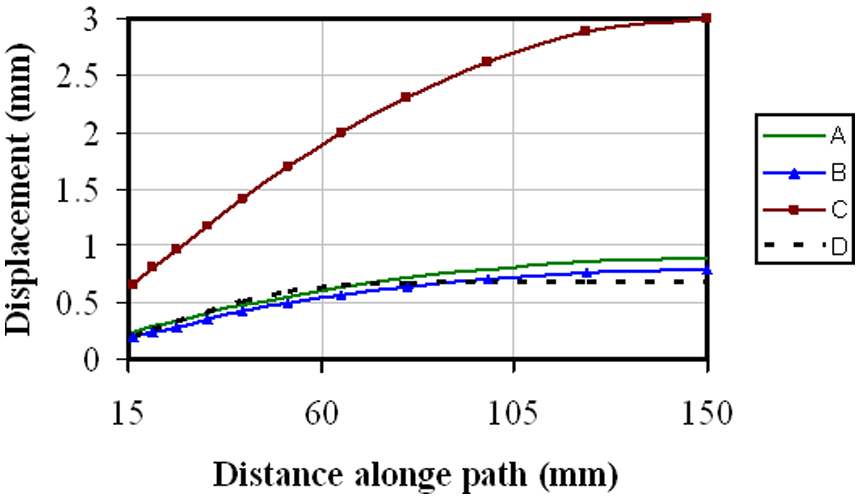
Displacement of the flange plate in the y direction for four types of mechanical constraint.
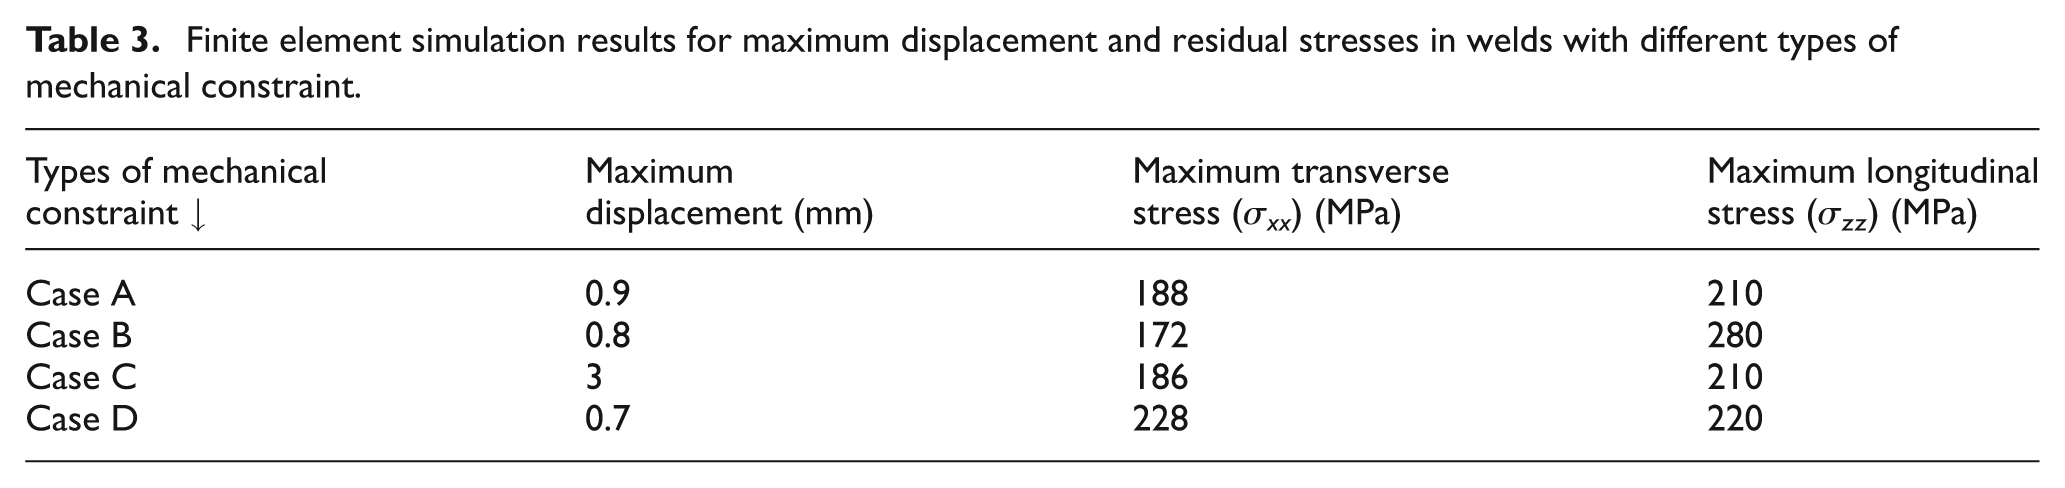
The results for the maximum displacement, transverse, and longitudinal residual stresses for four types of mechanical constraint are summarized in Table 3. This shows that the lowest level of overall deformation and residual stresses occurs in Case A. For Case B, the maximum residual stress increases to σ zz = 280 Mpa; for Case C that has less constraint a 3-mm displacement occurs, and a decrease in maximum residual stress to σ zz = 210 Mpa is observed. These results indicate that less constraint increases the deformation but decreases the maximum stress.
Finite element simulation results for maximum displacement and residual stresses in welds with different types of mechanical constraint.
Conclusion
The tack welds made mechanical constraints and, in this study, the FEM analysis was introduced as a reasonable tool to predict the residual stress and deflection in plates due to the change in sequence of tack welds. A 3D model has been developed to evaluate the effects of different types of mechanical constraint on the deformation and residual stresses induced in T-fillet welding of low carbon steel structures. The proposed model is based on consideration of a combination of surface and volumetric heat sources. The uncoupled thermal and structural analyses have been developed and shown to have a close correlation with the experimental results. The typical constraints preventing the extension of web and flange plates have been evaluated and the following conclusions can be drawn:
The model predictions of temperature gradients and distortion in T-fillet welds were in agreement with practical measurements.
Increasing the mechanical constraints decreases the deformation but increases residual stresses.
Maximum residual stresses increase with an increase in the degree of constraint.
Tensile residual stresses have maximum values close to the end of weld line.
Footnotes
Funding
This research received no specific grant from any funding agency in the public, commercial, or not-for-profit sectors.