
Abstract
The friction hot surfaces generated by metal under low-speed friction is the main potential ignition source for explosive atmosphere, while the friction flash temperature is often much higher than the bulk temperature under the same conditions. Then the first to reach the ignition temperature of the combustible gas is the bulk temperature of the hot surface or the flash temperature of the contact of the asperities, which is worth studying. In view of this, by establishing a friction model, this paper conducts an in-depth study on the flash temperature of the asperities contact between the of TC4 titanium alloy and Q235 steel at the friction conditions of low speed and low load. According to the Hertz contact theory, the contact process of a single pair of asperities and the calculation method of the maximum flash temperature are analyzed, and the maximum flash temperature value is calculated using two assumptions. Combined with regression analysis, the mathematical model of the flash temperature with load and relative velocity is obtained. Under the same conditions, the maximum bulk temperature and flash temperature are calculated, so as to study the real effective ignition source of the gas at the friction conditions of low speed and low load.
Keywords
Introduction
The frictional impact hot surfaces and sparks of light alloy materials are the main potential ignition source for explosive atmosphere. The main factors that make frictional impact sparks an effective ignition source of explosive gas are the properties of the material and the relative velocity of frictional impact.1–4 Generally, when the relative speed of friction impact is below 1 m/s, sparks are basically not generated, but the frictional hot surface can still detonate combustible gas even under the friction condition of relative speed below 1 m/s.5,6 Meyer 5 used the rotary friction experiment to study the ignition of various combustible gases by the friction hot surface of stainless steel, and found that the maximum temperature of the friction hot surface is determined by the friction-related power density, and proved that the friction hot surface can still detonate combustible gas even if the relative speed of friction is less than 1 m/s. However, at low load, friction contact is not a single contact, but multiple contacts occurring at several discrete, small, and protruding rough peaks. The interaction of rough peaks will lead to a large number of high and transient flash temperatures, while the friction flash temperature is often much higher than the volume temperature. Therefore, at low speed and low load, it is not clear whether the volume temperature of the frictional hot surface or the flash temperature of the contact of the micro-convex is the first to reach the ignition temperature of combustible gas.
At present, the methods to obtain the friction flash temperature of micro-convex body are mostly calculation and numerical simulation. It is difficult to obtain the contact flash temperature of micro-convex body directly by experiment. Researchers usually establish a variety of contact models base on the mixed elastoplastic theory and fractal theory on rough surface which are used to calculate the thermodynamic distribution of contact surface and flash temperature under different working conditions. 7 And the thermodynamic distribution of rough surface and the flash temperature measured by finite element numerical simulation are in agreement with the experimental results.8–10 Following the theoretical study of Blok and Jaeger, for the study of frictional heat of micro-convex bodies, Archard 11 developed a simpler and widely used analysis method. The frictional contact model is a single asperity sliding on a plane. The single asperity can be considered to be affected by a fixed heat source, while the plane is affected by a moving heat source. At a lower sliding speed, the temperature distribution of the moving heat source is similar to that of the fixed heat source, but at a higher speed, the temperature distribution of the moving heat source is different from that of the fixed heat source. Since the moving surface does not have enough time to establish the temperature distribution of the fixed heat source. Archard used Peclet number L to characterize the temperature rise of the mobile heat source. When L < 0.1, the temperature of the mobile heat source can be calculated according to the calculation equation of the fixed heat source. With the continuous increase of L, the surface temperature gradually decreases, when L > 10, the calculation method of the fixed heat source was no longer applicable, so he proposed a simple program to deduce the intermediate value based on the heat distribution between two solids, deduced the simplified equation for calculating the maximum temperature rise,12–14 and calculated the average flash temperature of the convex sliding in the plane. With the continuous development of computer technology, some researchers used finite element technology and regression analysis to predict the flash point temperature. 15 Kennedy 16 used finite element method to predict the flash point temperature in the sliding system, which was consistent with the experimental results.
Smith and Arnell12,13 proposed the finite element analysis solution of the three-dimensional equation of transient heat flow dependent on the hemispherical rough surface, and obtained that the main factors affecting the flash temperature were the thermal conductivity, friction coefficient, hardness, sliding speed, wear radius, and wear degree of the material. However, the change of thermal performance, friction coefficient, and actual contact area all affect the calculation of flash temperature. In order to facilitate the calculation, different physical, dynamic, and geometric assumptions are used in related studies, so the flash temperature values calculated by different theoretical models are very different. 17 Because the theoretical calculation of friction flash temperature is difficult to obtain accurately due to the complex physicochemical environment of the friction interface, it is very important to establish the friction model accurately and determine the main related factors according to the actual working conditions. In view of the research on the single-pair asperity contact between TC4 titanium alloy and Q235 steel in this paper, the contact model is simplified into a spherical model to calculate the thermal conductivity between a single pair of asperities. In my previous works, the mathematical model of the extreme value of volume temperature in macroscopic friction was studied, but the friction flash temperature under low load was much higher than the extreme value of volume temperature, so the experimental method will not be repeated. Using the same experiment measured the relevant parameters, combining the theory of elastic mechanics and Hertz contact theory analysis and calculation of contact temperature, so as to analyze the effective ignition source at low speed and low load. Combined with regression analysis, the flash temperature calculation model is derived, which can reasonably predict the safe use conditions of titanium alloys in the gas environment.
Measurement of friction coefficient and volume temperature
The friction experiment was carried out on the block-on-ring type friction and wear experimental machine M-2000, and the friction model is shown in Figure 1. The steel ring was rotated by the eccentric wheel and the TC4 block was fixed, the two samples were impact by load on the top of the block. The upper specimen was a 10 mm × 20 mm × 10 mm rectangular prism, the lower one was circular ring with inner diameter of 20 mm, outer diameter of 40 mm, and thickness of 10 mm. The surfaces of the two specimens were burnished, the surface roughness was Ra200. The material of upper specimen was Ti6Al4V and the lower one was Q235A, the material parameters are shown in Table 1. The center of the steel ring was the origin of the coordinate system, the circle rotated around the Z axis, and the longitudinal direction was the Y axis. The maximum temperature of the rubbing surface was measured using an infrared camera. The equipment location and shooting angle are shown in Figure 2, and the photo of the field experiment is shown in Figure 3. To improve understanding of the friction mechanism, a sample showing the original burnished surface and wear traces is shown Figure 4.
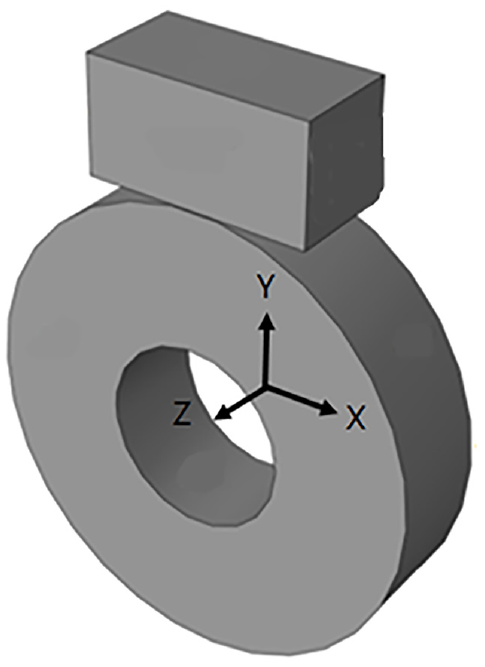
Titanium alloy block and steel ring rotating friction model.


Schematic diagram of experimental apparatus.

The viewing angle of the infrared camera.

The surface morphology of the sample after wear.
The relative speed of friction is 0.69 m/s, and the load is 200, 300, 400, 500, 600, 700, and 800 N. Seven groups of experimental conditions were composed of different loads. The friction between TC4 block and Q235A ring was dry friction. As the friction time increased, the wear on the surface of the block was more serious. The increase of the wear would affect the pressure and influence of friction coefficient simultaneously. Experimental results showed that the friction coefficients increased with the friction time. Then to determine the friction coefficient, it was necessary to determine the friction time first. As the housing material does not belong to the long-term frictional element in mining, in order to obtain the consistent friction condition between the experiment and the simulation, the frictional time would be short and the wear may be in a negligible range. So record the friction time when the maximum depth of wear was less than 0.1 mm under different friction conditions. It was friction time and the average friction coefficients in this time were used to simulate. 8 The average friction coefficient and the maximum temperature of friction contact surface measured by three repetitions of each group were listed in Table 2.
Friction coefficient and maximum temperature of hot surfaces under different loads.

Calculation of friction flash temperature
For the calculation of the contact problem of a single pair of micro-convex bodies, the contact model is usually simplified into a cylinder (disk), a sphere, and a cone. In this paper, the spherical model which is widely used is used to calculate the contact flash temperature of contact. The contact deformation of a single asperity under low load is usually in the initial stage of elastic deformation or plastic deformation. The following two calculation methods for the maximum flash temperature of friction are studied. One is a calculation model based on the elastic contact theory of two micro-convex bodies, and the other is a calculation model based on the assumption that the contact pressure of two micro-convex bodies is equal to the yield strength of softer materials.
Calculation of the maximum flash temperature in elastic contact
The two asperities are in contact (Figure 5), the asperities 1 move to the right at a speed v, and the asperities 2 are stationary. Under the action of the nominal contact pressure P, the resulting normal deformation δ, the contact area is A. The elastic deformation causes the radius of the contact surface to be α instead of e of the theoretical rigid contact, as 1 moves to the right, the part of interaction decreases, δ decreases, and α also decreases.
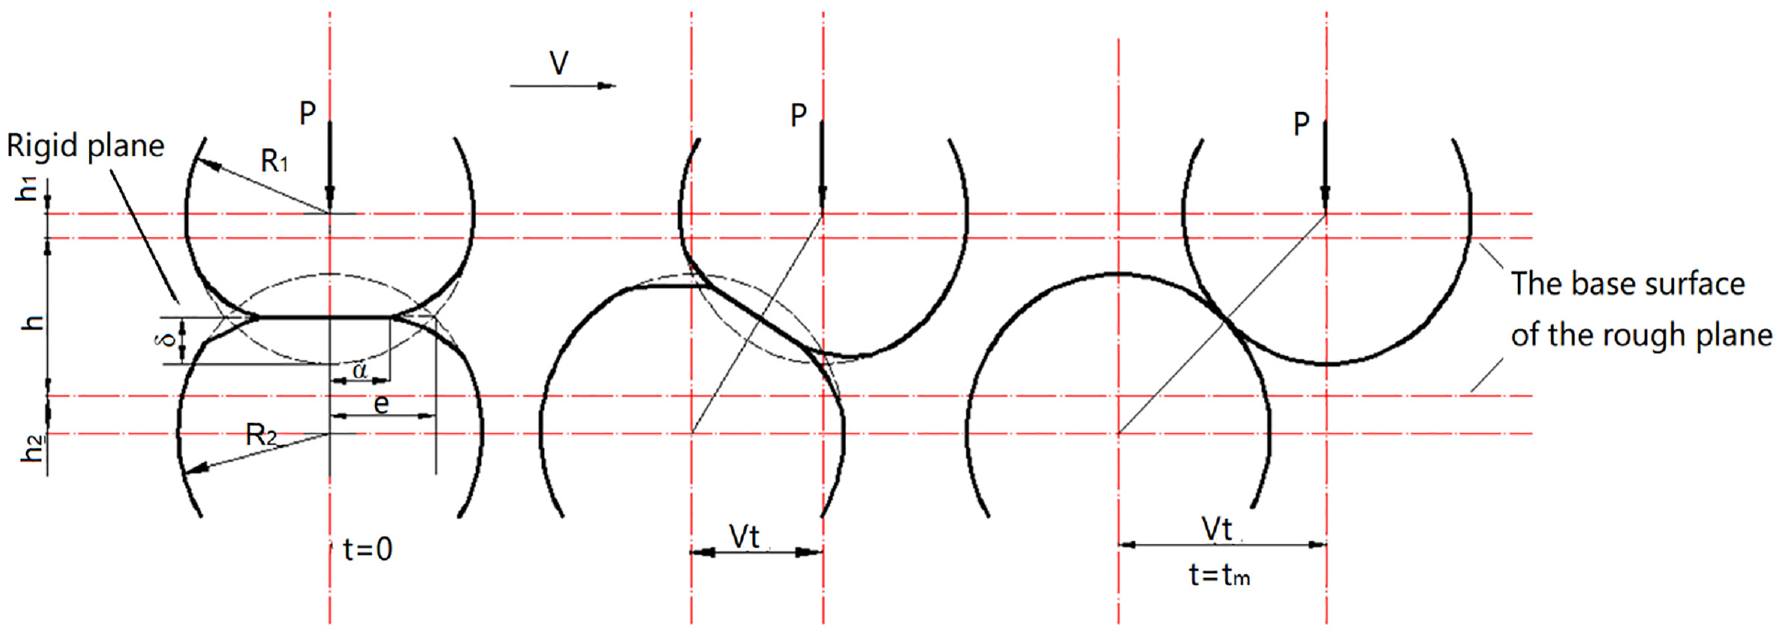
Schematic diagram of the single asperity contact.
According to the analysis of elasticity and Hertz contact theory18–20:

where R* is the composite radius of the summit contact of the two asperities, E* is the composite elastic modulus of the material on the two contact surfaces, E1, E2, and υ1 and υ2 are the elastic modulus and Poisson’s ratio of the two contact bodies, respectively, and d is the depth of the two asperities injected into each other.
One asperity passes through another asperity, and the contact surface moves continuously during the contact process, and the contact area first increases and then decreases (Figure 6).
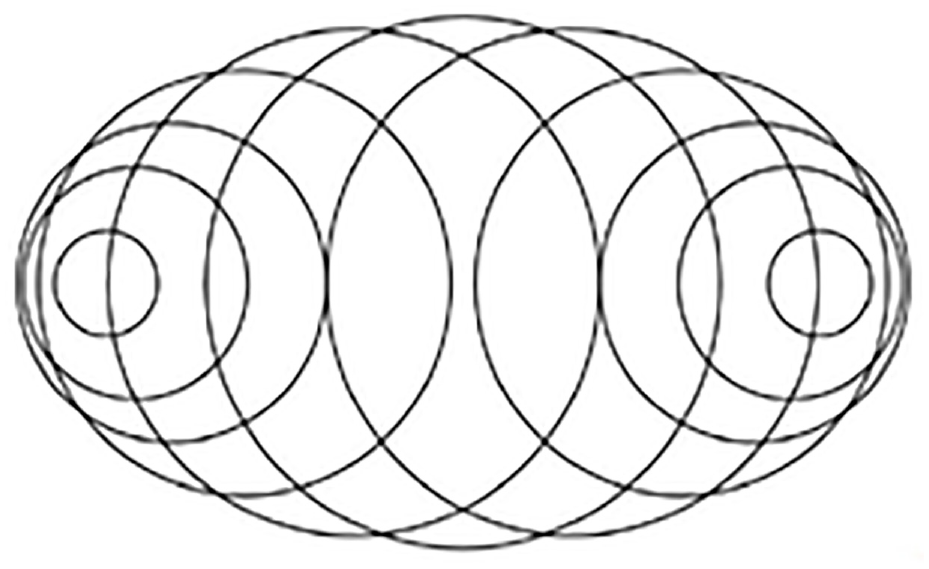
Instantaneous contact area of the single asperity. 18
The center point of the contact surface is always in a heated state, then the highest temperature will appear at this center point position, that is, at r = 0. When in elastic contact, the distribution p (r) of the contact pressure given by Hertz contact theory is:

Then, when r = 0, the contact pressure is the largest, however, the contact pressure will change with the depth of the two asperities injected into each other. The maximum value is taken at the initial moment d. Liu 18 used the translation of the coordinate system of the interference equation to obtain:


Then the contact pressure at the center of the TC4 asperity is:
The frictional heat flux is:

For the heat conduction problem of the heat flux density f (t) per unit time on the contact surface, Carslaw gives the temperature at the distance x from the contact surface at time t:

where K is the thermal diffusivity and k is the thermal conductivity.
At the center position of the contact surface, x = 0, of a single asperity the corresponding exponential term in the above formula is equal to 1, where the transient temperature from the start of contact to t at any time is:

Combining equations (7), (12), and (14), the flash temperature of the friction center of the TC4 asperity is obtained as:
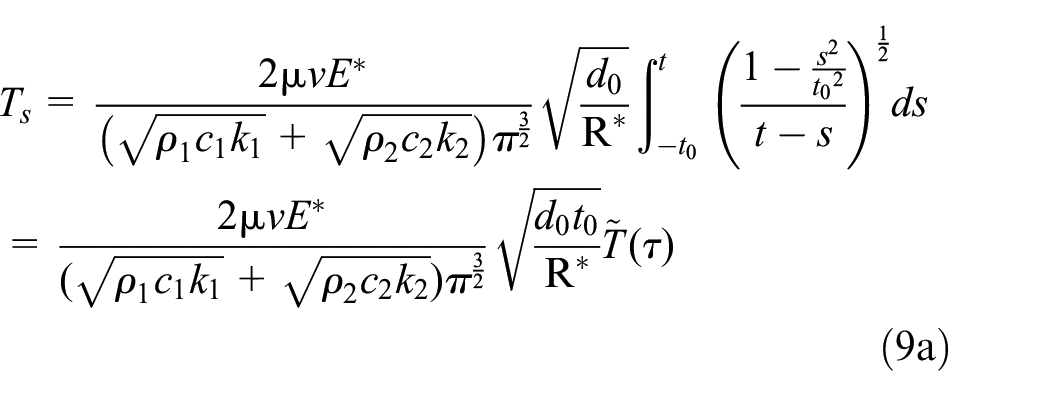
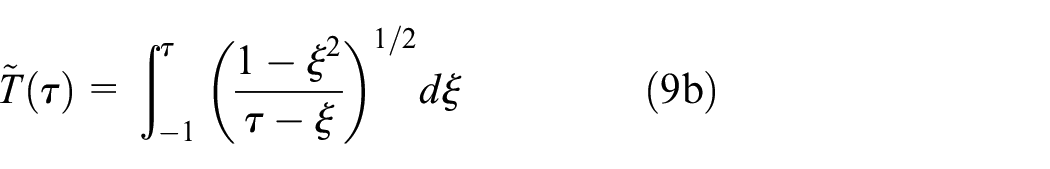
Equation (9b) is the normalized temperature, τ is the normalized time, when τ = −1, the two asperities begin to contact, when τ = 1, the two asperities separate, when τ = 0.65,
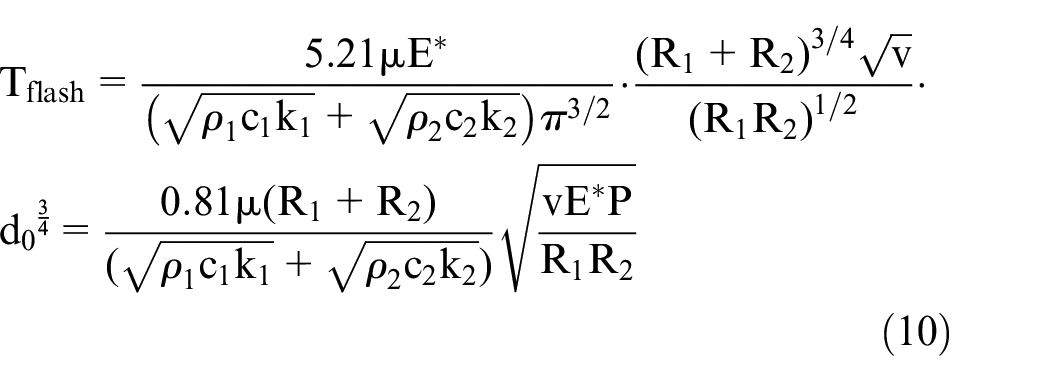
Therefore, the maximum flash temperature of single-pair asperity friction between TC4 titanium alloy and Q235A steel is:
Calculation of the maximum flash temperature in plastic contact
When two asperities are in contact, when a large elastic deformation occurs or is in the early stage of plastic deformation, the contact pressure of the asperities is equal to or very close to the yield pressure of the soft contact of the material, then the actual contact area is approximately equal to the load divided by the hardness of the soft material. Then the study of the sliding friction flash point temperature is based on a model similar to the Archard model, the sliding contact surface is always kept constant, and the heat flux density is assumed to be uniformly distributed. Simth and Arnell obtained that when one asperity passes through another asperity, the frictional heat flux density of the contact surface is:

where μ is the coefficient of friction, H is the hardness of the material (in Pa), and v is the sliding velocity. The premise of this is that the asperity contact pressure is assumed to be equal to or very close to the yield pressure of the soft contact of the material. When the two micro-protrusions are in initial contact, the hardness of the same material is the same, and the contact pressure can be equal to this hardness H, and the hardness value of the softer material can be used for different materials. For frictional contact between different materials, the flash temperature rise can be expressed as:

The heat flow equation of the two asperities contacting the control temperature distribution with time is:

When t = 0, the two asperities just touch, the asperity 1 passes through the asperity 2 at a speed V, the distance is equal to four times the radius of the contact surface, and the entire contact surface is a flat area. Then the flash temperature rise can be expressed as:

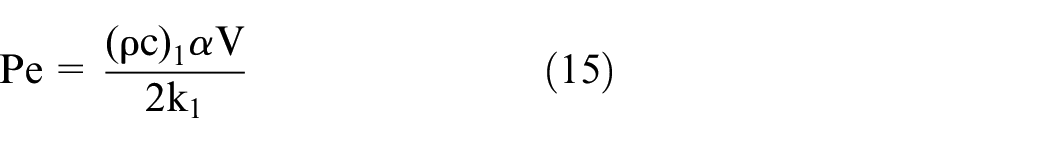
where Pe is Planck’s constant, and its expression here is:
Define

According to the maximum quasi-steady-state contact temperature rise equation of rough sliding on the plane deduced by Tian and Kennedy12,21, Smith obtained the maximum flash temperature rise equation of asperity contact as:

Calculation of friction contact flash temperature between TC4 titanium alloy and Q235A steel
The above two methods are used to calculate the maximum flash temperature of frictional contact between TC4 titanium alloy and Q235A steel. The surface processing accuracy of TC4 titanium alloy sample and Q235A steel sample is the same, both of which are surface polished, and the peak radius of the asperity is the same about 200 μm.
The maximum flash temperature value of frictional contact between the two materials increases with the increase of load and relative sliding speed (Figure 7). When the load is 800 N and the relative sliding speed is 0.69 m/s, the maximum flash temperature value is the highest, and the calculated value of elastic contact is 254°C. The minimum gas ignition temperature (650°C) is not reached; the calculated flash temperature is much higher than the maximum temperature value (bulk temperature) of the hot surface under the same friction conditions. When the load is between 200 and 400 N, the error of the maximum flash temperature value obtained by the two calculation methods is very small, and the error value increases with the increase of the load. This is because when the load is high, the difference between the calculated depths of the elastic contact and the plastic contact of the two asperities increases, and the difference between the contact load values increases. With the elastic contact theory, the mutual penetration depth d of the two asperities is always proportional to the load P2/3, so that the results calculated by the elastic contact theory are much higher than those calculated by the plastic contact theory. When the convex body is plastically deformed, the plastic contact theory will be closer to the true value. In order to ensure a certain safety factor, the average value of the two calculation methods is used to predict the load when the flash temperature value reaches the minimum gas ignition temperature.

Comparison for calculation results of maximum flash temperature: (a) sliding speed is 0.44 m/s and (b) sliding speed is 0.69 m/s.
Discussion of bulk temperature and flash temperature
First, use MATLAB software to perform regression analysis and significance test, and obtain the fitting curve of friction coefficient and load when the rotational speed is 0.69 m/s (Figure 5).
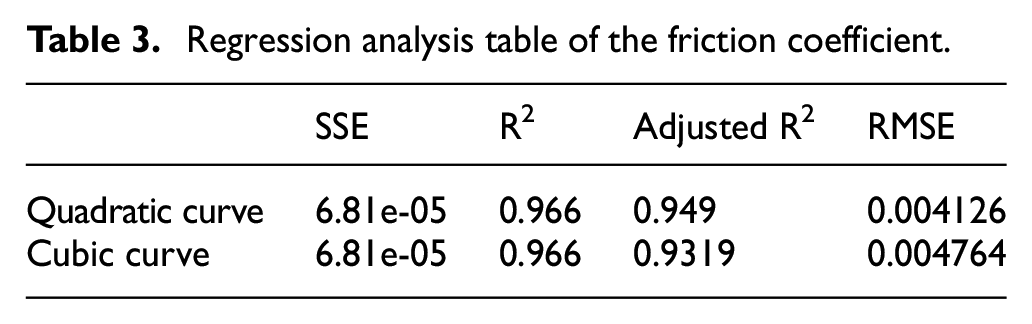
For the change of friction coefficient with load, among the feasible fitting curves, the quadratic curve and the cubic curve fit better, and the cubic curve completely covers the quadratic curve, and the quadratic curve is basically invisible, and it is difficult to see the difference (Figure 8). However, it can be seen from the adjusted value and the mean square error value that the quadratic curve has a good fit (Table 3). Therefore, at a velocity of 0.69 m/s, the linear model for the coefficient of friction and load is:


Fitted curves of friction coefficient.
Regression analysis table of the friction coefficient.
Using regression analysis, the variation of frictional hot surface temperature with friction coefficient and contact pressure was fitted. Comparing different fitting surfaces, it is found that the fitting effect of the plane is the best (Figure 9). Scatter points are evenly distributed above and below the plane, with the lowest adjustment and mean squared error values.

Temperature fitting surface.
The fitting formula of the frictional hot surface temperature with the friction coefficient and contact pressure is a linear equation (19):

According to the actual conditions, the minimum ignition point of the methane-air mixture is 650°C, and the magnitude of the normal load when the maximum temperature of the friction hot surface reaches the minimum ignition temperature of methane-air mixture can be predicted. According to equations (18) and (19), it can be calculated that when the friction relative speed is 0.69 m/s, the hot surface bulk temperature reaches the minimum gas ignition temperature, and the load needs to exceed 2377.51 N. 8
Regression analysis was used to study the variation of the average value of the maximum flash temperature value with the load by the two calculation methods, and the fitting curve was obtained as shown in Figure 10. Comparing the fitting degree of straight line, quadratic curve, cubic curve, and data, combined with the adjustment value and mean square error value (Table 4), the fitting degree of cubic curve is relatively high, and the fitting equation is equation (20).

According to equation (20), it is calculated that when the maximum flash temperature reaches the minimum ignition temperature of gas at 650°C, the load is about 1705.50 N. At the same rotation speed, the load when the maximum bulk temperature of the hot surface reaches the minimum gas ignition temperature is 2377.51 N, then the critical value of the load to ensure that the friction temperature is lower than the minimum gas ignition temperature is approximately 1700 N. Therefore, the friction conditions at the load below 1700 N and the relative rotational speed within 0.69 m/s can ensure the mining safety of the TC4 titanium alloy friction hot surface. However, if the load is higher than 1700 N, whether the friction flash temperature can ignite the gas still needs to comprehensively consider more factors, such as whether the friction contact is multi-contact, the friction life of the asperity, and the flash temperature value is higher than the gas ignition temperature, but the duration is short, the heat transfer cannot compensate for the heat loss, and when the combustion wave cannot be propagated continuously, the friction hot surface can also ensure the safety of mining. If the load exceeds 2377.51 N, the friction hot surface temperature will exceed the minimum gas ignition temperature, and the risk of use will be very high.

Fitted curves of maximum flash temperature.
Regression analysis table of the flash temperature.

To sum up, when the relative rotational speed is low and no friction spark is generated, the potential ignition sources of gas are only friction flash and friction hot surface. At low load, the friction flash temperature is always higher than the friction hot surface temperature. Controlling the highest flash temperature of friction can ensure the safe use of materials in explosive atmosphere, but whether the friction flash temperature can become the key to igniting the explosive gas is the duration of the friction flash temperature. At higher loads, the only if the potential ignition source is the friction hot surface, it is only necessary to control the maximum temperature of the friction hot surface to be lower than the minimum ignition temperature of the combustible gas.
Conclusion
In this paper, the rotating friction model is used to study whether the frictional hot surface of TC4 titanium alloy exceeds the minimum gas ignition temperature at low speed and low load, and the maximum friction interface and friction flash temperature are respectively studied in detail. The following conclusions are obtained:
The mathematical model of the total heat generated by the contact is deduced by analyzing the contact process of a single pair of asperities, and the main factors affecting the contact heat of a single pair of asperities are: the property parameters, friction coefficient, relative velocity, surface roughness of the material, and initial ambient temperature.
Study the calculation of the maximum flash temperature of the contact of the single pair of asperities between the TC4 titanium alloy and Q235A, and use the two contact theories to deduce the mathematical model to calculate the maximum flash temperature value. Since the two calculation methods are based on different assumptions, the calculation results are slightly deviated, and the deviation increases with the increase of load, the maximum flash temperature always increases with the increase of relative speed and load, and controlling the critical load and relative speed can effectively control the effectiveness of potential ignition sources. In the same conditions, the friction flash temperature is higher than the maximum temperature of the friction hot surface;
Using regression analysis to study the variation law of the maximum flash temperature with the load, it is obtained that the adjacent load when the maximum flash temperature reaches the minimum gas ignition temperature is 1705.50 N. When the relative rotational speed is low and no friction spark occurs, the potential ignition source of gas is only friction flash temperature and friction hot surface. At low load, controlling the maximum flash temperature of friction can ensure the safety of the material in explosive atmosphere. At higher load, the only potential ignition source is friction hot surface, it is only necessary to control the maximum temperature of the friction hot surface to be lower than the minimum ignition temperature of the combustible gas.
Future work
The research in this paper not only provides a new idea for the mechanism of friction spark induction of light metal materials, but also makes a deep and detailed exploration of the friction flash temperature of titanium alloy, and provides some reference for the application of titanium alloy in explosive gas environment. Certain progress has been made in the mechanism of collision spark induction of TC4 titanium alloy materials, but there are still shortcomings and defects in the research of this paper. The future related work can be continued as follows:
Increase the adjustment range of the load and relative velocity of friction and impact experiments, conduct more experimental verification of the predicted results of friction temperature field and spark, and combine with the explosion experiment of combustible gas to verify the accuracy of the set critical conditions;
In-depth study of the friction contacts between TC4 and Q235A micro-convex body to determine the life of micro-convex body under different conditions, so as to more accurately set the critical value of friction conditions; and
Study the method of modifying titanium alloy material to improve its spark safety as a mineral equipment material.
Footnotes
Handling Editor: Chenhui Liang
Declaration of conflicting interests
The author(s) declared no potential conflicts of interest with respect to the research, authorship, and/or publication of this article.
Funding
The author(s) disclosed receipt of the following financial support for the research, authorship, and/or publication of this article: The research described in this paper was financially supported by Xuzhou Institute of Industry and Technology of high-level talents scientific research initiation special project (Grant No. XGY2021A044).