
Abstract
In order to manufacture non-ferromagnetic heterogeneous material by Selective Laser Melting (SLM), it is necessary to solve the separation problem of non-ferromagnetic mixed powders after SLM forming. This research presents how to resolve this problem using TiNi/Ta mixed powders by ultrasonic vibration screening method and the analysis of SLM manufacturing experiment for non-ferromagnetic heterogeneous material. The purity of TiNi and Ta powders after separation could reach 99.7087%wt% and 98.8501wt% respectively, which both reached a relatively high purity. A TiNi alloy sample with Ta coating and TiNi/Ta gradient transition was manufactured successfully by SLM. The material interface of the sample achieves metallurgical bonding, and the color of the sample profile shows a gradient transition. The EDS analysis shows that the material composition changes from Ta ->Ta/TiNi gradient ->TiNi from surface to inside of the sample. The Ta coating contains over 92.5wt% Ta, and the TiNi matrix contains over 98.69wt% TiNi. Along the powder laying direction, it is difficult to clean the small powder near the solid-powder or solid-solid interfaces made of two different materials, which causes micro polluted areas near the interfaces. This study also provides a new method for integrated manufacturing of TiNi alloy part with Ta coating.
Keywords
Introduction
Heterogeneous material parts that are made of different materials can greatly improve the mechanical properties, electrical properties, magnetic properties, and other properties of a part made of single material. They play an important role in fields such as aerospace, medicine, and automotive.1–3
Selective Laser Melting (SLM) is a typical metal laser additive manufacturing process for metal parts in Powder Bed Fusion (PBF) technology, which is currently one of the best additive manufacturing processes for forming high-performance metal parts.4–11 However, it is difficult to freely arrange different types of materials as needed during the SLM forming process due to the principle of layer by layer powder laying in PBF technology.12–14
Due to the advantages of SLM process in high-precision forming of parts, many scholars have begun to research the additive manufacturing process of heterogeneous material parts by improving the material supply method on the basis of the original SLM process in recent years.15,16 For example:
Demir and Previtali 17 used the dual funnel powder supply SLM technology to form Fe/Al-12Si heterogeneous material, confirmed the feasibility of SLM technology in forming heterogeneous material parts. This method uses a blade scraper to lay different powders supplied by two funnels on the forming platform for forming. The two funnels can also simultaneously release different powders in proportion. The gradient material composition powder can be provided after mixing through collision. However, it can only produce parts with different material compositions between layers and layers, and cannot achieve free arrangement of heterogeneous material within layers. In addition, the method also faces the problem of a large amount of two excess powders mixed together after molding, which needs to be separated and purified.
Mussatto 18 has developed a dual powder box selective powder dispersion device and successfully applied it to SLM additive manufacturing process for heterogeneous material parts. The working principle of this device is based on the use of a point by point controlled micro airflow to attract powder particles onto a cylindrical sieve, which forms the same powder pattern as the model slice. Then, the powder on the cylindrical sieve is blown off and deposited on the forming platform to achieve powder laying. This method can greatly reduce the powder separation and purification work after additive manufacturing, because it can more accurately achieve laying of powder by point. However, inappropriate parameters may cause the powder to accidentally drop in certain areas, resulting in contamination of the powder layer. In addition, supporting powder inevitably come into contact with part of the non-supporting powder due to the general need to use supporting powder, which results in the need for separation and purification of supporting powder after additive manufacturing before reuse. As the powder laying device needs to move repeatedly on the molding platform to arrange the powder during the molding process, if multiple materials need to be arranged, the volume of the powder laying device needs to be designed to be much larger than the volume of the traditional powder laying scraper used in SLM process, which greatly limits the design of the powder laying device for improving the powder laying speed and expanding to multiple powders.
Wei et al.12,19 developed a SLM equipment that combines powder bed laying, point by point multi material selective powder removal, and point by point dry powder conveying, which also achieved the free arrangement of heterogeneous materials in different layers or different regions within the same layer. This process can achieve various powders arrangements, but the powder sent out point by point by ultrasonic vibration of the nozzle has not been flattened by a scraper. Consequently, the laid powder is difficult to obtain a flat surface, which reduces the accuracy of the molding.
Wu et al. 20 proposed a powder supply, laying, and recycling method and device based on the principle of flexible cleaning of excess powder, which can be used for the SLM additive manufacturing of heterogeneous material parts. The experiment shows that this method effectively solves the problem of material distribution in the same layer during the SLM additive manufacturing of heterogeneous material parts. Although this method has the advantages of simple principle and easy implementation, the method is less efficient in molding because the method requires repeated cleaning by scraper to arrange multiple materials on the same layer.
In the above-mentioned SLM additive manufacturing processes for heterogeneous material, some processes can arrange powders according to part slices with a certain degree of accuracy. However, in the case of adding support during the forming process, due to the need to add filling powder, most SLM processes for heterogeneous material face the problem of mutual contamination of heterogeneous material powders. After the 3D printing of the part is completed, it is necessary to separate and purify the remaining powder. 21
For mixed powders composed of ferromagnetic and non-ferromagnetic powders, the separation and purification of the two heterogeneous materials can be easily achieved by magnetic separation method. Wu et al. 20 showed that the 4340 steel powder was separated and purified from the CuSn10 powder/4340 steel powder mixture by magnetic separation, which contains only 0.0774wt% Cu, while the Fe content in CuSn10 powder is only 0.0532wt%, achieving high separation and purification purity.
However, for non-ferromagnetic heterogeneous material, it is difficult to realize the separation and purification of mixed powders composed of different non-ferromagnetic heterogeneous material powders because the particle size of the powders used in SLM molding process is too small. The experimental effect of the separation and purification of mixed powders after SLM additive manufacturing has not been reported.
TiNi alloy has excellent shape memory effect and super elasticity, and has been widely used in the medical field. For example, parts such as dental orthodontic wires, root implants, and spinal implants made of TiNi alloy can adaptively adjust the orthodontic force over time, which greatly reduces patient pain.22–24 However, recent research results have shown that Ni element are potentially allergenic, teratogenic, and carcinogenic to human body. Although people are committed to developing new Ni-free shape memory titanium alloys, it is difficult to find Ni-free shape memory titanium alloys that achieve the shape memory effect of TiNi and super elastic properties at present.24,25 Therefore, it is of great significance to carry out research on surface modification of TiNi alloys.
Among many metals, Ta (tantalum) is a biophilic metal with excellent biosafety and biocompatible. It has good compatibility with living organisms and the ability to osseointegrate with bone tissue in a bone binding manner. The bone-inducing activity of Ta is higher than that of titanium, cobalt, and chromium.26,27 Available studies have shown that Ta metal has not shown any adverse reactions as a human implant. Ta also has advantages of stable chemical properties and excellent mechanical properties. 27 Therefore, Ta is not only a good biomedical material, but also an excellent surface modification coating material for traditional biomedical materials such as 316L stainless steel and titanium alloy. As a coating of TiNi alloy, Ta can avoid the side effects of Ni elements on the human body and enhance the biocompatibility of implants. 24
The traditional methods for obtaining Ta coating on metal substrate are mainly plasma spraying, 28 chemical vapor deposition, 24 magnetron sputtering, 29 etc. Yin et al. 30 used plasma spraying technology to prepare NiTi shape memory alloy containing Ta coating, and pointed out that Ta coating can effectively improve the corrosion resistance of the base metal, and there is no galvanic corrosion between the coating and the base metal. Cai et al. 31 prepared Ta coatings on metal phases using chemical vapor deposition (CVD), and studied the effect of CVD temperature on the microstructure and mechanical properties of Ta coatings. Hee et al. 29 studied the effect of sputtered Ta coatings on the mechanical and hydrophobic properties of Ti6Al4V, and pointed out that Ta coatings exhibit α/β dual-phase structure, which can improve the surface hardness and hydrophobicity of the substrate. Although the above methods can prepare Ta coatings, these traditional Ta coatings preparation processes have drawbacks such as cumbersome preparation processes, high equipment requirements, and high raw material consumption.32,33 At the same time, the production of these composite parts usually requires the production of a matrix before the production of a coating, which cannot achieve the integrated manufacturing of parts and coatings in one step.
Additive manufacturing technology has natural advantages in forming composite material parts due to the working principle of stepwise materials stacking. Balla et al. 34 prepared Ta coatings on Ti substrate using Laser Engineered Net Shaping (LENS), and showed that Ta coatings have better biocompatibility than titanium. However, the LENS has a low forming accuracy and is difficult to form highly complex structures.
Although there have been some studies on SLM forming Ta and Ta alloy materials, the forming of TiNi shape alloys containing Ta coating using SLM technology has not been reported.
In this study, TiNi and Ta are two types of non-ferromagnetic materials, which are used as forming materials. Firstly, the separation and purification problem of the TiNi and Ta is solved, then combined with the principle of flexible cleaning of excess powder, 20 it is achieved that the free laying of powder with different compositions in the same layer. The gradient material composition is obtained by real-time powder mixing method. Finally, TiNi, Ta, or their mixed powder is selectively melted by selective laser melting. TiNi alloy containing Ta coating is manufactured in an integrated and synchronized manner from material preparation to sample forming. This study also analyzes the forming effect and microstructure of the experimental sample, which provides support for future engineering applications, that is, direct manufacturing TiNi alloy parts with Ta gradient coating for medical applications by SLM method.
Structural composition and working principle of the forming machine
The SLM machine for heterogeneous material used in the experiment is developed based on the principle of real-time powder mixing and flexible cleaning of excess powder. Considering that pure TiNi powder and pure Ta powder need to be used in the forming process of TiNi alloy with TiNi/Ta gradient material and Ta coating, four funnels are set above the SLM forming chamber, as shown in Figure 1. Funnel A and Funnel B are used to provide two single materials required for real-time mixing of powder in the gradient material region; Funnel C and Funnel D are respectively used to provide powder material in the pure Ta material region and pure TiNi material region. Each funnel transports the powder to the forming chamber through a powder supply pipeline. The purpose of setting up the funnel in this way is to better avoid dust pollution caused by the two different materials sharing same powder supply pipeline.

Structure diagram of SLM additive manufacturing machine for heterogeneous material.
The method of real-time mixing of powders is mainly based on the principle of airflow mixing. When the powders from Funnel A and Funnel B synchronously fall into the conical powder mixing device, argon gas from the forming chamber is fed into the conical powder mixing device through an air pump, the two powders are mixed in real time. After the powder is evenly mixed, it is fed into the powder box in the forming chamber through a powder supply pipe connected with the conical powder mixing device and the forming chamber. At least one micro vibration motor is installed on the outer side of all the powder supply pipelines mentioned above, which is to ensure that there is as little powder residue on the pipeline as possible after each powder discharge. In the forming chamber, there is a powder laying box with a powder laying scraper installed on the left side and a flexible scraper for cleaning of excess powder installed on the right side.
The working principle of the powder flexible scraper which is used for flexible cleaning of excess powder is shown in Figure 2. The scraper is made of multiple elastic wires, which can remove excess powder in the same layer during the reciprocating motions of the powder box in order to lay another powder on the same layer. 20 To prevent powder from adhering to the wall of the powder box and causing powder pollution, four powder box cleaning brushes are installed in the walking direction of the powder box. During the reciprocating motions of the powder box, the wall surface of the powder box is automatically cleaned.

The principle of flexible scraper reciprocating once for removing of excess powder: (a) the scraper starts to clean the excess powder, (b) the scraper is sweeping away the excess powder over the formed material 1 in current layer, and (c) the scraper is cleaning excess powder in reverse direction.
TiNi powder is put into Funnel A and Funnel D, while pure Ta powder is placed in Funnel B and Funnel C. When forming heterogeneous material part, additive manufacturing data is imported into the forming control system of the SLM machine, which is used to control the lowering of the forming platform, powder cleaning, powder supply, powder mixing, powder laying, laser beam scanning, and other operations. The forming process is as follows:
(1) Set relevant molding parameters and prepare for molding.
(2) Lower the forming platform by one layer and prepare to lay powder.
(3) Read the scan path information of a group of path data in the current layer.
(4) Find the material volume ratio information corresponding to the path data of this group, and execute powder supply and mixing:
① If it belongs to the pure TiNi material region, the powder box moves to the outlet of the pipeline corresponding to Funnel D and TiNi powder is drained from Funnel D;
② If it belongs to the pure Ta material region, the powder box moves to the outlet of the pipeline corresponding to Funnel C and Ta powder is drained from Funnel C;
③ If it belongs to the gradient material region, the powder box moves to outlet of the pipeline corresponding to conical powder mixing device. The forming control system drains TiNi powder and Ta powder that meet the material volume ratio from Funnel A and Funnel B. The two powders automatically flow into the conical powder mixing device, while the air pump starts working to perform real-time powder mixing. The mixed powder is discharged into the powder box.
(5) The powder box loaded with powder material moves to the right. The powder scraper lays the powder on the forming platform.
(6) According to the scanning path information of the current group path data in the current layer, the laser beam selectively melts metal powder to form metal piece.
(7) The flexible scraper for cleaning of excess powder on the right side of the powder box moves back and forth following the powder box to remove the excess powder from the current layer. The four fixed powder box cleaning brushes also automatically clean all compositions on the powder box, while the micro vibration motors maintain vibration to achieve the goal of completely removing excess powder and preventing powder contamination.
(8) Repeat steps (3)–(8) until the current layer of the heterogeneous material part is formed.
(9) Go to step (2) and cycle through steps (2)–(9) until the SLM molding of the entire heterogeneous material part is formed.
Separation and purification of non-ferromagnetic mixed powder
Separation and purification process method
Due to the principle of PBF, when forming different materials within the same layer during SLM molding process, excess powder outside the formed selective zone in the layer must be removed before laying another powder with different material compositions. In this way, different materials can be formed within the same layer through selective laser melting of different powders. The various powders that are removed will be mixed together, and if not separated, purified, recycled, and reused, it will cause great waste. Especially for TiNi alloy powder and Ta powder, even a slight waste can result in significant losses due to their high price.
Due to the fact that TiNi powder and Ta powder are non-ferromagnetic materials that are not magnetic conductive, they cannot be separated and purified through magnetic separation. Another commonly used method for powder separation and purification is the sieving method. However, due to the fact that the particle size of the powder materials used in the SLM process generally does not exceed 75 μm, in order to better separate and purify the two powders, there must be a certain particle size difference between the two powders. This will cause the other powder to be extremely small, part of the powder particles already smaller than 10 μm (already belonging to the category of ultrafine powders). These particles are easily agglomerated due to Van der Waals force and other effects, it difficult for the powder to pass through small sieves. Therefore, it is currently difficult to find reports on the separation and purification of two types of micron scale mixed metal powders with ultrafine powders by sieving method.
For agglomerated ultrafine powders, by adding an ultrasonic device on the sieve, the agglomeration diameter will be affected by the ultrasonic frequency and amplitude. The specific relationship can be referred to the following formula 35 :

where da is the diameter of the agglomeration; AH is the Hamak constant; Z0 is the initial distance between two aggregates that have just broken; V is the relative velocity when two aggregates collide; εa is the aggregate gap; dp is the average particle diameter; A is the amplitude; f is the frequency.
As can be seen from equation (1), the larger the amplitude and frequency, the easier it is to suppress the particle diameter of the powder agglomeration, which will increase the chance of passing through the sieve.
Therefore, this study used a rotary vibration screening machine equipped with an ultrasonic device (Figure 3) to separate and purify the two type of powders. At the same time, in order to prevent powder leakage from the screening machine during long-term screening, the screening machine used in this study has only a powder outlet at the bottom of the screen.

Schematic diagram of ultrasonic rotary vibrating sieve machine.
During the screening process, the sieve cover is often opened to timely pull back the powder that has been scattered and gathered at the edge of the sieve to the middle of the sieve, which can increase the contact area between the powder and the sieve to accelerate the screening speed.
Experiment parameters
The original TiNi powder is a spherical powder with a particle size of 25–74 μm. Its compositions are: Co (<0.005wt%), Cu (<0.005wt%), Cr (<0.005wt%), Fe (<0.005wt%), Nb (<0.010wt%), C (0.008wt%), N (0.045wt%), O (<0.0495wt%), Ni (55.55wt%), and Ti (Bal.), with a flowability of 22.37 s/50 g.
Original Ta powder with particle size ≤18 μm. Its compositions are: Mo (0.0004wt%), Si (0.0004wt%), Nb (0.0005wt%), W (0.0006wt%), N (0.0222wt%), O (0.0235wt%), Fe (0.002wt%), C (0.0038wt%), Mn (0.0004wt%), H (0.0050wt%), and Ta (Bal.), with poor flowability (which cannot be measured with a tester).
The main steps for separating and purifying the mixed powder after the SLM additive manufacturing experiment of heterogeneous material are shown in Figure 4. The ultrasonic frequency used is 37 kHz during the screening process.
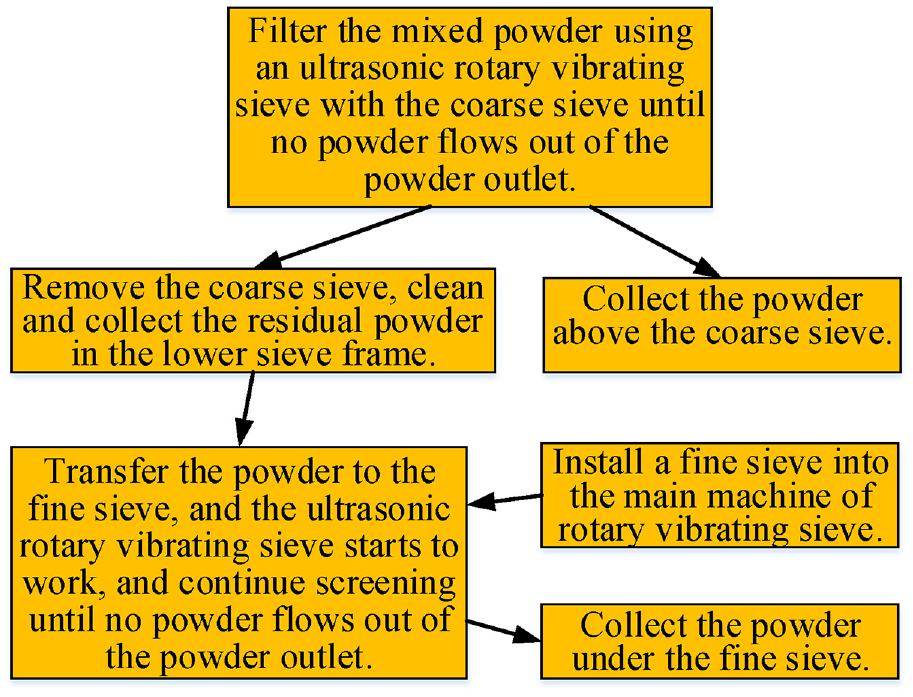
Flow of separation and purification of mixed powder by ultrasonic rotary vibrating sieve.
Two types of screens are used. One is a 316L stainless steel screen (hereinafter referred to as “fine screen”) with a mesh number of 120 × 1100, wire diameter of 0.07 mm × 0.05 mm (warp × parallel), and maximum passing particle size of 17 μm. Another is a 316L stainless steel screen (hereinafter referred to as “coarse sieve”) with a mesh number of 90 × 780, wire diameter of 0.01 mm × 0.07 mm (warp × parallel), and maximum passing particle size of 25 μm.
Preparation of powder specimens
(1) The sample preparation for Scanning Electron Microscopy (SEM) microanalysis of the powder separation and purification process is as follows:
SEM were used to take photos of powder samples obtained during the separation and purification process, which allowed the observation of changes in the powder state at different stages of the sieving process. The powder samples extraction is described as follows:
Before the beginning of the experiment, a few grams of the mixed powder were taken as SEM observation samples (Sample 1), and then the remaining mixed powder was used to carry out the experiment according to the steps in Figure 4. When the experiment lasted for 1 h, a few grams of powder were taken from the top of the coarse sieve as SEM samples (Sample 2); When the experiment lasted for 14 h and 25 min, a few grams of powder were taken from the top of the coarse sieve as SEM samples (Sample 3), and a few grams of powder were taken from the bottom of the coarse sieve as SEM samples (Sample 4).
When the powder was sieved by a coarse sieve to 14 h and 25 min, the powder underneath the coarse sieve was moved to a fine sieve for sieving according to the steps in Figure 4. When the sieving was done for 2 h, a few grams of powder were taken from the bottom of the fine sieve as SEM samples (Sample 5). And when the sieving was done for 5 h, a few grams of powder were taken from the bottom of the fine sieve as SEM samples (Sample 6).
(2) Preparation of powder analysis samples after separation and purification
After powder separation and purification, the composition of the purified powders was detected by ICPOES detection method (equipment model: Agilent ICPOES 720).
The powder composition detection samples is made as follows: after the powder separation and purification experiment, 10 g of powder were taken from the top of the coarse sieve, and the sample number was recorded as A. Ten grams of powder were taken from the bottom of the fine sieve, and the sample number was record as B. The samples A and B were used as the sample for powder composition testing and analysis in this study.
It is necessary to made solutions of samples A and B before carrying out ICPOES experiments. The sample A can be made into an observational solution by using aqua regia and a digestion tank due to small amount of Ta. However, sample B is dominated by Ta which is an extremely inactive metal. It is necessary to use aqua regia+ hydrofluoric acid to make an observation solution.
Analysis of separation and purification process and results
Figure 5 shows SEM photographs of the powder on or under sieves at different stages of the separation and purification process. According to the employed sieving principle, the longer the sieving time, the richer the content of TiNi powder on the sieve, which is illustrated in Figure 5(a) to (c). Figure 5(c) shows the powder on the coarse sieve at 14 h and 25 min of sieving. It can be seen that the powder has been basically full of spherical TiNi powder particles. It can be seen from Figure 5(d) that some spherical TiNi particles are still present in the powder transferred to the fine sieve. It can be seen from Figure 5(e) and (f) that the spherical TiNi particles are not observed. It means that the fine sieve is effective in separating TiNi particles.
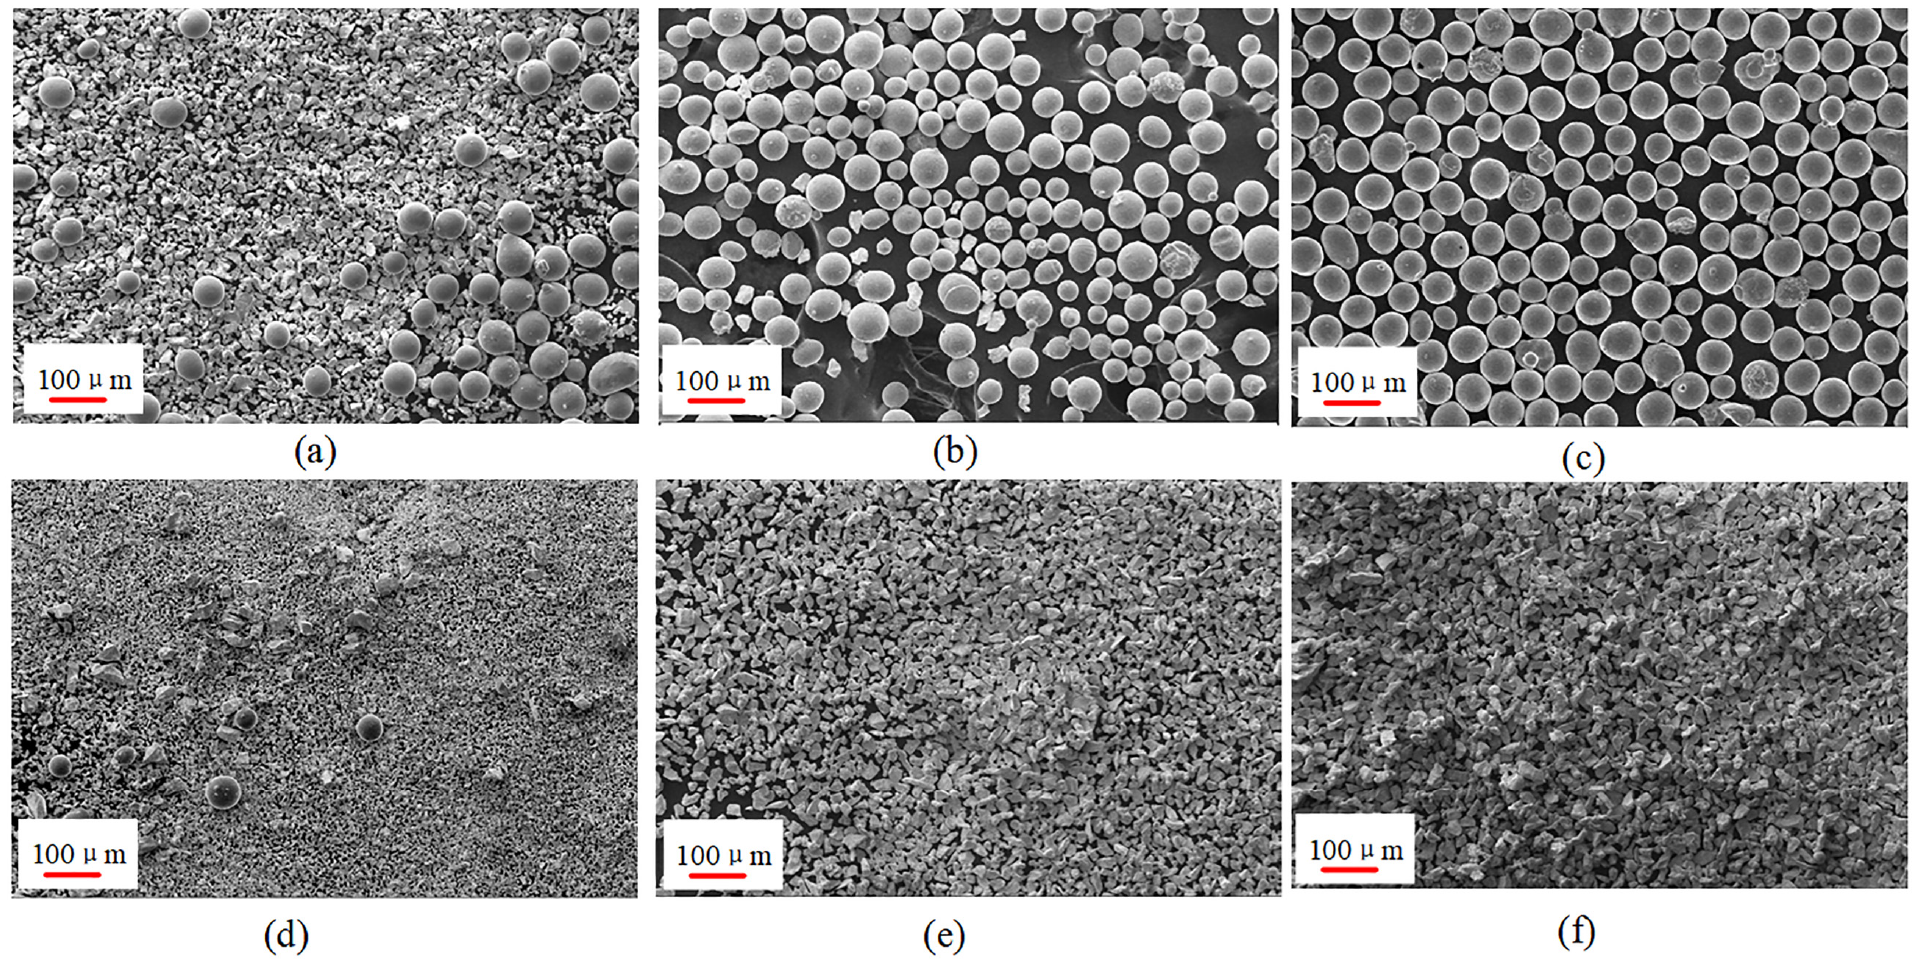
SEM photographs the mixed powder at different stages of the separation and purification process: (a) Sample 1, (b) Sample 2, (c) Sample 3, (d) Sample 4, (e) Sample 5, and (f) Sample 6.
By combining the ICPOES detection method (equipment model: Agilent ICP OES 720) with EA detection method (equipment model: Elemental Vario EL cube), the composition of samples A and B can be obtained.
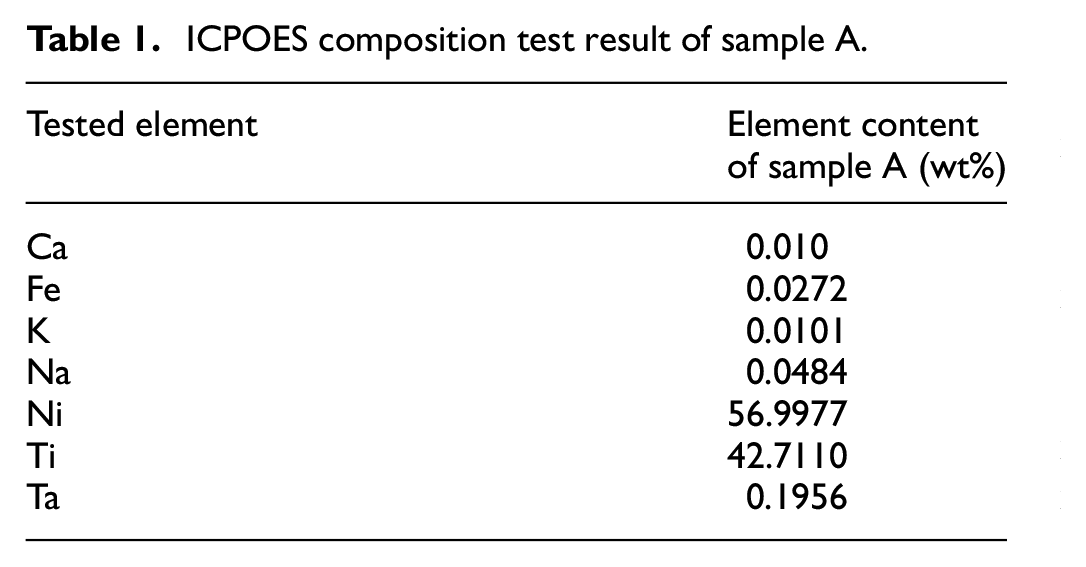
Tables 1 and 2 show the results of ICPOES composition analysis and detection. It should be noted that several elements compositions are labeled with “<0.005wt%” in the detection results. These inaccurate measurements of extremely trace elements were not considered in Tables 1 and 2 that were normalized.
ICPOES composition test result of sample A.
ICPOES composition test result of sample B.

According to Tables 1 and 2, the ICPOES composition detection results of the samples A and B can be interpreted as follows:
It can be seen that the mass percentage content of TiNi in sample A is 99.7087%, and the Ta proportion in sample B is 98.8501%. Therefore, both powders have achieved high separation and purification concentrations. Therefore, the mass percentage content of impurity in sample A and sample B is very small, and the impurity level in the powder is accepted in this study. The presence of these trace impurities does not affect the medical application of the envisaged tantalum-coated TiNi alloy.
This confirms that the separation and purification of TiNi/Ta powder mixture by using an ultrasonic rotary vibration screening machine and the adopting the above mentioned screening process method are effective, which provides strong support for the repeating the experiments on SLM forming of TiNi/Ta non-ferromagnetic heterogeneous Material in this study.
Forming experiment
Experimental equipment and materials
The experimental equipment is a self-developed SLM additive manufacturing machine for heterogeneous material, as shown in Figure 1. It is mainly equipped with a 500 W continuous fiber laser, a real-time powder mixing device, a device for flexible cleaning of excess powder, a forming platform, and four quantitative powder supply funnels. Each funnel has a stirring rod that continuously acts during the powder supply process to ensure that the powder with poor fluidity can be smoothly discharged.
This machine is equipped with a laser with a laser beam quality M2 factor ≤1.3, a laser wavelength of 1075 nm. And the maximum forming size of the machine is 80 mm × 80 mm × 80 mm with a settable range of powder thickness of 20–100 μm.
The experimental substrate is Ti6Al4V plate with a size of 50 mm × 50 mm × 5 mm. The experimental powder materials are TiNi powder and Ta powder that were repeatedly purified by ultrasonic rotary vibration screening.
The experimental protective gas is argon gas with a volume fraction of 99.98% in the experiment. During the experimental molding process, it is ensured that the oxygen content in the building room is ≤600 ppm. After the experiment, the morphology and composition information of the TiNi/Ta non-ferromagnetic heterogeneous material were obtained by comparing sample photos and combining SEM microanalysis and EDS analysis (using Zeiss EVO18 scanning electron microscopy and its accompanying OXFORD Inca250X Max energy spectrometer).
Experimental data and forming parameters
Considering that TiNi alloy and Ta are two completely different heterogeneous materials, it is preferable to have a material gradient transition between the two pure material regions to enhance their bonding strength. Based on this, a three-dimensional model of the gradient material sample was designed, as shown in Figure 6. The sample is 10.36 mm × 10.36 mm × 1.86 mm.

Structural composition of the sample of TiNi alloy with Ta coating (the ratio in the figure is the volume ratio).
The surface of the sample is covered with a pure Ta coating thickness of 180 μm at the top and 90 μm at the bottom and sides. The core of the sample is a rectangular TiNi matrix with a height of 0.69 mm, which is made of 100% TiNi alloy. The bottom of the sample is a 0.54 mm thick Ta base to support the entire sample. In the sample, two gradient regions with a thickness of 90 μm are used to achieve the transition between TiNi and Ta materials. The volume ratio of TiNi/Ta powder supplied to the first gradient is set at 1:1, and the volume ratio of TiNi/Ta powder supplied to the second gradient is set at 2:1. This setting can result in a gradient decrease in the content of TiNi alloy and a gradient increase in the content of Ta from the inside to the surface of the sample.
The data processing of the designed sample before 3D printing is as follows 36 : According to the position of each sub material in the 3D model, the 3D models of each sub material are shifted, layered, and sliced. After scanning path planning, four sets of sub material model path data are obtained. From the outside to the inside of the sample, there are 01 group of paths, 02 group of paths, 03 group of paths, and 04 group of paths. The slice data layer thickness is set to be 30 μm. A txt format file was created to store material information. Four material compositions which are correspond to the four groups of path data mentioned above were created in the file through four lines of information: Mat01 1:0; Mat02 1:1; Mat03 2:1; Mat04 0:1, each row of information represents the volume ratio of TiNi/Ta powder. The four groups of path data and the material file in txt format were imported into the folder of the control system of the SLM additive manufacturing machine for heterogeneous material to obtain complete additive manufacturing data for controlling the forming process.
In this forming experiment, during the SLM process of the sample part, the execution order of the four scanning paths is: Ta base ->Ta coating ->first gradient material ->second gradient material ->TiNi matrix.
Before the experiment, the experimental parameters were set in the SLM additive manufacturing machine for heterogeneous material as shown in Table 3.
Main forming parameters for SLM experiment of TiNi alloy with Ta coating.

Forming parameters and result
Before the experiment, the experimental parameters were set in the SLM additive manufacturing machine for heterogeneous material as shown in Table 4. The formed TiNi alloy sample with Ta coating is shown in Figure 7.
Main material component content and error analysis of each micro-zone along the direction of material layer by layer stacking.


Photos of the sample of TiNi alloy with Ta coating.
Forming result and preparation for analysis and testing
The sample was cut along the K-K′ direction of by using the wire cutting method (Figure 7), and the sample was polished with 100 #, 800 #, and 1000 # metallographic sandpapers in turn, and it was polished with polishing paste and flannel. Then, the sample was subjected to surface corrosion using a corrosive agent (HF:HNO3:H2O = 1:3:6) with a corrosion time of 20–30 s. The cleaned and dried sample was observed on a SEM equipment, which is also equipped with an EDS instrument that can analyze material composition and distribution. The analysis of the sample included SEM micrographs and analysis of EDS material composition and distribution.
Result discussion
As can be seen from Figure 7, the sample has a regular appearance and no warping deformation. However, it can also be seen that the upper surface of the sample is not flat enough, which is due to the fact that the molding parameters have not been optimized. This results in a slight spheroidization phenomenon during the SLM process, 37 which reduces the surface accuracy of the sample.
The obtained cross-sectional morphology photo is shown in Figure 8. It can be seen that there are basically no pores in the internal structure of the sample, and the structure has achieved complete metallurgical bonding. On the other hand, it is also easy to see that the colors inside and outside the cross-section are different, which reflects the characteristics of heterogeneous material organization with different materials arranged in different positions.

SEM micrograph of the sample of TiNi alloy with Ta coating.
In order to determine the approximate distribution of material composition, EDS surface scanning was performed on the cross-section of the sample. The surface distribution of Ti, Ni, and Ta elements are shown in Figure 9. It can be seen from Figure 9 that the three elements are basically arranged according to the expected settings. Based on the enrichment degree of Ti, Ni, and Ta elements in this figure, the four material regions of Region A, B, C, and D can be roughly identified in comparison with the model size in Figure 6.

EDS surface scanning position and elements distribution in the scanning area: (a) EDS surface scanning position, (b) Ti, (c) Ni, and (d) Ta.
The Region D corresponds to the TiNi matrix in the model in Figure 6. The Region C corresponds to the second gradient in the model. The Region B corresponds to the first gradient in the model. The Region A corresponds to the Ta coating and Ta base in the model. As can be seen from the distribution of elements in Region C and D, the elements in the two gradient regions exhibit a degree of component gradient distribution.
Based on the actual dimensions of each material region in Figure 9, the four material regions with labels Region A, B, C, and D were marked on the SEM photograph in Figure 8. Further analysis of Figure 8 reveals that the color characteristics of its cross-section roughly correspond to the marked material regions. The gray black tissue corresponds to Region D. The dark gray tissue corresponds to Region C. The light gray tissue corresponds to Region B. The gray white tissue corresponds to Region A. The color gradually becomes lighter from the innermost region D to the outermost region A, which indicates that the material composition changes in a gradient. It can be seen from Figure 8 that the bonding between material regions is good, and there are no cracks, pores, and other defects at the regional boundaries. The boundary materials show a complete melting feature, which indicates that pure Ta and TiNi alloy materials have achieved a relatively dense state through laser melting and gradient transition, and the forming quality is good. However, it should also be noted that the side wall of the sample easily adheres to the powder particles during the SLM process, 38 which results the size of the side of the sample is approximately one times larger than the ideal wall thickness (90 μm).
On the sample profile, EDS line analysis was carried out along the S1-S2 scanning line (opposite to the direction S which materials are stacked layer by layer) in Figure 10(a), and the material composition in the line was measured. The measurement result is shown in Figure 10(b). Similarly, in order to facilitate comparative analysis, only changes in Ti, Ni, and Ta elements were considered in the analysis of sample composition. It can be seen from Figure 10(b) that the TiNi alloy content is very low in the Region A; the Ta content is very low in the Region D; the Ta content gradually decreases and the TiNi content gradually increases between the Region A and the Region D, which basically forms a transition of Ta/TiNi gradient composition in the direction of material layer by layer stacking.

EDS line analysis position and corresponding energy spectrum curve along the direction of material layer-by-layer stacking: (a) EDS line analysis position and (b) the energy spectrum curve of EDS line analysis.
To further analyze the material composition distribution along the material layer-by-layer stacking direction (S-direction in Figure 11(a)), EDS point scanning analysis was conducted in this direction: micro-zones were selected along this direction, and each micro-zone was approximately greater than 0.05 mm × 0.05 mm. The selected positions of micro-zones 1-1, 1-2, and 1-3 (as shown in Figure 11(a)) are located in Region A (white); micro-zones 1-4, 1-5, and 1-6 were selected to be located in the Region B (light gray); micro-zones 1-7, 1-8, and 1-9 were selected to be located in the Region C (dark gray); the selected positions of micro-zones 1-10, 1-11, and 1-12 are located in the Region D (gray black) . The histogram of element mass percentage content in the micro-zones is shown in Figure 11(b). To facilitate the comparison of the error between the ideal composition of the material and the measured value, the content of the main material components and the error analysis of each micro-zone along the direction of material layer by layer stacking are shown in Table 4.
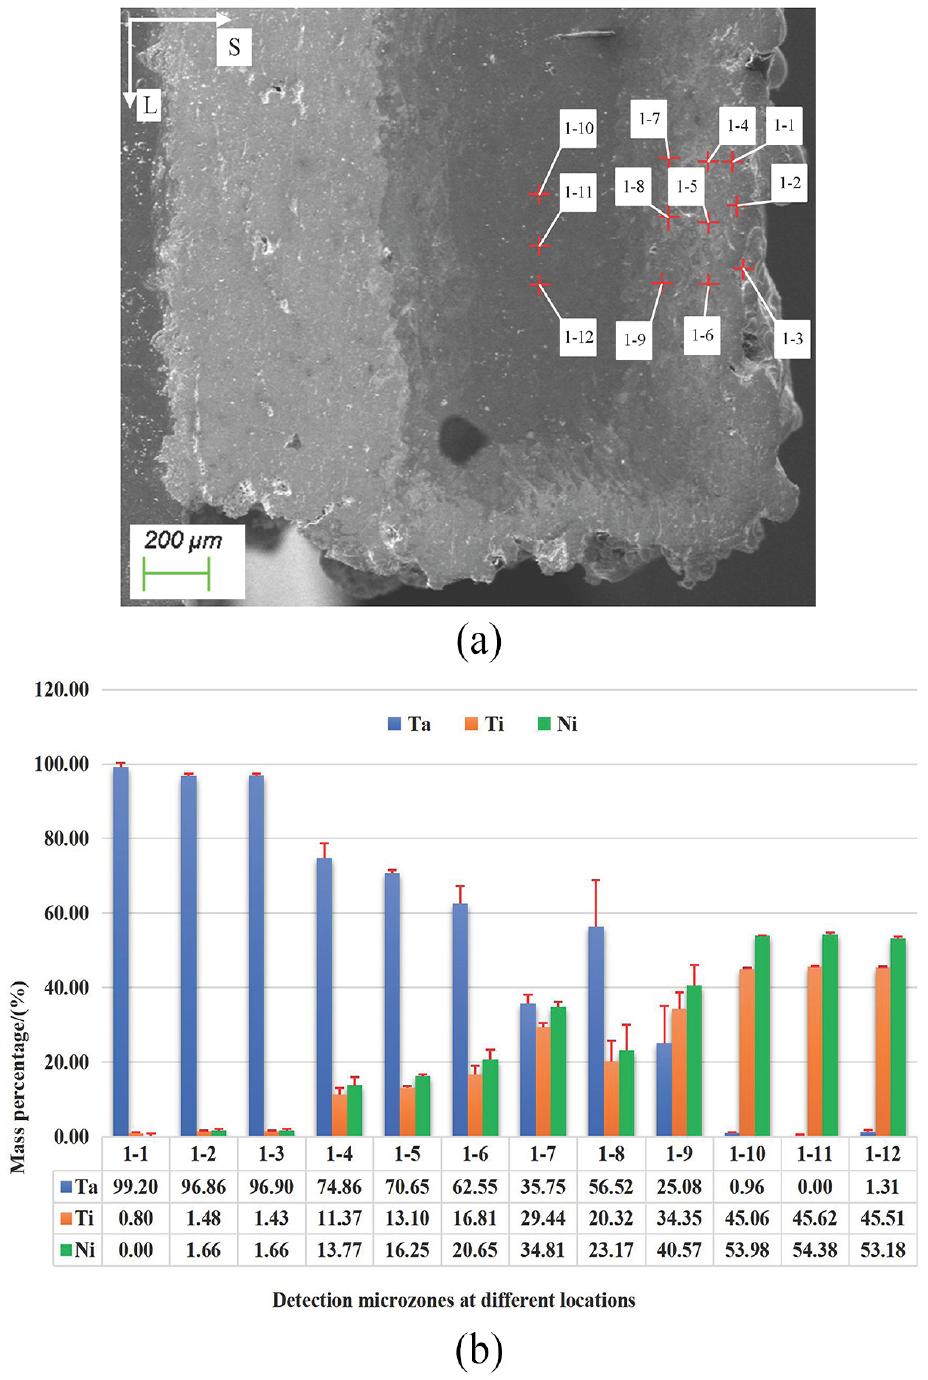
EDS point scanning analysis position and main element mass percentage of each micro-zone along the direction of layer-by-layer materials stacking: (a) schematic diagram of EDS micro-analysis position and (b) histogram of main elements content.
As can be seen from Figure 11(b) and Table 4, the main material composition of Region A is Ta. The mass percentages of Ta in micro-zones 1-1, 1-2, 1-3 belonging to Region A are 99.20%, 96.86%, and 96.90%, respectively. The relative errors between Ta and the true value (ideal value) of Region A are −0.80%, −3.14%, and −3.10%, respectively. For EDS point scanning analysis, when the element mass percentage is greater than 20%, the allowable relative error does not exceed ±5%. 26 Therefore, ignoring the allowable measurement error, it can be considered that the Region A has formed a relatively pure Ta material along the direction of material layer by layer stacking.
In the Region B, the mass percentages of Ta in the 1-4, 1-5, and 1-6 micro-zones are 74.86%, 70.65%, and 62.55%, respectively. Correspondingly, when the true value (ideal value) of 71.55%, the error values are 3.31%, −0.9%, −9%, and the relative errors are 4.63%, −1.26%, and −12.58%, respectively. The relative error values of Ta composition in the 1-6 micro-zones exceed the allowable relative error (±5%) for EDS point scanning analysis. Therefore, while the maximum allowable measurement error is ignored, it can be considered that there is a decrease in Ta content in the Region B along the direction of layer by layer stacking of the material.
In the Region C, the mass percentages of Ta in the 1-7, 1-8, and 1-9 micro-zones are 35.75%, 56.52%, and 25.08%, respectively. The error values from the true value (ideal value) of 56.08% are −20.33%, 0.44%, −31%, and the relative errors are −36.25%, 0.78%, and −55.28%, respectively. Similarly, in addition to micro-zone 8, there are also a decrease in Ta content along the direction of layer by layer stacking of the material.
In the innermost TiNi matrix D region, the mass percentages of TiNi in the 1-10, 1-11, and 1-12 micro regions are 99.04%, 100%, and 98.69%, respectively. The errors from the true value (ideal value) of 100% are −0.96%, 0%, and −1.31%, respectively. As mentioned above, these are within the allowable error range, similarly, which indicate that relatively pure TiNi material was also obtained in the innermost Region D along the direction of layer by layer stacking of the material.
On the sample profile, EDS line analysis was carried out along the powder laying direction (L direction in Figure 12(a)) to measure the material compositions in the L1- L2 scanning line in Figure 12(a). The measurement result is shown in Figure 12(b). As can be seen from Figure 12(b), along the scanning direction of the sample profile, the material compositions are mainly Ta, TiNi/Ta gradient composition, and TiNi, respectively. Therefore, a Ta/TiNi gradient transition is basically formed along the powder laying direction.
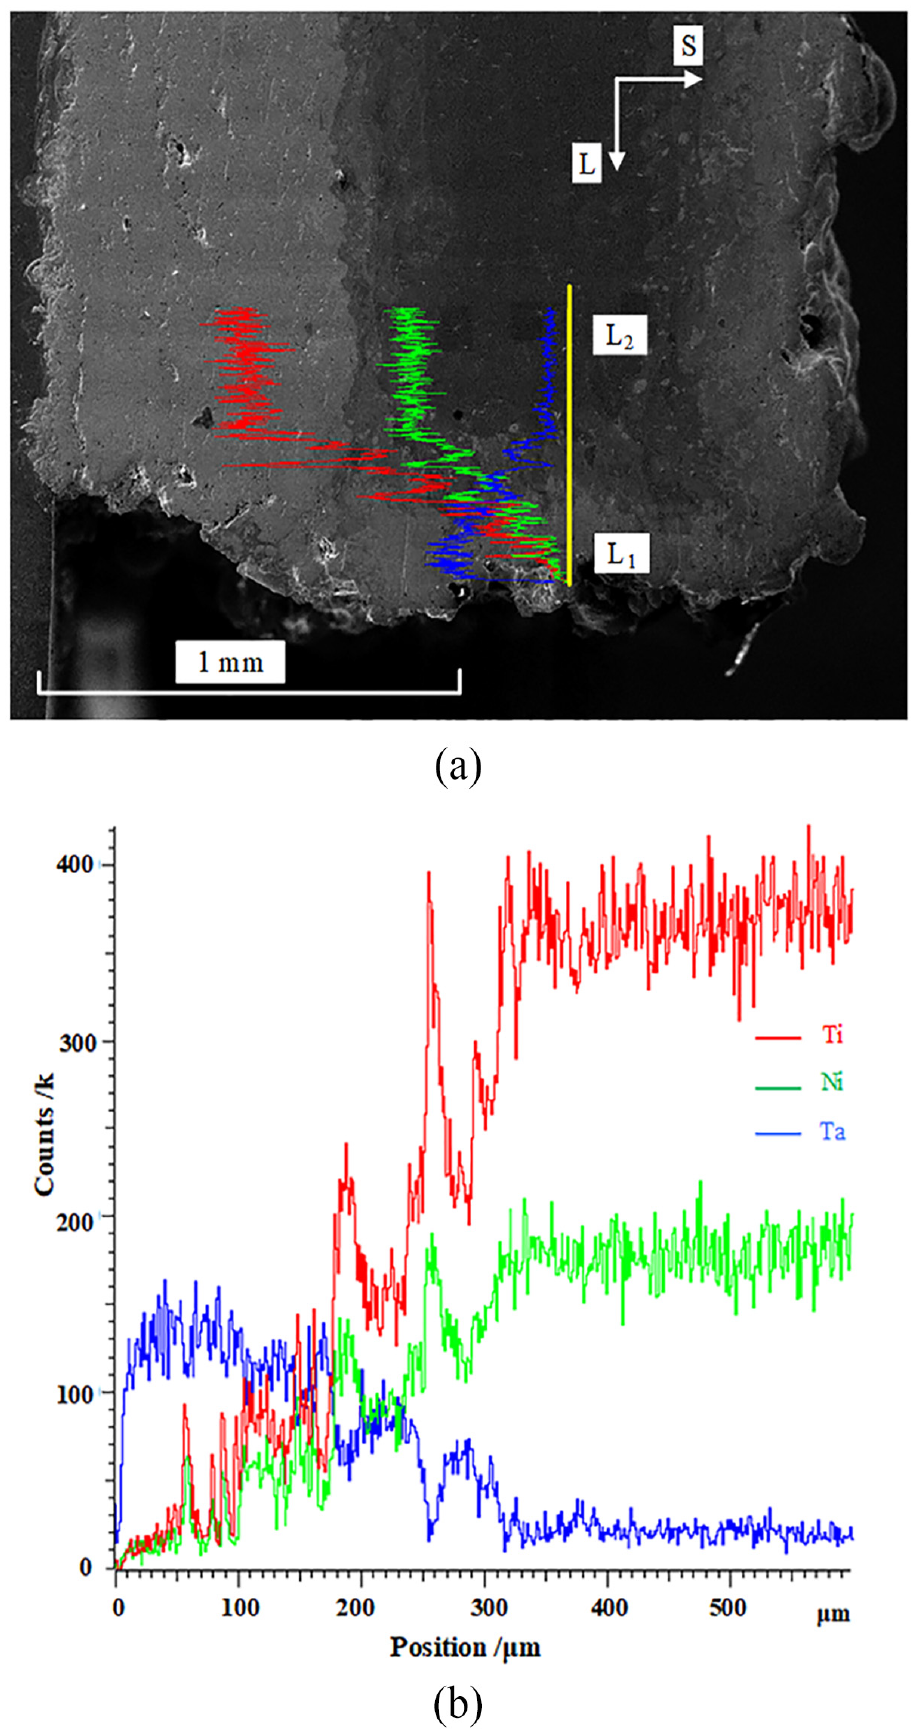
EDS line analysis position and corresponding energy spectrum curve along the direction of powder laying: (a) EDS line scanning position and (b) the energy spectrum curve of EDS line analysis.
To further clarify the distribution of material compositions along the powder laying direction, material composition detections were conducted on the Region A, the Region B, the Region C, and the Region D on the side of the sample. Micro-zones with dimension slightly greater than 0.05 mm × 0.05 mm were picked up at three different locations within each region for the main element content detection by EDS point scanning analysis. The sampling location and element mass percentage content of each micro-zone are shown in Figure 13. To facilitate the comparison of the error between the ideal composition of the material and the measured value, the content of the main material components and the error analysis of each micro-zone along the direction of powder laying are shown in Table 5.

EDS point scanning analysis position and main element mass percentage of each micro-zone along the direction of powder laying: (a) schematic diagram of EDS micro-analysis position and (b) histogram of main elements content.
Main material component content and error analysis of each micro-zone along the direction of powder laying.
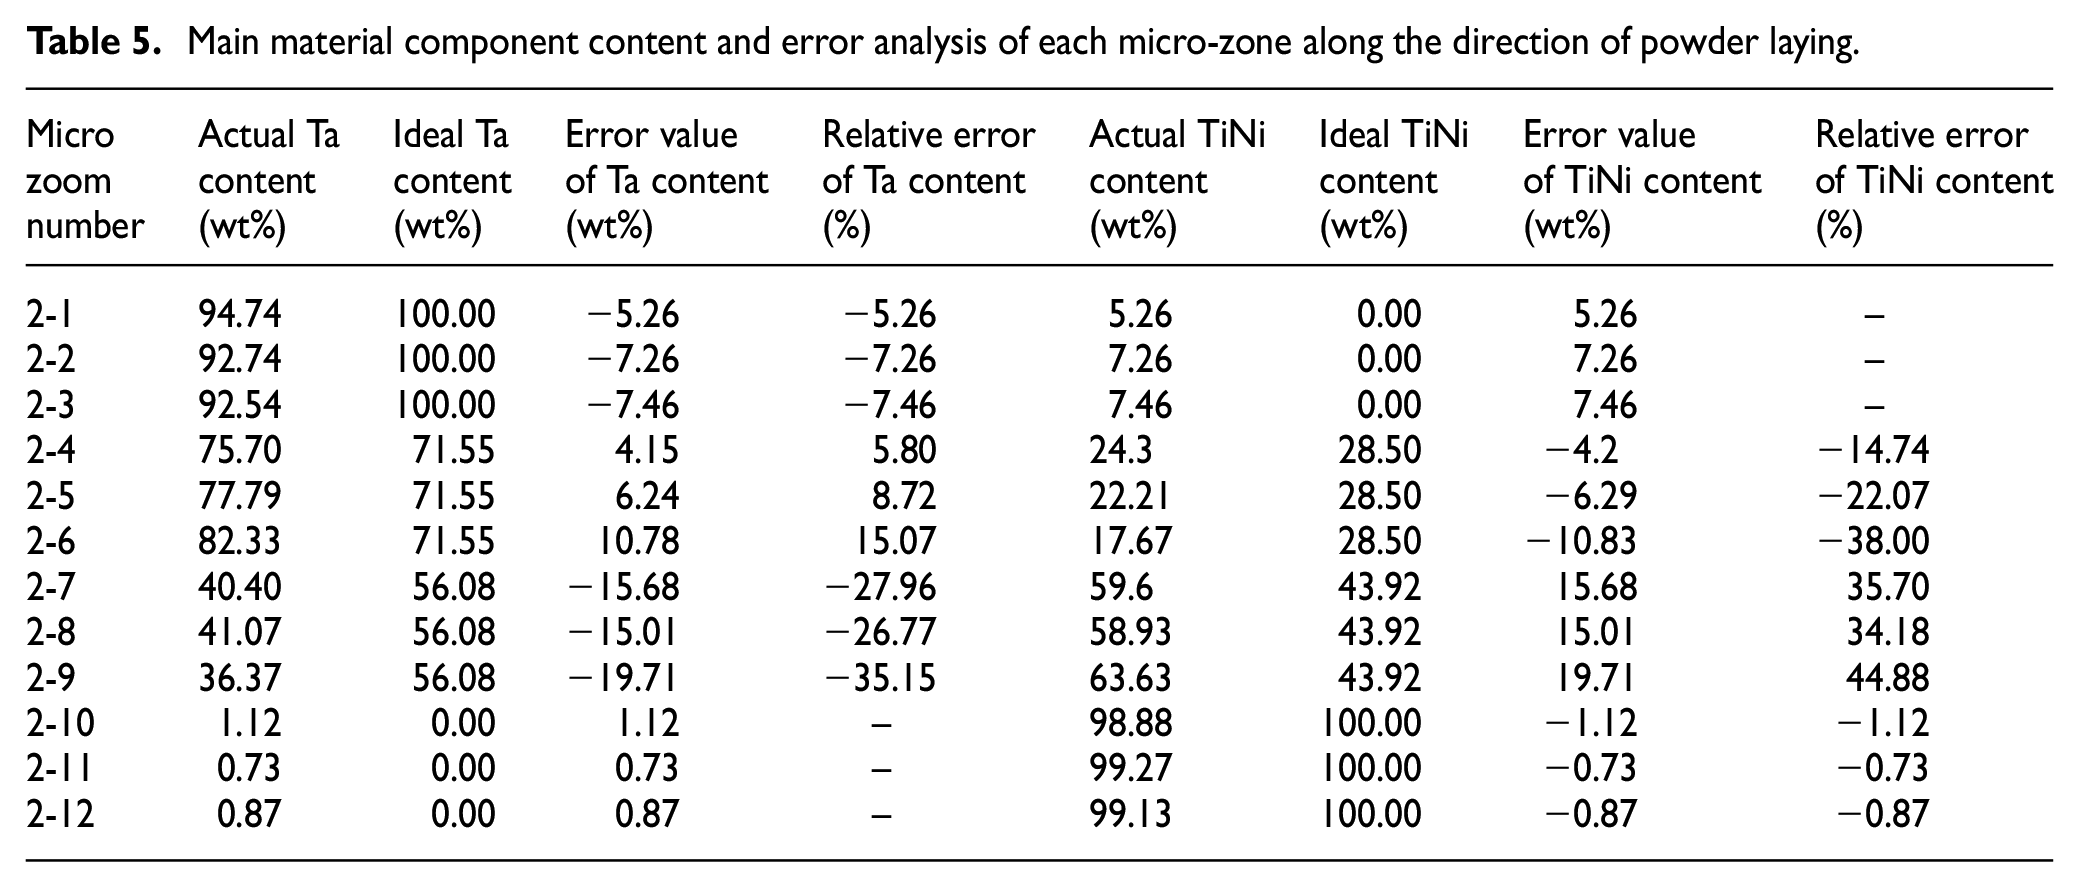
It can be seen from Figure 13 and Table 5 that the main material composition of the 2-1, 2-2, and 2-3 micro-zones of Ta coating A is Ta. The mass percentages of Ta are 94.74%, 92.74%, and 92.54%, respectively. The errors from the true value (ideal value) of 100% are −5.26%, −7.26%, and −7.46%, respectively, and the relative errors are −5.26%, −7.26%, and −7.46%, respectively. As mentioned above, since the relative error of EDS detection does not exceed ±5% when the element mass percentage is greater than 20%. Therefore, based on the similar analysis, a micro-zone with slightly lower Ta content than the ideal value was detected in the Region A along the powder laying direction, which indicates a slight contamination of TiNi components, but the degree of contamination is not serious.
In the 2-4, 2-5, and 2-6 micro-zones of the Region B, the mass percentages of Ta are 75.70%, 77.79%, and 82.33%, respectively; The error values from the true value (ideal value) of 71.55% are 4.15%, 6.24%, and 10.78%, respectively; The relative errors are 5.80%, 8.72%, and 15.07%, respectively. As mentioned above, since the relative error of EDS detection does not exceed ±5% when the element mass percentage is greater than 20%, for the same reason, it is shown that the Ta content in each micro-zone of the Region B along the powder laying direction is slightly higher than the ideal value.
In the 2-7, 2-8, and 2-9 micro-zones of the second gradient region C, the mass percentages of Ta are 40.40%, 41.07%, and 36.37%, respectively; The error values from the true value (ideal value) of 56.08% are −15.68%, −15.01%, and −19.71%, respectively; The relative errors are −27.96%, −26.77%, and −35.15%, respectively. As the relative error of EDS detection does not exceed ±5%, similarly, the Ta content in each micro-zone of the second gradient region C along the powder laying direction is lower than the ideal value.
The main material component of the Region D is TiNi. In its three micro-zones 2-10, 2-11, and 2-12, the mass percentages of TiNi are 98.88%, 99.27%, and 99.13%, with an error value of −1.12%, −0.73%, and −0.87%, respectively, compared to the ideal value of 100%. The relative errors are −1.12%, −0.73%, and −0.87%, which are all within the relative error range (±5%) of the EDS detection mentioned above. Therefore, based on the similar analysis, it is shown that along the powder laying direction, relatively pure TiNi material was obtained in various micro-zones of the Region D.
In summary, in the Region A, the material is basically not contaminated along the direction of material stacking layer by layer, and the expected goal of obtaining relatively pure Ta materials has been achieved; however, the material is slightly contaminated with TiNi material along the direction of powder laying. In the Region D, the material is basically not contaminated along the material stacking direction and powder laying direction, which achieves the expected goal of obtaining relatively pure TiNi materials.
In the Region B and the Region C, it is evident that there are a certain degree of errors between the formed material and the ideal material composition. The cause can be attributed to two harmful phenomena that occurred during this experiment:
(1) The actual supply of Ta powder is less than expected. Due to the poor flowability of Ta powder used, it is difficult for the powder to flow out of the Funnels B, C. Even if each funnel is equipped with a stirring rod, the actual amount of powder released from the funnel is still less than expected.
(2) It is difficult to completely remove a trace of powder near the solid-powder interface or the solid-solid interface which are made of two different materials along the direction of powder laying.
As shown in Figure 2, the powder is too small at the interface between the formed solid material and the powder (the solid-powder interface), it is difficult to clean the powder at the interface in one sweep. A trace of small powder particles exist at the solid-powder interface (indicated by the solid line arrow in Figure 2(c)), or at the interface between solid material 1 and solid material 2 (the solid-solid interface, indicated by the dotted arrow in Figure 2(c)), resulting in contamination of material compositions between heterogeneous material regions along the powder laying direction. The size of this pollution area is mainly related to layer thickness, flexible scraper cleaning frequency, material quality of flexible scraper, and other factors. Due to the small powder particles, the width of the pollution area is not very large, which is usually less than 0.5 mm.
For the formed material at the interface between the two materials in the direction of material layer-by-layer stacking, its material composition is only affected by the first harmful phenomena. This can be seen from the material composition analysis of micro-zones 1-6 to 1-12:
(1) Micro-zones 1-1, 1-2, and 1-3 belong to Region A along the direction of material layer-by-layer stacking, while micro-zones 1-10, 1-11, and 1-12 belong to Region D along the direction of material layer-by-layer stacking. The errors between the measured values of material composition in these micro-zones and the true value (ideal value) are within the allowable error range of EDS measurement, which indicate that there are almost no material composition pollution in these micro-zones.
(2) Micro-zones 1-4, 1-5, 1-6 belong to the Region B along the direction of material layer-by-layer stacking, and micro-zones 1-7, 1-8, 1-9 belong to the Region C along the direction of material layer-by-layer stacking. In these micro-zones, either the material composition is displayed within the allowable error range of EDS measurement (such as micro-zones 1-4, 1-5, 1-7) or the Ta content is displayed as low (such as micro-zones 1-6, 1-7, 1-9), which indicate that the actual supply of Ta powder is less than expected and these micro-zones are not contaminated by the composition of TiNi material.
It can also be clearly confirmed by the above EDS measurements that the material composition along the direction of powder laying is affected by two harmful phenomena simultaneously:
(1) Micro-zones 2-1, 2-2, and 2-3 belong to Region A selected along the powder laying direction. The relative errors of Ta content exceed the allowable error range of EDS measurement (±5%), and all are negative values. As mentioned above, the material compositions in these zones are slightly contaminated by TiNi powder. Since the first harmful phenomenon only reduces the supply of Ta powder and does not affect the material composition in the Region A (the vast majority of material is Ta), it can only be caused by the second harmful phenomenon. The reason is: After printing the last material region (belongs to Region D, the vast majority of material is TiNi) of the previous layer, according to the heterogeneous material SLM molding principle of this study, it is necessary to remove the excess TiNi powder around the formed layer first, and then lay a new layer of powder (pure Ta) before printing Ta coating region A. When cleaning excess TiNi powder, the formed material is higher than the bottom of the flexible scraper, the flexible scraper needs to deform over the formed material, which makes it difficult to clean too small TiNi powder. Thus, at the interface between the powder and the formed material (at the mark F shown in Figure 2), a pollution micro area is formed. Since the scanning area width of Region A is only 90 μm, the entire scanning area is easily within the range of contaminated micro area. Therefore, it can be concluded that the second harmful phenomenon causes the contamination of Ta material by TiNi combing with EDS analysis.
(2) Micro-zones 2-10, 2-10 to 2-12 belong to the Region D (the vast majority of material is TiNi) selected along the powder laying direction. The width of the Region D exceeds 10 mm (far more than the size of the micro pollution area caused by the second defect phenomenon, which generally does not exceed 0.5 mm wide, mentioned above), and the selected point is inside the Region D, which is far from the interface of two different materials. Therefore, it is not affected by the second defect phenomenon, which can also be confirmed by the above EDS analysis: the TiNi content detection is within the allowable error range of EDS detection, showing relatively pure and uncontaminated.
(3) Micro-zones 2-4, 2-5, and 2-6 belong to the Region B along the powder laying direction (with a setting Ta/TiNi volume ratio of 1:1), and EDS detections show that the Ta contents in the three micro-zones are relatively higher than the ideal value. micro-zones 2-7, 2-8, and 2-9 belong to the Region C along the powder laying direction (with a setting Ta/TiNi volume ratio of 1:2), and EDS detections show that the Ta contents in the three micro-zones are relatively less than the ideal value. The preset width values for the Region B and the Region C along the powder laying direction are both 90 μm. However, the relative errors of the three micro-zones along the powder laying direction corresponding to the two material regions are either increasing or decreasing without any regularity, which indicates that they are simultaneously affected by two harmful phenomena. The coupling of these two harmful phenomena results in irregular material composition results of EDS detection.
It should be note that the original TiNi powder exhibited a higher Ni/Ti ratio. However, Figures 10 to 13 reveal that the Ni/Ti ratio decreased in various regions after being formed into components. This is due to the molding process of each region was subjected to the same laser power, and the scanning speed was basically the same. The laser power of 150 W was employed in the experimental process, and the scanning speed were not more than 500 mm/s, which ensure that the melting point of tantalum can be melted up to 2996°C. The melting point of Ni is 1453°C and its boiling point is 2732°C. The melting point of Ti is 1668°C and its boiling point is 3287°C. As the melting and boiling points of Ni are lower than Ti, Ni is easily evaporated and ablated under the molding process parameters that can essentially melt tantalum, which results in the Ni/Ti ratio decreased in the formed specimen than in the powder.
Conclusion
The research goal of this paper is to solve the problem of separation and purification of non-ferromagnetic heterogeneous materials in the SLM molding process with the help of two non-ferromagnetic heterogeneous materials of TiNi/Ta. The SLM molding experiment of TiNi alloy with Ta coating and the analysis of composition of the experimental sample was conducted to verify the feasibility of the SLM fabrication of non-ferromagnetic heterogeneous materials. In this study, the separation and purification of two kinds of non-ferromagnetic heterogeneous materials were realized by ultrasonic rotary vibration sieving method, and the purified materials have high purity. Tantalum-containing coated TiNi alloy materials with gradient coatings were obtained through SLM molding experiment based on the principle of flexible cleaning of excess powder. This confirms that SLM fabrication of non-ferromagnetic heterogeneous materials is basically feasible. The detailed conclusions are as follows:
(1) The separation and purification of non-ferromagnetic micron scale mixed metal powders containing ultrafine powders can be achieved by using an ultrasonic rotary vibration screening machine. The separation and purification experiment of TiNi/Ta mixed powders shows that the purity of TiNi powder can reach 99.7087wt% after separation and purification, and the purity of Ta powder can reach 98.8501wt%, which are both of relatively high purity, and they can be used for SLM additive manufacturing experiments of Ta-TiNi composite material.
(2) Based on the principle of flexible cleaning of excess powder in the SLM process, non-ferromagnetic heterogeneous material sample can be obtained. The formed TiNi alloy sample with Ta gradient coating achieves metallurgical bonding, and the sample profile color shows a clear gradient transition. It has also been proven that along the powder laying direction and the material layer-by-layer stacking direction by EDS analysis: the material composition shows a Ta ->Ta/TiNi gradient ->TiNi variation, and the material composition gradually decreases in Ta content and increases in TiNi content from the outside to the inside of the sample.
(3) Along the direction of material layer-by-layer stacking, EDS analysis shows that the distribution of material composition is only affected by the actual supply of Ta powder which is less than expected due to poor fluidity of Ta powder used; the material composition is not contaminated in the Ta coating and TiNi matrix, but the Ta content is relatively low in the two gradient material regions.
(4) As the difficulty of removing the fine powder near the solid-powder interface or the solid-solid interface made of two different materials along the direction of powder laying, the material composition is also affected by these fine powder near the interfaces, which can easily form micro pollution areas.
Footnotes
Handling Editor: Chenhui Liang
Declaration of conflicting interests
The author(s) declared no potential conflicts of interest with respect to the research, authorship, and/or publication of this article.
Funding
The author(s) disclosed receipt of the following financial support for the research, authorship, and/or publication of this article: This work was supported by the National Natural Science Foundation of China (52073105), Guangdong Province Key Construction Discipline Research Capacity Enhancement Project (2022ZDJS051, 2021ZDJS070), Guangdong Provincial Natural Science Foundation project (2018A030313243), and the Shaoguan Science and Technology Projcect (230324098035163).