
Abstract
This work presents an experimental study aimed to determining the influence of the slide burnishing force on the surface roughness indicators (Ra, Rz, Rt, Rv, and Rp) and corrosion resistance on the advanced high strength steels TRIP-440Y and DP-330Y and the high strength steel HSLA-SP780. For each steel, the tests were carried out at different burnishing forces between 30 and 450 N, using a zig-zag burnishing toolpath with a 50% of the footprint width of the spherical tip as length between burnishing traces. The results showed that the optimal burnishing force to minimize surface roughness for HSLA-SP780, DP-330Y, and TRIP-440Y steels were 60, 150, and 180 N. These burnishing forces enhanced the roughness indicators between 40.3% and 73.4% for DP-330Y, from 57.5% to 83.2% for TRIP-440Y, and around 2.8% and 41.6% for HSLA-SP780. Corrosion tests exhibited that sliding burnishing does not affect the corrosion resistance of the steels, which are coated with a zinc layer. This result was confirmed by an X-ray diffraction analysis of the burnished samples. The corrosion current for all samples burnished and not burnished with zinc were close to 25 µA. Therefore, slide burnishing technique is an excellent option to improve the surface roughness without affecting the corrosion resistance of these steels, as well as other mechanical and physical properties that have been investigated according to the literature.
Introduction
During the last decade, minimizing the weight of the structural components has become one of the most important challenges for the automotive and aerospace industries. Reducing the environmental emissions of greenhouse gases such as CO2 and NOx as well as fulfilling with the strict legal requirements represents a constant challenge not only for the productive sector but also to the steel makers. Due to this, diverse industries have responded by using new types of materials such as the High Strength Steels (HSS) and Advanced High Strength Steel (AHSS), identified as an excellent candidates to reduce the density-to-strength ratio and accomplish with safety regulations to preserve the passenger’s life during impacts.
The hallmark of these materials lies in their complex multiphase microstructure characterized by a soft matrix composed of ferrite, bainite, and retained austenite (
However, structural components manufactured with thinner sheets usually between 0.4 and 1.8 mm thick are more susceptible to be affected by the corrosion effects when they are exposed to corrosive environments. Thus, corrosion protection in structural components is of main importance issue not only to preserve its appearance and functionality, but also to maintain the safety of the whole system by reducing the possibility of surface damage, reduced fatigue life, or crack initiation. Due to this, several authors have been focused on analyze the effect of heat treatment processes,8,9 layer coatings,10,11 or surface plastic deformation methods12–14 to prevent and/or slow down the corrosion of materials. From the former methods, slide burnishing has been one of the most analyzed cold-forming finishing processes used as a surface treatment technique for the manufacturing industry. Many investigations have shown his positive impact not only on the mechanical properties and surface quality in several types of materials, but also on the improvement of the corrosion resistance in metallic materials.
To mention Kovács et al. 14 analyzed the corrosion resistance of a C45 steel treated with a Magnetic Assisted Ball Burnishing (MABB); results showed that machining speed, surface roughness, and ball overlap have a significant effect on the corrosion rate. Prevey and Hornbach 15 studied the effect of the Shot Penning (SP) and Low Plasticity Burnishing (LPB) on the corrosion damage of aircraft aluminum alloy under fatigue loads; the corrosive environment was generated by an alternate immersion testing in neutral 3.5% weight NaCl solution at a constant temperature of 32°C to determine the pit depth as a function of time. The High Cycle Fatigue (HCF) test was conducted with a 30 Hz frequency and 0.1 stress ratio until a run out to specimen fracture or 1 × 10⁷ cycles. The experimental results show that LPB process improves the corrosion fatigue performance in relation with the SP process. Furthermore, LPB produces a deeper layer of compressive residual stresses that mitigate the crack initiation or pitting failure. Also, ball burnishing process has been implemented in materials with specific physical and mechanical properties as the magnesium alloys, typically used in medical applications.16,17 In both investigations, an enhancement on the corrosion resistance was reported, which is attributed to the grain refinement of the compressive layer.
Literature shows that burnishing methods in metallic materials have allowed an improvement in corrosion resistance. Tang et al. 18 reported that the cryogenic burnishing applied to the surface of Ti-6Al-4V titanium alloy allowed to decrease the surface roughness, refined grain structure, and enhanced the corrosion resistance. Results showed that the nanocrystalline layer with fine grains produced by the cryogenic burnishing on the surface of Ti-6Al-4V exhibits better corrosion resistance than the material that was not treated with burnishing with initial coarse-grained layer. Saldaña-Robles et al. 12 investigated the effect of burnishing on corrosion resistance of AISI 1045 steel using the polarization technique (Tafel) and electrochemical impedance spectroscopy (EIS). Results showed that burnishing process increase the corrosion resistance of the AISI 1045 steel. Cao et al. 16 investigated the impact of ball burnishing process on corrosion resistance of AZ31 Mg alloy. Findings revealed that the ball burnishing enhanced the corrosion resistance, this improvement is mainly attributed to the grain refinement on the surface of the material. Maximov et al. 19 evaluated the influence of the surface cold working carried out by Diamond Burnishing (DB) and heat treatment on surface integrity, corrosion resistance, and fatigue strength of AISI 304 austenitic stainless steel. The research evaluated two conditions: the material in its original state as hot-rolled bar and after being heat-treated at 1100°C for 1 h and cooled in water. After that, DB was applied alone and after DB with heat treatment at 350°C for 3 h. As a result, both DB and DB with heat treatment improved corrosion resistance for the two initial conditions. Sayadi et al. 20 studied the influence of vibration amplitude in the Ultrasonic-Assisted Burnishing (UAB) on roughness and corrosion resistance of AA7075-T6 aluminum alloy. As a result, the UAB process enhanced roughness and produced grain refinement. The UAB samples treated with a vibration amplitude of 10 µm exhibited the most favorable surface roughness with a minimal corrosion rate. Addressed conclusions show that an increase in vibration amplitude allowed to obtain finer grains but with an increase in surface roughness, causing a reduction in corrosion resistance.
Similar to the afore mentioned research, other studies demonstrate that the use of the appropriate burnishing parameters improves the corrosion resistance of different types of metallic materials, such as: A53 steel, X5XrNi 18-10 stainless steel, X6CrNiMoTi17-12-2 stainless steel, AZ31B Mg alloy, AISI 1017 carbon steel, 2024 aluminum alloy, and Mg-Al-Zn alloy.21–27 Literature shows that the improvement in corrosion resistance is mainly attributed to the enhancement in surface roughness, grain refinement, strongly basal-texture grain orientation, and the introduction of compressive residual stresses.
Although many properties of these advanced steels have been widely studied,18–20 nor has its corrosion mechanisms of zinc coatings on those steels been investigated, especially regarding to the plastic deformation processes, as the burnishing. To mention, Rao et al. 28 analyzed the effect of the Ball Burnishing (BB) on surface hardness of DP specimens. A Design of Experiments (DoE) including the feed speed, lubricant, and ball diameter was conducted. The results show the BB process can increase the surface hardness up to 60% with an adequate combination of feed, speed, and lubricant. Recently, Jerez-Mesa et al. 29 used the Ultrasonic Vibration Assisted Ball Burnishing (UVABB) process to analyze the superficial effects on TRIP steel 201LN type. The study was focused on analyze the UVABB effect on the surface quality and phase transformation of specimens with different content of martensite. Results show that UVABB process produce a severe plastic deformation that affects the surface quality increasing the mean roughness regarding to the initial surface. Furthermore, a deeper analysis that clarify the effect of the UVABB process on the grain refined surface layer is still necessary.
From the reviewed state of the art and technique, it is evident that still there is a lack of information and knowledge regarding to the influence of the burnishing process on the corrosion and surface quality on the families of HSS and AHSS materials. Specially regarding to experimental or numerical investigation that consider the interaction and response of the coating layer and the material. Therefore, the present investigation is aimed to conduct an experimental study to analyze the influence of the slide burnishing on surface roughness indicators, corrosion resistance, and coating layer on a High Strength Low Alloy (HSLA) sheet, a Dual Phase (DP), and a Transformation Induced Plasticity (TRIP) sheets. Results presented in this work will contribute to the better understanding of the slide burnishing on these materials to improve its performance during service life.
Experimental methodology
Materials
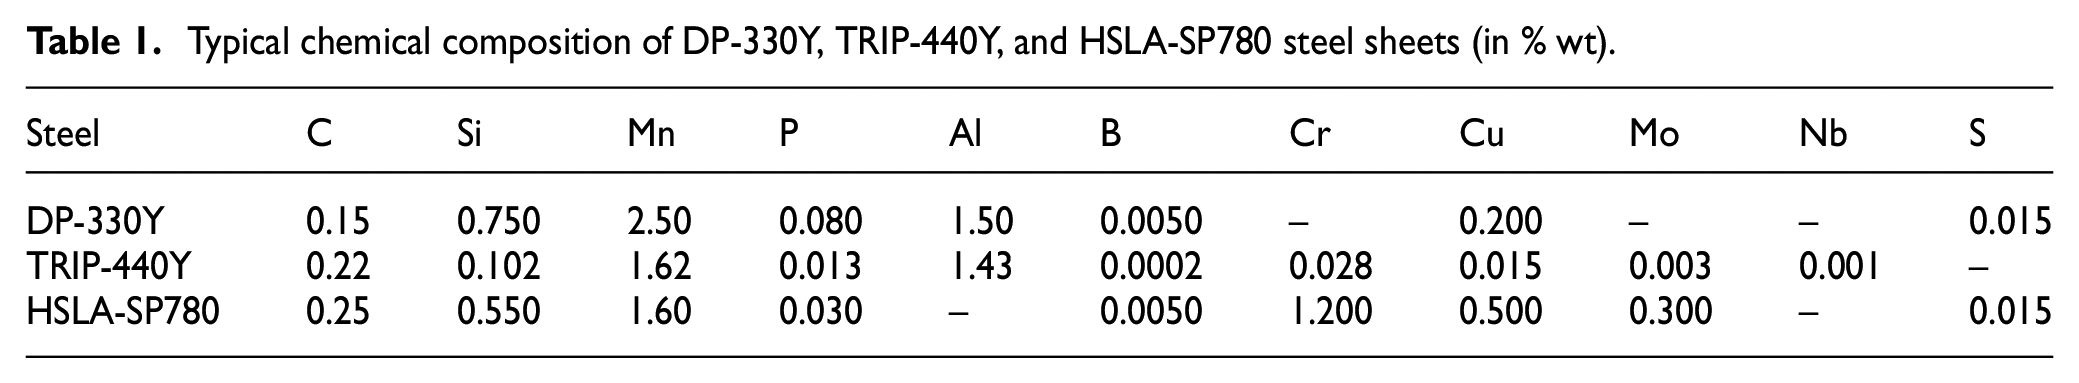
For the experimental study, two AHSS that is, a Dual Phase DP-330Y and a Transformation Induced Plasticity TRIP-400Y and one HSS type that is, a High Strength Low Alloy HSLA-SP780 were used in this work. Cold rolled sheets with a thickness of 0.8 mm for the DP-330Y, 1.1 mm for the TRIP-440Y, and 1.0 mm HSLA-SP780 were used for the sample’s preparation. Also, it is important to mention that as these materials are highly used in the manufacture of automotive components, were coated with a 60 microns zinc layer to protect the surface from the corrosive agents. Thus, its influence on the slide burnishing response and corrosion resistance is also analyzed and discussed. Table 1 indicates the typical chemical composition of these steels. From each steel, three rectangular specimens (20 mm wide and 130 mm long) were laser cut in the 0° from the rolling direction of the sheets.
Typical chemical composition of DP-330Y, TRIP-440Y, and HSLA-SP780 steel sheets (in % wt).
Burnishing procedure
Figure 1 shows the schematic of the slide burnishing process on the specimens. A rectangular mold was manufactured and fixed on the vise of a CNC vertical machining center of model Fadal VMC 3016C. This mold has a slot to contain the sample on X-Y plane, then is pressed to it by clamps to fix it in Z-axis. A slide burnishing tool with a diamond spherical-tip stem of 12.7 mm diameter was utilized to carry out the burnishing process. On each steel sample, three sections with areas of 225 mm2 (15 mm × 15 mm) were burnished. The experimental study was carried out in two steps. In a first step, each steel sample was burnished using a speed of 100 mm/min, dry condition and three burnishing forces of 150, 300, and 450 N, to evaluate the roughness parameters reduction for subsequent optimization of burnishing force. Also, to guarantee that the area was completely burnished, indentation tests were carried out to analyze the necessary depth and the resultant width of the spherical-tip footprint of the three burnishing forces. Subsequently, the burnishing toolpath was performed with a 50% of overlap from the footprint width of the spherical tip as length between traces, like the experiments conducted by Capilla-González et al. 30 This is schematically detailed in the Figure 2.

Schematic representation of the slide burnishing on the steel sheets.

Illustration of the overlap effect between traces of burnishing in relation to the deformation of the spherical tip.
From the roughness results of the first step, a second step to find the burnishing force that provides the minimum roughness in each material was conducted. The experimental study was extended using burnishing forces of 30, 60, 90, and 120 N for HSLA-SP780, while burnishing forces of 180, 210, 240, and 270 N were used for TRIP-440Y and DP-330Y. For these burnishing forces, the footprints were obtained through linear interpolation based on the data from the first experimental step. Table 2 summarizes the experimental conditions of the slide burnishing studied on the DP-330Y, TRIP-440Y, and HSLA-SP780 materials.
Experimental slide burnishing conditions on DP-330Y, TRIP-440Y, and HSLA-SP780.

Surface roughness
To improve the service life of an engineering component, it is essential to consider its surface, since failures related to corrosion and fatigue are originated from it, according Seemikeri et al. 31 The surface finish plays a vital role in enhancing the lifespan of industrial components, as it increases their resistance to fatigue, corrosion, wear, and creep. 32 The surface finish is defined by indicators of roughness, therefore, the initial and final surface finish of the sheets after the ball burnishing process were assessed by amplitude roughness indicators, that is, arithmetic average deviation of the roughness profile (Ra), average maximum height of the roughness profile (Rz), maximum height of the roughness profile (Rt), maximum peak height of the roughness profile (Rp), and the maximum valley depth of the roughness profile (Rv). These indicators were determined using a roughness meter Mitutoyo® surf test SJ-310 according to the ISO 4287 standard. For every sample, five measurements of each roughness indicator were recorded using a cut-off length of 0.8 mm, evaluation length of 4.8 mm, and measure speed of 0.5 mm/s.
Corrosion test and X-ray diffraction analysis
For the corrosion evaluation, a graphite disc electrode was employed as counter electrode. Finally, an Ag/AgCl 3 mol/L KCl reference electrode completed the cell. An aqueous solution of NaCl 3.5% in weight was used as electrolyte. A Versastat-3F potentiate was used, together with a homemade corrosion cell. The open-circuit potential (OCP, ASTM standard G3-14), where the total anodic current is equals the total cathodic current, was done by 1 h. Then, a cyclic polarization (CP) scan was made according to ASTM standard F2129-17b. The voltage was swept across a range, and it starts slightly cathodic of the open-circuit potential (−0.1 V vs OCP) until 1.2 V versus reference electrode, but then reversed back to the open-circuit potential. CP curves were recorded by using the VersaStudio corrosion test software. All samples were confronted to a control sample in the described study. In addition, the composition and structure of the Zinc layer were studied using Rigaku X-ray diffraction equipment. X-ray diffractograms (DRX) were recorded by using grazing incidence small angle X-ray scattering (GISAXS) at 1°.
Results and discussion
Surface roughness
Figure 3 show the results of the roughness indicators (Ra, Rz, Rt, Rv, and Rp) obtained in the steel sheets before and after the slide burnishing using burnishing forces between 30 and 450 N for the three materials. In addition, Figure 4 illustrates the initial roughness profiles and their usual roughness profiles after slide burnishing with burnishing forces of 150 and 300 N to DP-330Y, 180 and 300 N to TRIP-440Y, and 60 and 150 N to HSLA-SP780. In the slide burnishing process, the spherical-tip of the tool is pressed by the burnishing force and slides against the treated surface material causing a severe plastic deformation, which reduces the peak-to-valley height of the surface producing a smoother surface.33–35 However, there is an optimum burnishing force that will lead to the highest roughness reduction for each material, but an excessive high burnishing force can cause deterioration of the material surface finish.36–40 For DP-330Y material, the lowest result of Ra, Rz, Rt, and Rp indicators were obtained with the burnishing force of 150 N, while the Rv indicator decreased even more with an increase of the burnishing force. For the burnishing force of 150 N, the roughness indicators enhanced around 73.4%, 53.8%, 50.2%, 70.6%, and 40.3% for Ra, Rz, Rt, Rp, and Rv, respectively. For burnishing forces between 180 and 270 N, similar values of the roughness indicators were obtained to 150 N, but with higher energy consumption compared to the burnishing force of 150 N. Although for the burnishing forces of 300 and 450 N the roughness indicators are lower than the initial of steel sheet before burnishing, Figure 4(a)) shows that the plastic deformation produced by the burnishing force of 150 N caused a good smoothing of the profile asperities reducing roughness indicators (blue roughness profile), while a burnishing force of 300 N (red roughness profile) produced visible spherical-tip marks of the tool on the sheet surface due to the spherical tip penetration in the material surface, which caused the accumulation or stacking of material around the tool increasing the roughness indicators as compared to indicators at burnishing force of 150 N, showing a semicircular pattern of the marks formed. This effect is reported by Dzionk et al., 41 Silva-Álvarez et al., 13 Capilla-González et al., 30 and Cui et al. 42 Although this effect probably starts for the subsequent optimum burnishing force (150 N), which is the burnishing force of 180 N, the visually well-defined stacking phenomenon is observed up to a burnishing force of 300 N (Figure 4(a)).
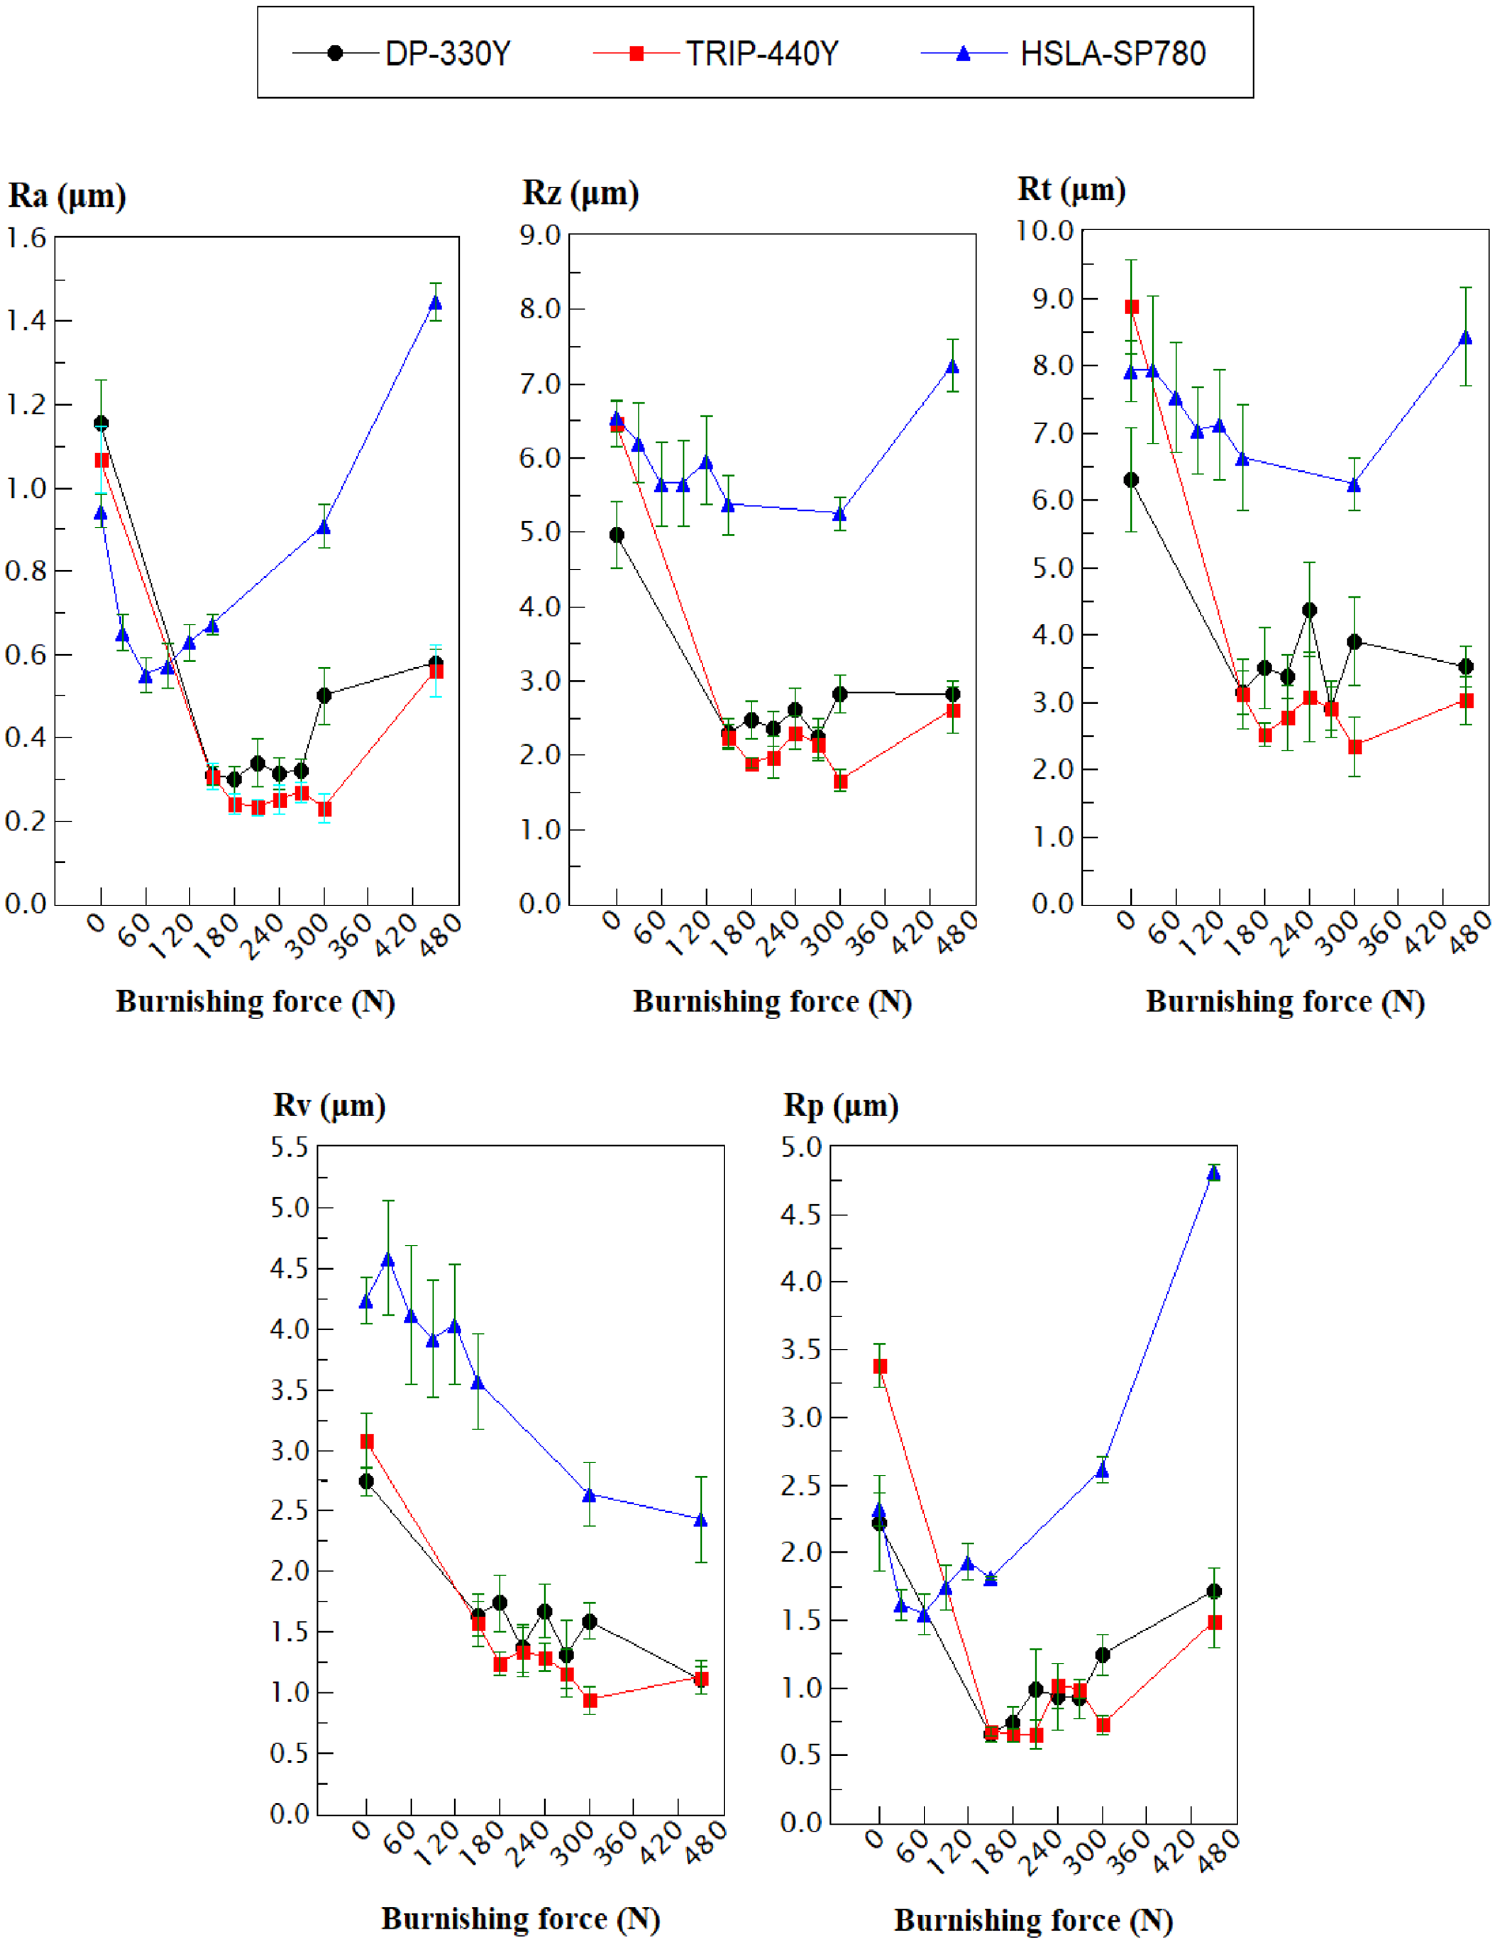
Roughness parameters obtained before (initial roughness of the steel sheets) and after slide burnishing at diverse burnishing forces for DP-330Y, TRIP-440Y, and HSLA-SP780 materials.
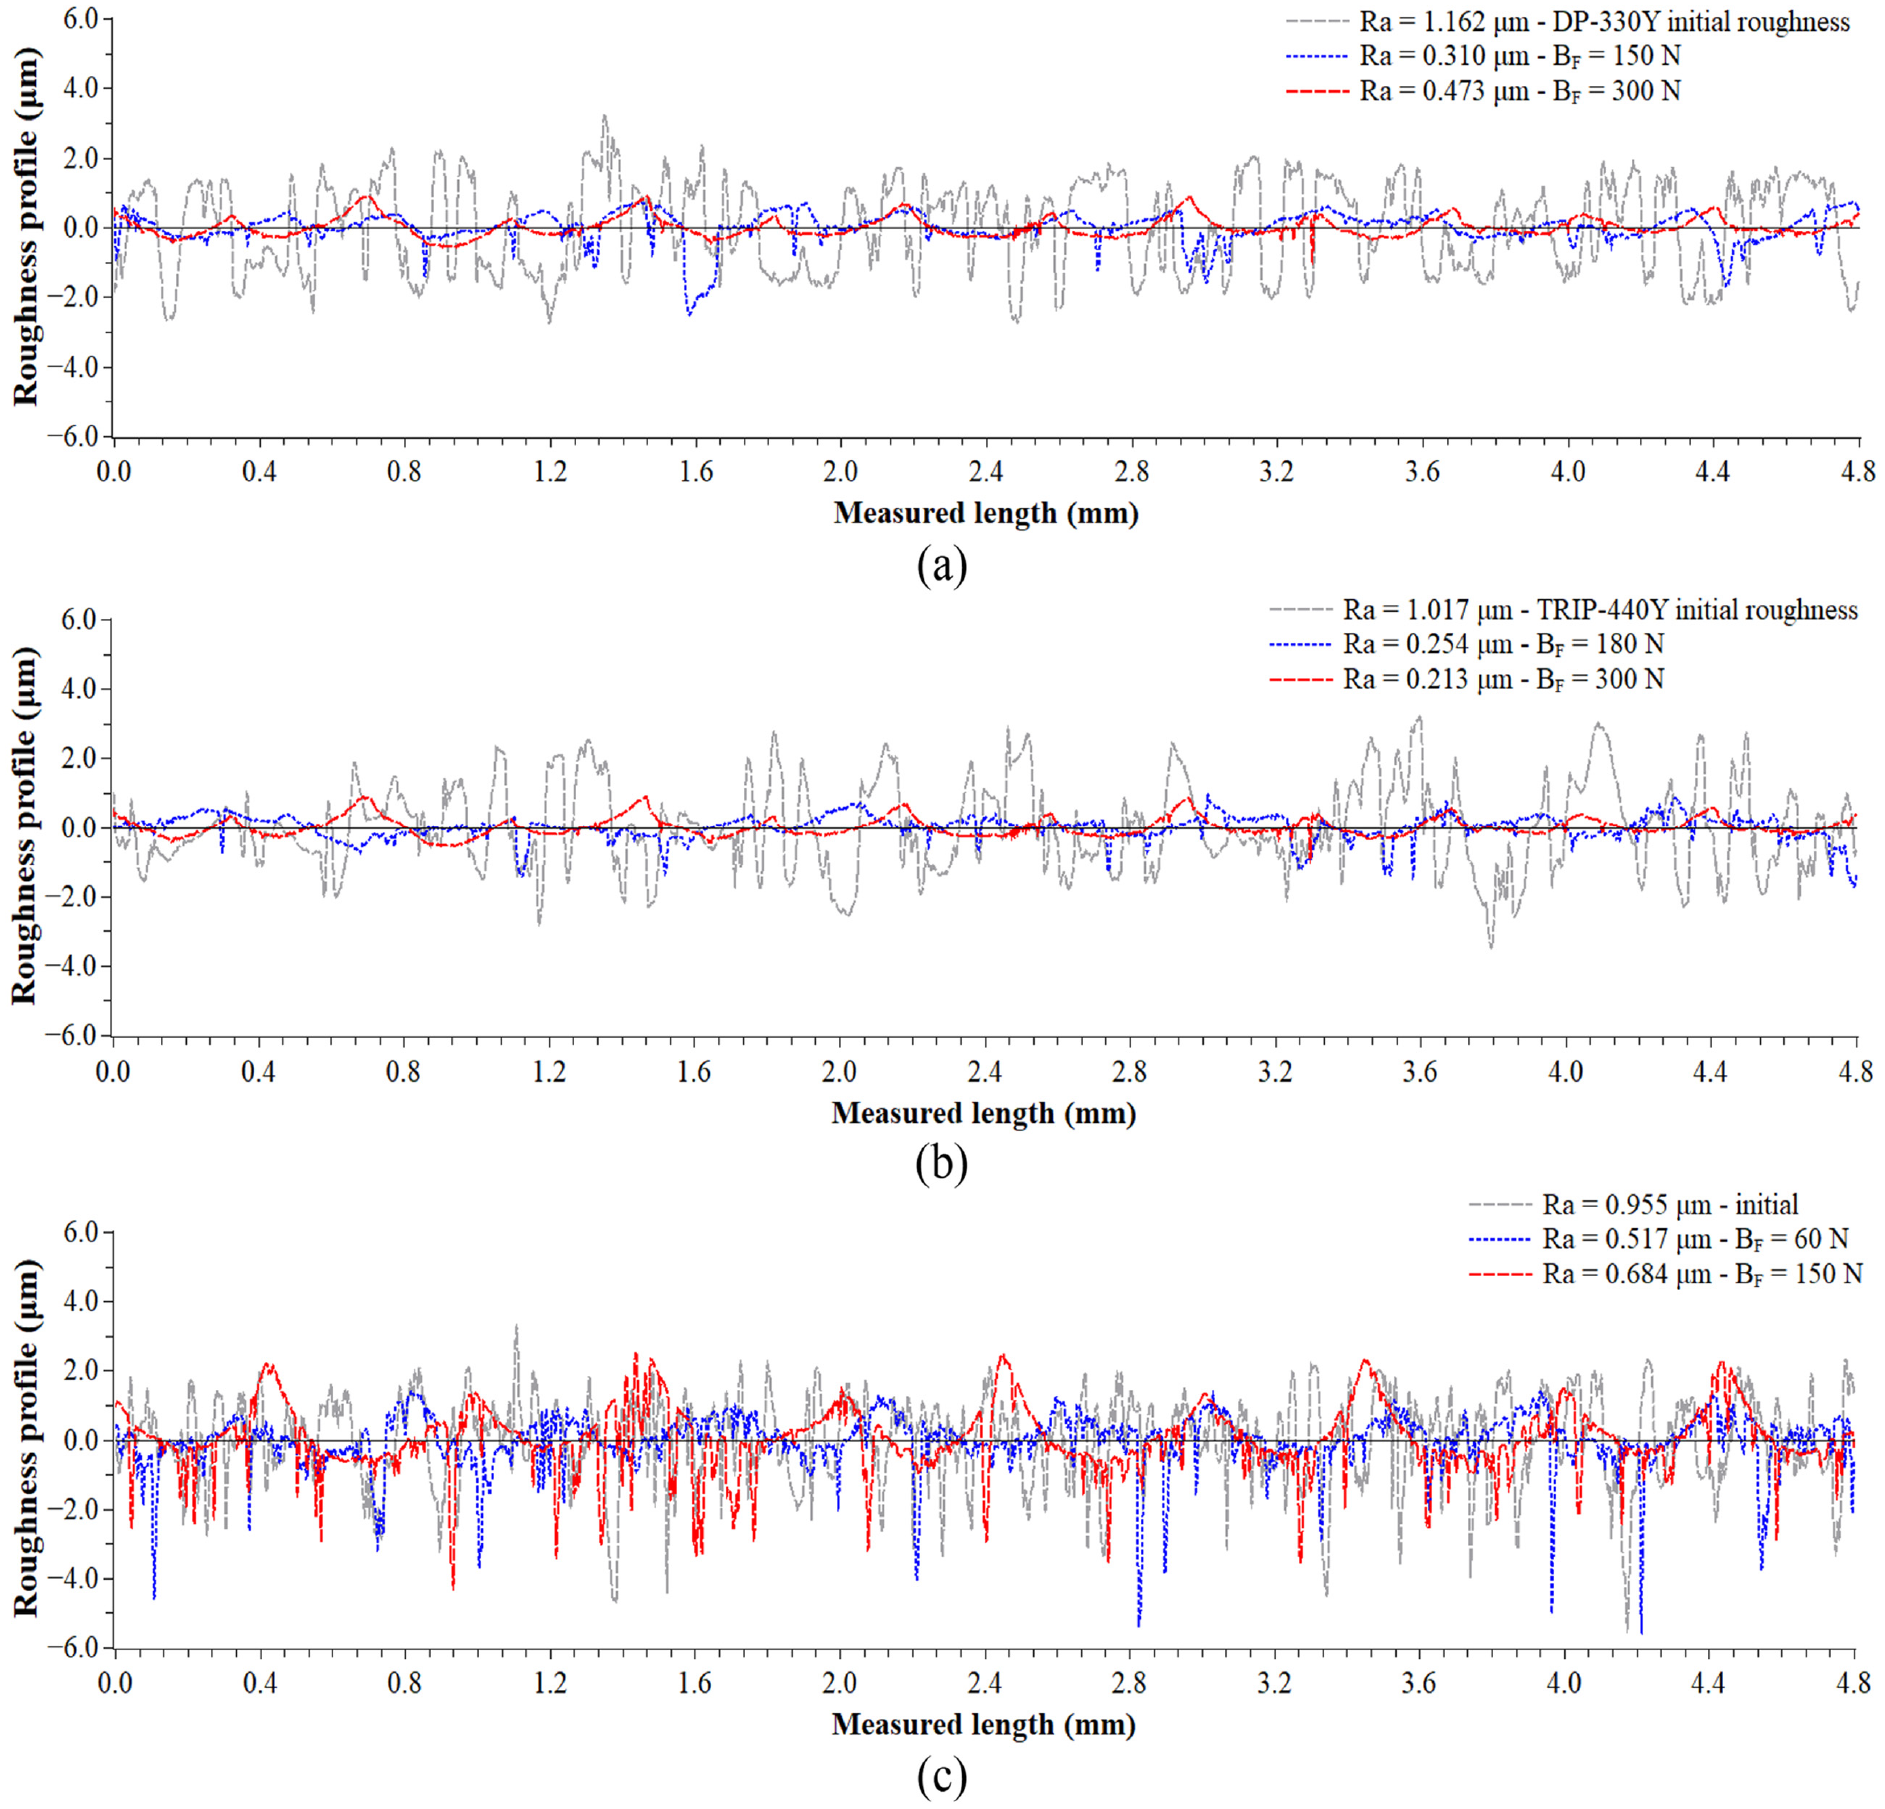
Roughness profiles before and after slide burnishing of: (a) DP-330Y, (b) TRIP-440Y, and (c) HSLA-SP780.
Similar to DP-330Y, the minimum roughness indicators for TRIP-440Y material were obtained for a burnishing force of 180 N, even though lower values of roughness indicators are exhibited between 210 and 300 N (Figure 3), at 300 N of burnishing force are already evident tool marks (Figure 4(b)), undesirable in the surface finish due severe plastic deformation. The improvement of the Ra, Rz, Rt, Rp, and Rv indicators for TRIP-440Y was approximately 82.0%, 71.0%, 71.8%, 83.2%, and 57.5%, respectively. For HSLA-SP780 material, a burnishing force of 60 N gives the lowest value of the roughness indicator Ra improving around of 41.6%. For this burnishing force, the other indicators improved about of 13.7%, 4.9%, 33.4%, and 2.8% for Rz, Rt, Rp, and Rv, respectively. In contrast to DP-330Y and TRIP-440Y materials, the HSLA-SP780 material exhibits tool marks on the sheet surface with burnishing forces starting from 150 N (Figure 4(c)), even the force of 450 N causes higher roughness indicators (with the exception of Rv) than the initial indicators of the steel sheet due to very high plastic deformation for this material, which has a lower yield strength compared to DP-330Y and TRIP-440Y. The aforementioned suggests that in order to obtain the lowest values of the roughness indicator Ra with the minimum burnishing force, the optimal force is 60, 150, and 180 N for HSLA-SP780, DP-330Y, and TRIP-440Y material.
Corrosion test and X-ray diffraction analysis
The properties of HSS steels as TRIP, DP, and HSLA have been widely studied for several authors,43,44 however the corrosion mechanisms of zinc coatings on this type of materials have not been investigated in detail. Due to the widely use of this materials during the last decade, the fully comprehension not only of the mechanical behavior but also of the physical and chemical properties is of main importance. Based on this, deep knowledge of the corrosion mechanism will provide specific information in order to improve the corrosion resistance.
To evaluate this, cyclic polarization measures the severity of galvanic corrosion between the zinc coating and the steel, the effectiveness of zinc protective coating, and the impact of burnishing surface treatment on the material’s corrosion resistance in a corrosive environment such as saltwater. In this sense, Figure 5 shows the polarization cycle for the TRIP-440Y sheet, where all scans for the burnished and unburnished zinc-coated samples are very similar (solid arrows). It is known that burnishing can improve corrosion resistance by generating compressive stresses on the surface. 44 However, since the curves of the non-burnished sample are very similar to those of the burnished one, it means that there was no improvement but also no worsening in terms of corrosion resistance. After starting the sweep (1), the tests show a corrosion potential close to −1 V (2) which corresponds to zinc coating. 45 It confirms, that the burnishing process does not damage the protection coating and maintains the galvanic protection function in the material. In this process, the zinc coating corrodes preferentially in the presence of saltwater, while the steel remains relatively unaffected. The inset in Figure 5, close to 10 mV (3), shows that the zinc coat was dissolved by corrosion, starting the corrosion in the steel (3). Since the zinc coating is no longer available after that point (3), the sweep corresponds to the corrosion in the steel without zinc (3–6); then the voltage scan inverts back until open circuit potential (6). Due to the dissolved zinc coating and the surface changes during the scan, the data (5) from the flyback voltage sweep no longer overlaps the data from the forward (2). Also, the potential change observed between the reverse scanning (5) and the control sample sweep (dashed arrows) is related to pitting corrosion. 45 This phenomenon occurs on metallic surfaces metal, typically in the form of small pits or cavities. It is characterized by the formation of small, deep holes or craters in the material. It is important to note that with the zinc coating (2), burnished and not burnished samples, the corrosion current (Ic) is about 25 μA compared to about 109 μA with the pitting surface (5).

Cyclic polarization plots for TRIP-440Y samples in NaCl 3.5%wt. solution.
Figure 6 confirms that DP-330Y and HSLA-SP780 samples have a similar behavior that TRIP-440Y specimens. While some authors have reported that slide burnishing provides several benefits as improving corrosion which can be attributed roughness, grain size, etc.13,20,21,24,26,27 The above results suggest that burnishing process applied over zinc coating does not show a significative variation on its corrosion resistance. Zinc is known for its high resistance to corrosion thanks to the formation of a protective layer of zinc oxide on its surface. Even though the surface may have been burnished, during the Open-Circuit Potential (OCP) process the protective layer quickly regenerates due to the continuous exposure of zinc to the electrolite. Hence, the corrosion resistance of zinc remains unchanged after being burnished. Also, all these suggest that burnishing process does not damage the zinc coating, however a deeper study to completely understand the corrosion phenomena is needed.

Cyclic polarization spectra obtained during the testing of: (a) DP-330Y and (b) HSLA-SP780 samples in NaCl 3.5%wt aqueous solution.
Figure 7 shows the X-ray diffraction patterns for DP-330Y, TRIP-440Y, and HSLA-SP780 specimens, both control samples and burnished samples at the optimal burnishing force. The positions of the diffraction peaks associated with the hexagonal crystal structure of zinc from the 96-901-2436 card of the Crystallography Open Database (COD). 46 XRD spectra were normalized with respect to the highest intensity peak (002). As can be seen, the peaks presented in the diffractograms are due to the diffraction from the (002), (100), (101), (012), (013), and (110) planes of zinc. The X-ray diffraction analysis corroborates that the layer is only composed of zinc for all the samples because there is a complete correspondence between the diffraction peaks and the database positions. The strong and sharp diffraction peaks observed suggest that layers are crystalline. A remarkable fact is that diffractograms are associated only with the hexagonal zinc, and the burnishing process does not damage the zinc layer.

X-ray diffraction patterns of control and burnished samples.
Conclusions
From the present investigation, the following conclusions can be addressed.
- The slide burnishing process do not damage the zinc coating layer deposited on the surface of the three materials, since the corrosion current for all the burnished and not burnished samples maintains a current value approximate to 25 µA.
- The slide burnishing technique significantly reduces all the roughness indicators. As a results, the average roughness (Ra), one of the most used indicators in the industry to evaluate the surface quality was reduced in 82% for the TRIP, 73.4% for the DP, and 41.6% for the HSLA steels. Optimal forces of 180, 150, and 60 N for each material, provided the better surface quality.
- The parameters used for the slide burnishing process does not modify the crystallographic structure of the material, as can be observed in the XRD results.
- High or low burnishing forces can be used without damage de coating layer. Hence, the selection of the appropriate force value will depend on the desired surface quality and mechanical response. Future works will be aimed to analyze the interaction experimentally and numerically between the coating layer and the material.
Footnotes
Handling Editor: Chenhui Liang
Declaration of conflicting interests
The author(s) declared no potential conflicts of interest with respect to the research, authorship, and/or publication of this article.
Funding
The author(s) disclosed receipt of the following financial support for the research, authorship, and/or publication of this article: This research work was not supported by any fund. However, the authors want to express their gratitude for the facilities provided by the University of Guanajuato.