
Abstract
The shape of the inlet duct and other factors cause distortion of the total pressure, leading to a decrease in engine stability. This article inserts flat plate into the inlet port of a certain type of aviation turbojet engine to conduct an inlet distortion test on the entire engine. The characteristics of entire flow field after inserting the board are obtained through experiments and numerical simulations, and it is concluded that the depth of the board is positively correlated with the reflux area and total pressure loss. The area of the insertion plate increase leads to an increase in the distortion index, and a decrease in engine flow rate. Meanwhile, angle plate device is designed to simulate inlet distortion caused by elevation takeoff. Summarize the relationship between the depth of the insertion plate and the intake distortion, a comprehensive distortion index simulation formula is fitted. The distortion simulation device designed by combining prediction formulas can achieve continuous adjustment of comprehensive distortion index 2%–13%, meeting the distortion index requirements for aircraft engine anti distortion testing. This device can replace complex intake systems to save test costs and cycles, and quickly and effectively carry out aircraft engine related distortion testing.
Introduction
The propulsion system plays a crucial role in modern fighter jets. During various maneuvers such as takeoff and dives are shown in Figure 1, fighter jets often experience high angles of attack and sideslip, which results in an uneven distribution of total pressure at the compressor inlet. This uneven distribution leads to inlet distortion, disrupting the engine’s normal design conditions, affecting the axisymmetric flow of the airflow, and causing severe corner separation. As a result, compressor stall and surge occur. Additionally, the circumferential distortion of the flow field results in uneven forces acting on the engine blades, leading to blade flutter and high-cycle fatigue. This poses a risk of blade fracture. Moreover, uneven intake causes total temperature distortion at the turbine inlet, leading to overtemperature in high-load aircraft engines that are already operating close to their temperature limit. This significantly affects the safe operation of the engine. Hence, addressing the surge and overtemperature issues caused by engine inlet distortion is necessary.1,2 The most serious distortion allowed by the engine in the working envelope and the influence of intake distortion on engine performance and surge margin, under specified conditions, the engine should be free from stall, surge, flame out, and any mechanical damage in the whole working envelope. 3 However, the s-shaped and y-shaped inlets and the maneuvering process will lead to uneven intake and affect the compression system Willis M et al. from NASA used a turbofan engine to study the influence of air jet on compressor performance, and compared the difference between simulation net and jet distortion, the total pressure distortion simulator is shown in Figure 2. Peng et al.4,5 results showed that within14km, the flight altitude had little influence on the comprehensive distortion index. The stable operating margin of the engine in the maximum cruising state and the maximum climbing state is obtained. When the inlet diameter of engine is less than 200 mm, the cavity effect is greater. Zhang et al. 6 used numerical simulation methods to analyze the main factors that affect the aerodynamic performance of a compressor under various operating conditions, and ultimately found that the circumferential non-uniformity at the inlet of the moving blade, the disturbance of tip leakage vortices caused by corner vortices, and changes in shock wave positions can change the stable boundary of the compressor. Zhou et al.7,8 found that axial and circumferential velocity distortions at the compressor inlet are the main reasons for the decrease in aerodynamic performance. During the simulation process using CFX software, a volume force model was added, which reasonably simplified the structure of the compressor model and effectively reduced the number of grids and calculation time. Li 9 summarized the relationship between surge margin, intake distortion, and flight angle of attack, and developed an airworthiness certification process for aircraft engine stall and surge.

J-10B post-stall maneuver (Cobra).

Total pressure distortion simulator.
In order to obtain the effect of inlet distortion on flow, researchers combined various measurement methods to measure the inlet duct field. Recently, Zachos et al., 10 Gil-Prieto et al., 11 and McLelland et al. 12 used the Stereo Particle Image Velocimetry (SPIV) method to observe the vortex field generated by two different S-shaped aircraft engine inlets, and obtained the steady-state and non-stationary flow characteristics inside these S-shaped inlets. For certain specific S-shaped pipelines, there is detailed information on their internal flow characteristics, but the number of such S-shaped pipelines is limited. The alternating generation of clockwise and counterclockwise vortices around the separation area results in a strong fluctuation state of velocity gradient on the aerodynamic surface plane. Traditional analysis methods seriously underestimate the level of vortex distortion, which poses a greater potential threat to the compressor.
Based on the insert plate pressure distortion generator, this paper chooses two kinds of research objects including the flat insert plate and the angled insert plate, studies the effect of the insert plates on the flow structures in the intake passages, analyzes the total pressure distribution downstream the plates, explores the influence of the shape and insertion depth of the plates on the flow in the intake passage, and thus provides guidance for the design and analysis of the aircraft engine inlet distortion test.
Research methods
Principle of inserted plate distortion test
Installing a plate in the intake duct where the airflow flows uniformly at high speed hinders the airflow flow, forming a low-speed low-pressure vortex zone behind the plate, resulting in intake distortion at the engine inlet position. The intake pressure distortion generated by this method is similar to the flow field at the aircraft inlet outlet during actual engine operation, and has the advantages of simplicity and efficiency in conducting aerodynamic stability evaluation tests for engines.
Testing scheme
During the experiment, the measured parameters mainly include engine intake flow rate, dynamic pressure, total pressure and static pressure of the pneumatic measurement section, and plate insertion depth.
The measurement section is shown in Figure 3. The 0-0 section is located at a distance of 2D before the insertion plate to measure the mass flow rate, total inlet pressure P0, and static pressure PS0, where D is the inlet diameter. The 1-1 section is a dynamic pressure measurement section used to measure the dynamic total pressure P1-1D of the 1-1 section. The AIP section is an aerodynamic measurement section located at a distance of 3D behind the insertion plate, mainly used to measure the steady-state total pressure PAIPW and wall static pressure PAIPJ at the engine inlet.

Schematic diagram of the measurement sections.
The measurement parameters of each section are shown in Table 1. The total inlet pressure P0 measurement of the engine adopts 4 × 4 layout, and the inlet static pressure is measured at 6 points. The dynamic pressure measurement is arranged at 6 × 1 points. The total pressure measurement of AIP section adopts 6 × 5 layout, and the static pressure measurement is arranged at 6 × 1 points, which meet the requirements for the parameter measurement of various aerodynamic sections of the intake passage.
The list of measurement parameters.

Intake pressure distortion is mainly obtained through the plate turbulence mode. The plate adopts hydraulic control, and its stroke meets the requirements of intake passage diameter. The withdrawal and insertion of the plate have high control precision, and there is the function of emergency withdrawal, which is linked to the surge signal, and the plate is withdrawn to restore the uniform intake state of the engine once if the surge occurs, insert plate pressure distortion generator device structure is shown in Figure 4.
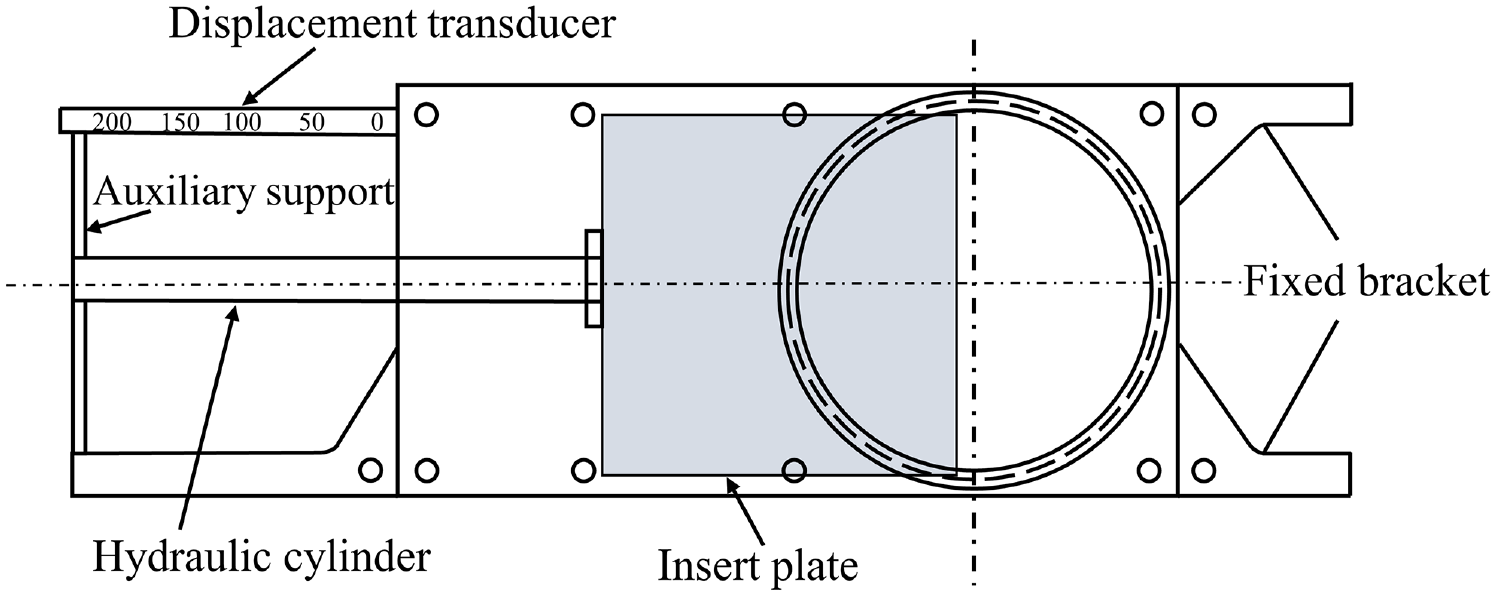
Insert plate pressure distortion generator.
Data processing method
The degree of total pressure distortion was measured by the synthetic distortion index method. The synthetic distortion index W was summed from the steady-state circumferential distortion index

Where

The low pressure area is shown in Figure 5. Where

Schematic diagram of the low pressure area.
In Figure 6,


The distribution range of the low pressure area.
Surface averaged distortion intensity


To sum up, the comprehensive distortion index W is:

Engine test run procedure
Before conducting the inlet plate distortion test, the static joint debugging of the engine and the test bench is carried out to ensure the normal interlocking function of the emergency plate retraction function and the surge signal.
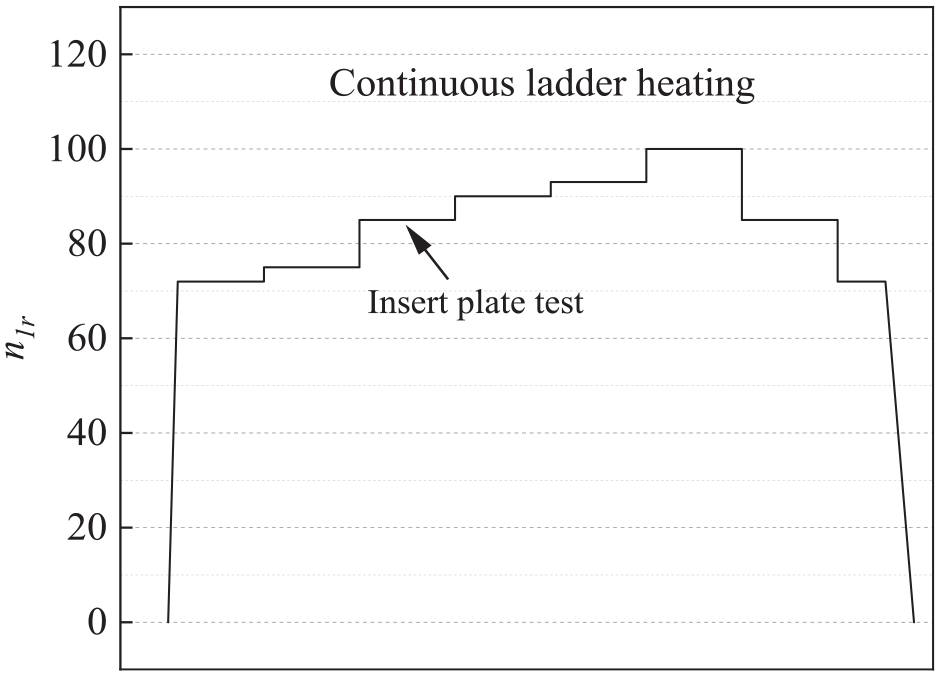
After completing the static joint debugging, perform an emergency board retraction function check at the low vehicle operating condition of the engine, and promptly retract the board to ensure the safety of the test when the board insertion causes engine surge. The entire intake panel distortion test process of the aviation engine adopts a climbing step form in the testing program is shown in Figure 7, and the intake distortion test is carried out under each step’s working condition. The advantage of this plan is that it can fully ensure the full warm-up state of the engine at high conditions and improve engine performance.13–15 After each engine test condition is stable, collect the required performance data of the engine under undistorted intake conditions using probes of each measurement section for 1 min, and then use a board insertion device to insert the board in a step of 0.05D. Conduct data collection at each target insertion depth, gradually retracting the required data into the board, and repeat the above test process for the engine to enter the next working condition.
Test run procedure.
Numerical methods
Establish a simulation model based on the aircraft engine distortion plate test bench. The calculation domain diameter is the engine inlet diameter D, which is extended by 5D before and after the insertion plate as the numerical simulation calculation domain to ensure the uniformity of inflow and outflow. The depth of the insertion plate is H, which is the ratio of the insertion depth to the inlet diameter. The modeling results are shown in Figure 8. The total temperature and pressure given at the inlet of the calculation domain are the ambient temperature and pressure. All walls are adiabatic and slip-free, and the outlet uses a pressure outlet. By adjusting the outlet pressure to match the engine intake flow rate, the actual operating conditions are obtained. The calculation model adopts the k-ω SST model, which is suitable for accurate prediction of reverse pressure gradient separation and simulation of shear flow. Unstructured grid is adopted for the calculation grid, and the grid near the insert plate and boundary layer is refined to ensure that the grid y+ of the boundary layer meets the calculation requirements, and the number of grids is set to more than 2 million.

Schematic of the computational domain.
Results and discussion
Analysis of flow structures in the intake passage
Comparison between numerical results and experimental results
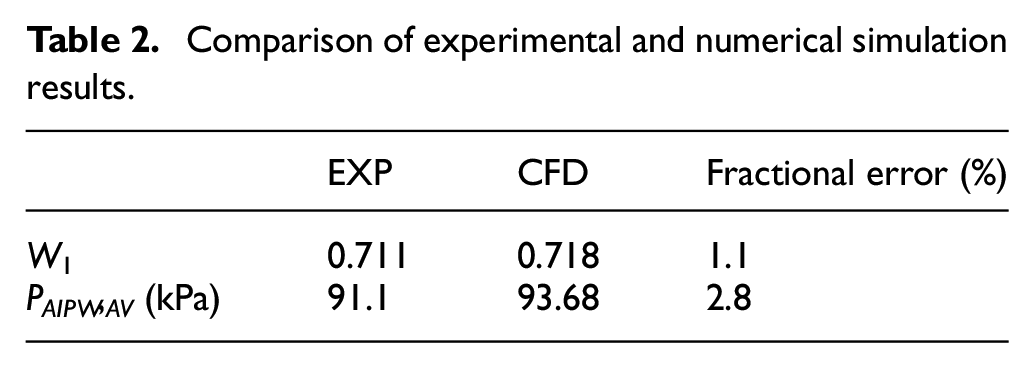
The comparison between the numerical simulation and experimental results of an engine operating under rated conditions of n1r = 100%, n1r = 85%, and a dimensionless intake flow rate of q = 0.711 was conducted. Figure 9 illustrates the total pressure distribution profile of the AIP cross-section. Upon analyzing the outcomes presented in Figure 9, it can be discerned that both numerical simulation and experimental data indicate the formation of a low-pressure zone subsequent to the insertion of the board. The shape and distribution of the low-pressure zone obtained from numerical simulation and experiments bear resemblance to one another, with values maintained at approximately 87 kPa, which signifies the high level of precision and accuracy of the flow field simulation.

Total pressure contours of AIP section: (a) CFD and (b) EXP.
Compared to the experimental results, the numerical simulation results exhibit a slight deviation of 1.1% in dimensionless flow rate and a total pressure deviation of 2.8% in the AIP section. However, the simulation deviation value adheres to the required calculation accuracy standard, and the data is presented in Table 2.
Comparison of experimental and numerical simulation results.
During the experiment, six 5-point measuring probes were utilized to obtain cross-sectional total pressure data for the AIP. Moreover, numerical simulation results were extracted from the same measurement point location, and then the total pressure values were compared in Figure 10. The experiment and simulation results indicate a consistent total pressure variation trend in the circumferential direction of the AIP cross-section. At the measurement point of PAIPW2, the maximum deviation value is 5.4%, while the total pressure deviation recorded in the low-pressure area is 2.4%. Based on the comparison between the simulation results and the experimental values for total pressure and flow parameters, it can be concluded that the simulation scheme adopted in this study is suitable for subsequent analysis and calculation, and the simulation results have sufficient accuracy for exploring the engine insert plate distortion.

Total pressure deviation of AIP section between experimental and numerical simulation results.
Overall flow structure analysis
To better comprehend the influence of insertion plates on engine intake and the principle behind causing intake distortion, a typical engine operating condition was selected for numerical simulation with n1r = 85% and dimensionless inlet flow rate of 0.711. A plate with a depth of h = 0.3 was inserted into the air inlet to analyze the flow structure after the insertion plate. Figure 11 illustrates the cross-sectional velocity cloud map and overall streamline map spaced at a diameter D after board insertion.

Velocity contours of each section and passage streamlines after the insert board.
From the figure, it is evident that the uniform upstream flow decreases in flow area after being obstructed by the insertion plate, resulting in the division of airflow into three streams. A portion of the fluid creates a small reflux zone in front of the insertion plate, which has minimal impact on the downstream flow of the insertion plate. Behind the insertion plate generates a strong and large area of low-speed reflux zone due to the obstruction, with reflux still occurring on the AIP section. Concurrently, the airflow velocity that is not obstructed by the insertion plate increases, leading to the formation of a high-speed zone as it bypasses the insertion plate. As the flow progresses, the airflow in this region gradually mixes with the mainstream due to mixing, causing the reflux vortex to gradually dissipate near 3D. Subsequently, the non-uniformity of the flow field at each cross-section along the flow direction diminishes gradually.
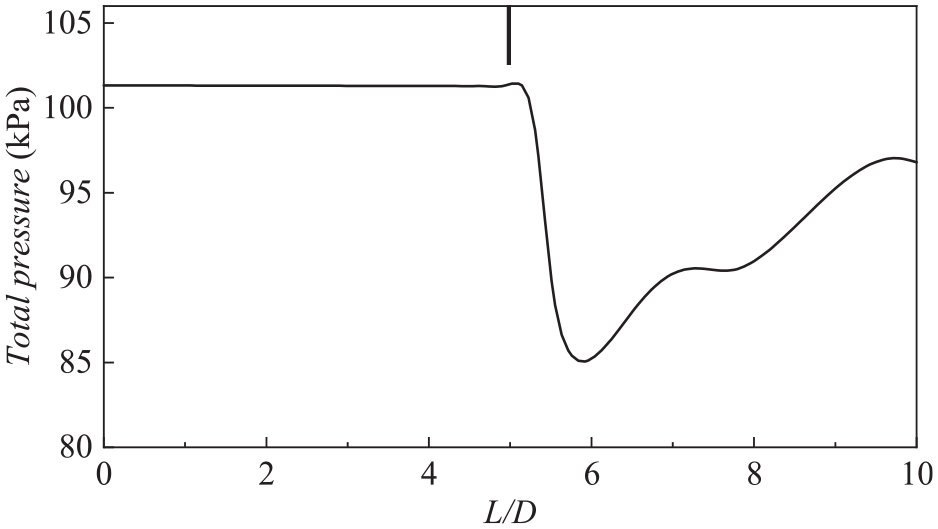
In Figures 12 and 13, the distribution of total pressure and Mach number along the axis of the inlet duct is displayed. Before the airflow is obstructed by the insert plate, the total pressure and velocity remain stable at the center axis position. At the location of the insert plate, the flow area decreases, and the mainstream velocity increases from 0.3 to 0.5 Ma. Due to the low-pressure zone formed by the vortex generated after the insert plate, the total pressure suddenly drops from 101 to 85 kPa. As the airflow continues to flow and develop, the range of the vortex decreases, and the total pressure begins to recover, gradually decreasing to approximately 0.3 Ma.
Total pressure variation along the central axis of the intake passage.

Mach number variation along the central axis of the intake passage.
In order to gain a comprehensive understanding of the main flow structure behind the insertion plate, we analyzed various parameters including total pressure, Mach number, streamline, and vector on the symmetrical plane of the air inlet. Figures 14 and 15 display this combined data. The presence of the plate causes the formation of an vortex current structure on the surface near the wall in front of the plate. This leads to a decrease in the effective flow area at the plate, resulting in a gradual acceleration of the air flow in the blocked area and the formation of a high-speed flow region. The flow loss in this area is small, and the total pressure remains largely consistent with the inlet total pressure. As the airflow bypasses the plate, there is a radial velocity component. This causes the flow area in the high-speed region behind the plate to initially decrease and then increase, resulting in a continuous acceleration of the airflow until it reaches a maximum speed of 0.5 Ma downstream of the simulated plate. The interaction between the airflow and the plate induces significant distortion in the flow. This leads to the formation of large low-speed vortices behind the plate, the velocity outside the vortex is significantly higher than inside. Throughout this flow process, viscosity effects on the wall, along with mixing and momentum transfer of the airflow, blur the boundary between high- and low-pressure areas. This also gradually reduces the non-uniformity of the total pressure along the flow section.

Total pressure contour and streamlines diagram around the plate.

Ma contour and streamlines behind the plate.
In Figure 16, the distribution of total pressure and Mach number at the inlet of the compressor, the AIP section, is presented. The figure clearly indicates that the impact of inserting the board at this position on flow is still quite significant. There is an obvious low pressure and low-velocity zone area in the corresponding area of the AIP cross section plate, where the flow non-uniformity is strong, leading to total pressure distortion The airflow in front of the simulated board generates stagnation points on its upstream surface. A portion of the airflow flows toward the pipe wall, causing corner vortices at the intersection of the pipe wall and the simulation plate to cause flow losses, and the corner vortex does not mix with other vortex structures. To determine the range of low-pressure and low-speed zones formed after inserting the board, the average pressure of each measuring rake is taken and arranged in a circumferential distribution order (Figure 17).

AIP section flow field parameters.

Identification of the low pressure area in the AIP section (test).
The processed measurement results reveal that the average total pressure in the AIP section is 91.1 kPa. Linear difference analysis indicates that the circumferential range of the main low-pressure area with values lower than the surface average is 180°–335°. The circumferential angle of the low-pressure zone is 155°, accounting for 43% of the entire AIP cross-sectional area. The average total pressure in the low-pressure zone is 87.8 kPa, which is significantly lower than the average total pressure in AIP, and the flow non-uniformity of this section is strong.
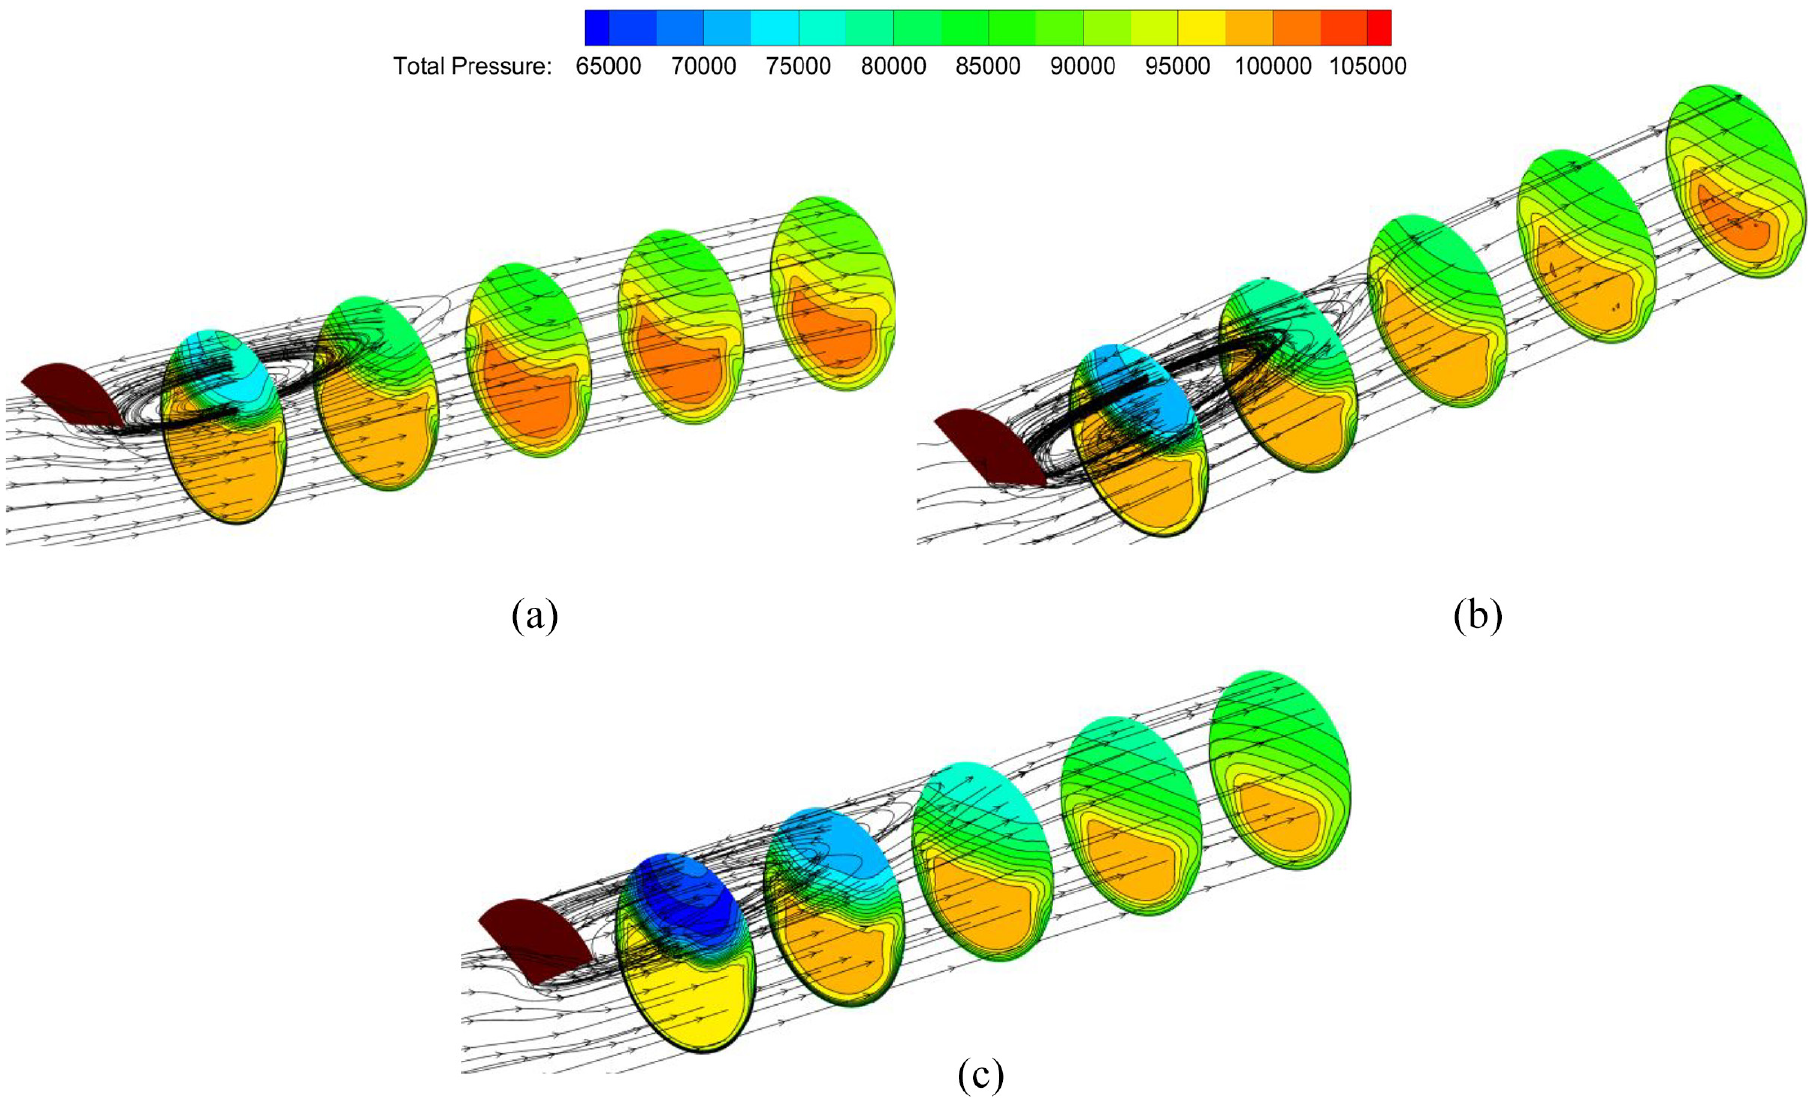
Effect of plate insert depth
When conducting distortion tests related to aircraft engines, it is necessary to conduct multiple control tests under different distortion intensity inflow conditions, and the intake conditions can be achieved by changing the depth of the insertion plate. Figure 18 shows the effect of insert depth on the inlet flow field under the working condition of n1r = 85%. According to the analysis of the total pressure distribution of the cross-section with a distance of D from the insertion plate position to the outlet channel, an increase in the insertion plate depth leads to an increase in the reflux area, a decrease in the total pressure in the reflux zone, and a gradual increase in the total pressure loss. When H = 0.2, the main influence area of the reflux range is within the range of 1.5D after the board; When H = 0.3, the span of the reflux area is 3D; When H = 0.35, the span of the reflux area is 3.5D.

The flow fields behind the plate under different plate depths: (a) H = 0.2, (b) H = 0.3, and (c) H = 0.35.
Figure 19 illustrates the changes observed in the total pressure of the AIP section when n1r = 85%. As the depth of the plate increases, the low-pressure area of the AIP section expands, which leads to a continuous rise in the total pressure in the unaffected area under throttling. Additionally, the average total pressure of the AIP section at depths of H = 0.2, 0.3, and 0.35 is 88.4, 84.8, and 82.3 kPa, respectively. This value decreases as the depth of the plate increases, whereas the total pressure loss of the AIP section increases in relation to the depth of the plate.

Total pressure contours of AIP section (n1R = 85%) under different insertion depths: (a) H = 0.2, (b) H = 0.3, and (c) H = 0.35.
Figures 20 and 21 show the pressure and velocity changes along the central axis under different insertion depths, respectively. As the depth of the insertion plate increases, the flow area of the flow channel decreases, and the speed at the insertion plate position increases. When the insertion depth of the plate is H = 0.3 and H = 0.35, the larger reflux area after insertion affects the position of the central axis, resulting in a velocity lower than the inflow velocity and a significant decrease in total pressure. As the reflux zone is mixed with the mainstream, its strength and influence range decrease, the total pressure gradually increases and the speed changes tend to stabilize. The backflow area formed by the plate with H = 0.2 has little effect on the central axis, and the time for its speed to recover to the inlet speed is significantly shorter than that of other plate conditions.

Total pressure variation along the central axis under different insertion depths.

Velocity variation along the central axis under different insertion depths.
The plate distortion test is conducted under the n1r = 85% operating condition, with the hydraulic rod being used to change the depth of the intake insert by 0.05 during each trial. Eight sets of experiments with H = 0–0.35 are conducted. Data from the six circumferential probes of the AIP section were collected and processed, resulting in the circumferential total pressure change shown in Figure 22. At H < 0.2, the circumferential total pressure distribution was relatively uniform, with small total pressure losses, and the backflow region formed by the insert had little effect on the flow over the AIP surface. As H increased, the total pressure at PAIP4, PAIP5, and PAIP6 located behind the insert decreased significantly, with rapid increases observed for the total pressure loss and distortion index. Parameter fittings were performed for the relationship between total pressure at each measurement point and insert depth, yielding the formula shown in the figure. This empirical formula may be used to predict the circumferential total pressure and pressure loss in future insert distortion experiments.

Influence of plate depth on the low-pressure area distribution (test).
Figure 23 depicts the variation of AIP section distortion index, flow rate, and surface average total pressure coefficient of restitution with the insertion plate depth, under the working condition of n1r = 90%. The distortion index exhibits an increasing trend as the plate depth H increases. For H values less than 0.25, the average surface turbulence intensity is the primary contributing factor in the development of inlet distortion. However, for H values exceeding 0.25, the steady-state circumferential distortion index surpasses the average surface turbulence density in its effect. As the plate depth increases, the intake flow of the engine decreases, resulting in a decrease in the coefficient of restitution of the surface average total pressure.

Influence of plate depth on the comprehensive distortion index.
Principle of distortion with different plate depths and engine states
Figure 24 shows the relationship between the comprehensive distortion index and plate depth under different engine speed conditions. The comprehensive distortion index and plate depth show a positive correlation under all compressor operating conditions. When the engine speed increases, the inlet flow rate and flow velocity increase, and the total pressure loss and total pressure non-uniformity caused by the same insertion plate increase. In order to achieve the comprehensive distortion index of the target, the optimal plate depth needs to be adjusted according to changes in engine speed. For instance, at an engine speed of n1r = 72%, the optimum plate depth is 0.5, while at n1r = 97%, the ideal plate depth reduces to 0.25. These findings emphasize the importance of considering engine speed when determining the optimal plate depth to achieve the compressor’s comprehensive distortion index as close as possible to the expected target. In this study, the impact of changes in plate parameters on the engine was investigated using a complete aircraft engine test bench. A distortion simulation device is designed to continuously change the inlet distortion. The collected data from dynamic and static measurement systems are used to analyze the relationship between speed, flow rate, AIP cross-sectional parameters, and distortion index. Compare to other scholars’ research, the research results obtained through whole machine experiments get closer resemble the actual engine operation under distorted inlet conditions. The combination of experiments and simulations provides a more comprehensive analysis of the inlet distortion process caused by distortion devices. The summarized distortion prediction formula more accurately reflects the relationship between plate depth and distortion index, and can be directly applied to subsequent related distortion experiments.

Principle of distortion with the depth of the plate and the engine state.
Influence of angle dplate on the flow field
Effect of plate shape on the flow field
In order to simulate different forms of intake distortion under various operating conditions of the engine, modifications are made to the planar insert plate. In order to obtain the actual inlet distortion pattern of aircraft engines during elevation takeoff maneuvers, a plate structure design is implemented. This design is based on the research findings of plate distortion insertion mentioned in the “Stability Margin Inspection and Selection Guide for Aviation Power Units” developed by Russia. Finally, a diagonal plate with a top angle of 150° is selected as the angle plate and compared to the original flat plate (Figure 25). The insertion depth of the angle plate is defined as the shortest distance from the top corner of the plate to the edge of the intake pipe.

Flat insert plate and angled insert plate.
In this study, an experimental investigation is carried out on an angled plate insert into a flow passage under the operating conditions of n1r = 90% and H = 0.3. The non-dimensional flow rate for the experiment is found to be 0.893. The results obtain from numerical simulations indicated that the outlet flow rate is 0.883, which is consistent with the experimental data. Figure 26 shows the streamline and total pressure distribution behind the angled plate. The flow field behind the angled plate is similar to that behind the flat plate, with a low-pressure recirculation zone formed after the plate insertion. Due to the same depth of the plate at the top corner, the radial range of the vortex zone behind the plate is the same as that behind the plate. However, the blockage area of the angled plate is smaller than that of the flat plate under the same plate depth conditions, resulting in a relatively small effect on the flow. The recirculation area behind the angled plate is only 2.5D, smaller than that behind the flat plate. This led to a smaller total pressure loss, resulting in a higher low-pressure zone pressure behind the angled plate compared to the flat plate under the same conditions.
Flow field downstream of insert plate at different angles: (a) 150°, (b) 135°, and (c) 120°.
An angled shaped plate insertion test was conducted at a speed of n1r = 90% and an insertion depth of H = 0.3, with a dimensionless intake flow rate of 0.893. The outlet flow rate obtained through numerical simulation is 0.883, which deviates from the experimental value is required. Figure 26 shows the streamline and total pressure distribution behind the angled plate. The flow field behind the angled plate is similar to that of a flat plate, both of which form a low-pressure reflux zone after inserting the plate. Due to the same depth of insertion at the top corner as the flat plate, the radial range of the vortex zone after insertion is the same. However, under the condition of the same insertion depth, the blocking area of the angled plate is smaller than that of the flat insertion plate, and the impact on the airflow flow is relatively small. The reflux area after the angled plate is only 2.5D smaller than that of the flat plate, and the total pressure loss of the inserted plate is smaller, resulting in a significantly higher pressure in the low-pressure area of the angled plate under the same state than the flat plate. Under the condition that the intersection area between the plate and the inlet wall remains unchanged, it can be observed that as the plate angle decreases, the blocking area of the plate to flow increases. This leads to an increase in the area of the backflow zone after the plate, and significant backflow is still present in the AIP section of the 120° angle plate. Additionally, the total pressure in the low-pressure zone after the plate further decreases, and the non-uniformity of flow in each section increases. Simultaneously, the change in plate shape weakens the airflow toward the pipe wall, resulting in a smaller corner vortex structure at the intersection of the pipe wall and the simulated plate.
Figure 27 shows the streamline and Ma distribution of the symmetric cross-section of the angle plate. The total pressure trend of the AIP section of the angled insert plate is shown in Figure 28. From the figure, it can be seen that the airflow passes through different angle plates and forms three flow zones: low-speed reflux zone, high-speed zone, and transition zone. With the increase of the plate insertion depth, the flow area decreases significantly, and the velocity in the high-speed area increases. In this process, the larger velocity gradient leads to more flow losses. The velocity difference between high speed zone and low speed zone increases, and the flow loss caused by air mixing and momentum transfer increases in the flow process. As the angle between the angle plates decreases, the non-uniformity of flow increases, resulting in stronger velocity and pressure distortions, and different types of distortion patterns are obtained through different angle plates.

Flow field downstream of insert plate at different angles: (a) 150°, (b) 135°, and (c) 120°.

The total pressure trend of the AIP section of the angled insert plate.
Study on the pressure distortion index of angled insert plate
To analyze the relationship between the depth of the angled insert plate and the distortion index, the insert plate distortion test was conducted under the engine condition of n1r = 90. The depth of the insertion board gradually increases from 0 to 0.48, and the comprehensive distortion index obtained after data processing is shown in Figure 29. It can be seen that there is a positive correlation between the insertion depth of differently shaped insertion plates and the comprehensive distortion index. By fitting the experimental parameters in the state of n2r = 90%, the formulas W = 152.3H2 − 9.23H +2.36, W = 87.94H2 − 4.976H + 1.06 are obtained. The deviation between this formula and the test point is less than 5% when H is greater than 0.2. The above formula can be used to predict the distortion index in subsequent engine distortion tests.

Experimental distortion indexes of the two plates at n1r = 90%.
Analyze the phenomenon of total pressure distortion in the inlet duct at H = 0. From Table 3, it can be seen that the steady-state circumferential distortion index values of the two types of plate-in boards are small and not significantly different, both less than 0.3%, which is not the reason for the formation of intake distortion. However, the difference in surface average turbulence intensity is close to 1%, and it is far greater than the steady-state circumferential distortion index, indicating that surface average turbulence is the main factor affecting the comprehensive distortion index. This phenomenon is due to the presence of a cavity effect in the plate-in device installed in the inlet, where the airflow is disturbed at the edges of the cavity and inlet, resulting in distortion of the inlet flow field.
Comparison of distortion index between the two types of insert plates at H = 0.

Conclusions
In this paper, the intake pressure distortion tests and numerical simulations of aeroengine insert plate are carried out, and the flow field behind the plate is studied, the influences of the depth and shape of the insert plate on the flow field behind the plate and the intake distortion are figured out. The following conclusions are drawn:
The numerical simulation and experimental results of the plates in aviation engines show strong consistency, which can be used for analyzing the intake flow field. The increase in insertion depth H leads to a larger reflux zone, an increase in air flow rate and total pressure loss. As the airflow develops, the total pressure and flow rate gradually stabilize.
The engine speed and insertion depth are positively correlated with the pressure distortion index of the AIP cross-section. When the insertion height H < 0.27, the average turbulence intensity on the surface is the main factor causing inlet distortion. As the insertion height increases, the steady-state circumferential distortion index is the main factor causing inlet distortion. Based on the summary of research results, the relationship between the insertion height H of the AIP cross-section and the circumferential total pressure was obtained. This relationship can achieve rapid prediction of the total pressure distribution and pressure loss on the AIP surface.
The flow field behind the angled plate is similar to that of the flat plate, but the total pressure loss and reflux area caused by the angled plate are significantly smaller than those of the flat plate, and the comprehensive distortion index is also smaller. An equation for predicting the comprehensive distortion index at different insertion depths is obtained by fitting the data.
After experimental verification, the designed distortion simulation device flat plate can achieve continuous adjustment of steady-state circumferential distortion index 0.3%–7% and comprehensive distortion index 2%–13%. After installing the corner plate, different distortion patterns can be obtained. The combination of inductive prediction formulas can solve the problems of high cost and long cycle in distortion testing of aviation engine intake ports. The research process and design concept presented in this study could serve as a valuable reference for distortion testing in various other fields.
Footnotes
Appendix
Handling Editor: Chenhui Liang
Declaration of conflicting interests
The author(s) declared no potential conflicts of interest with respect to the research, authorship, and/or publication of this article.
Funding
The author(s) disclosed receipt of the following financial support for the research, authorship, and/or publication of this article: The work of this paper is completed with the support of the National Major Science and Technology Projects of China (J2019-III-0017), National Natural Science Foundation of China (No. 52101348), Fundamental Research Funds for the Central Universities (No. 3072022JC0301), and I would like to express my sincere gratitude.