
Abstract
Population growth and economic development, particularly in developing market nations, are driving up global energy consumption at an alarming rate. Despite increased wealth, growing demand presents new obstacles. Computer Numerical Control (CNC) machine tools are widely used in most metal machining processes due to their efficiency and repeatability in achieving high-precision machining. It has been shown that figuring out the best cutting parameters can improve the results of machining, leading to high efficiency and low costs. This study identifies and examines thoroughly the scientific contributions of the influence of strategies, machining sequences, and cutting parameters on surface quality, machining cost, and energy consumption (QCE) using artificial intelligence (ANN and ANFIS). The results show that the 3.10−3 architecture with the Bayesian Regularization (BR) algorithm is the optimal neural architecture that yields an overall mean square error (MSE) of 2.74 10−3. The correlation coefficients (R2) for Etot, Ctot, and Ra are 0.9992, 1, and 0.9117 respectively. Similarly, for the adaptive neuro-fuzzy inference system (ANFIS), the optimal structure which gives a better error and better correlation is the {2, 2, 2} structure, and this for the three output variables (Etot, Ctot, and Ra). The correlation coefficient (R2) for the variables Etot, Ctot, and Ra are respectively 0.95, 0.965, and 0.968. The results show that the use of the Bayesian Regularization algorithm with a multi-criteria output response can give good results when compared with the adaptive neuro-fuzzy inference system.
Introduction
The manufacturing sector is one of the world’s largest consumers of electrical energy. With the increase in the cost of energy and the associated carbon emissions, reducing energy demand has become an urgent challenge for manufacturers in recent years. The machine tool consumes a great deal of electrical energy. With the aim of reducing energy consumption and cost in CNC machining, the selection of optimal machining strategies and cutting parameters is considered one of the most important saving policies. The use of new prediction and optimization techniques with artificial intelligence technology can positively contribute to this economic policy. Several researchers have used artificial intelligence tools to solve prediction and optimization problems in mechanical manufacturing. Kant and Sangwan 1 used the neural network to predict energy consumption and surface roughness. They performed machining experiments to verify the suitability of the proposed model for predicting energy consumption and surface roughness. The results predicted by the proposed model indicate a good synchronism between the predicted values and the values. Eser et al. 2 studied the milling surface roughness (Ra) of Alloy AA6061. An experimental model has been improved to assess surface quality using response surface methodology (RSM) and artificial neural networks (ANN).
In mechanical manufacturing, machine tools consume energy that can reach critical values. Improving the energy efficiency of machine tools can lead to a significant reduction in the cost of products. Research on reducing energy consumption is still insufficient in view of the increasing use of energy sources. 3 For example, Guo et al. 4 presented an approach that integrates both surface roughness and energy consumption to optimize cutting parameters during turning. Aramcharoen and Mativenga 5 studied how different tool paths can influence the direct energy demand in machining. Therefore, they suggested a way to drastically reduce the energy intensity at the level of material removal. Experimentation demonstrates that the energy consumption of the unidirectional method for the y axis, about 230 kWh, is more than that of the parallel contour, 120 kWh. Li et al. 6 carried out a set of experiments to demonstrate the performance of operational strategies in the milling process. The authors used five tool path strategies in this process namely: bidirectional along x, parallel contour, bidirectional along y, bidirectional at an angle of 45°, and spiral contour. The results showed, that the maximum specific energy consumed (SEC) is given by the strategy of the spiral contour (87 J/mm3). On the other hand, the minimum energy is given by the bidirectional strategy along x (53.1 J/mm3).
Few researchers have evaluated optimal cutting conditions based on minimum cost during the manufacturing process. For example, Li et al. 7 studied multi-pass milling face milling. Next, used multi-objective optimization to maximize energy efficiency and minimize production costs by the adaptive multi-objective particle swarm. The results showed that increasing cutting speed, depth of cut, and feed rate simultaneously reduced production time and cost. To achieve energy-saving and low cost of CNC machining, Xiao et al. 8 used a multi-objective optimization approach by integrating the APSO particle swarm optimization algorithm and the improved genetic algorithm NSGA-II. Experimental results have shown that the multi-objective optimizations model is feasible and efficient and that it can effectively help operators balance energy consumption and manufacturing costs.
Optimizing this process has become a primary stake to reach higher productivity and quality. To optimize process planning, it is important to select a suitable machining strategy. 9 The main objective of this research is to provide a multi-criteria help tool for determining the optimal machining process by integrating the factors: Quality, Cost, and Energy (QCE).
The inventory of the main works of research on the optimization of the machining process shows the wide variety of tools and parameters that can influence this process. The studies presented in this bibliographic research are mainly devoted to the definition of simple machining entities (facing, pocket, etc.). On the other hand, most of these studies use some strategies without taking into account the machining ranges (sequences). It was also found that the influence of machining strategies and sequences on the manufacturing cost is non-existent in all previous studies. Finally, there is no study or model that takes into account cutting parameters, strategies, and machining ranges at the same time for the modeling and optimization of surface quality Ra, machining cost Ctot, and energy Etot consumed (QCE) of numerically controlled machine tools to machine interacting entities using artificial neural networks (ANN) and adaptive neuro-fuzzy inference system (ANFIS), which will be the subject of this article.
Experimental methods
The main objective of manufacturing industries is to minimize the cost of the finished product as much as possible while maintaining the superior quality of the product. Today, energy consumption has become the main factor that directly influences the cost of machining. Faced with this problem, it is necessary to minimize the energy consumption of machine tools in the machining process. This minimization cannot be obtained without knowing all the machining strategies. The problem gets a bit more complicated when we talk about interacting machining features. A machining strategy is a methodology used to generate a series of operations to produce a given shape. The choice of these strategies will be to achieve well-determined specifications and shapes. In this context, three machining strategies have been chosen (zigzag, zig, and Inward parallel contour), Figure 1(a).

Machining: (a) strategies and (b) features.
In this part, the case of pocket/groove features has been studied by illustrating the effects of the planning of machining sequences, machining strategies, and cutting parameters on the surface quality, manufacturing cost, and energy. Figure 1(b) presents the machining features associated with the selected part. In order to make this part, the machining features will be used to finally obtain a set of combinations of sequences called the “machining range.”
Materials and measurements
The machine used is a Realmeca C300H 4-axis machining center. The center generates power between 5.5 and 7.5 kW with a maximum rotation frequency of 6500 rpm. This machine is powered by 380 V electrical energy and 6 bar pneumatic energy. The Catia V5 software used in this work makes it possible to create the tool paths and then generate the G-code program compatible with the Num director of the center. The tool used is an uncoated high-speed steel tool with a diameter of 8 mm and two teeth (Figure 2).

Measurement plan.
The material of the machined part is an aluminum alloy (2017A: AlCu4MgSi). This material is widely used in the aerospace, automotive, etc. industries. This material has high mechanical characteristics after treatment and also good machinability, polishability, and good heat resistance between 100°C and 250°C. Table 1 shows the chemical composition of the material used.
Chemical composition of the material (wt%).

A Chauvin-Arnoux CA8332 power analyzer was used in order to measure the power consumed by the machine at each instant during a machining operation. Data processing is performed using the Power Analyzer’s Dataview interface. The arithmetic surface roughness Ra is measured using a KR100 roughness meter. The stroke measured is 6 mm for a caliber of 2.5 mm. The work plan is shown in Figure 3. Two studies will be carried out in order to reduce energy consumption, minimize the cost of machining and increase the surface quality of the machined part. The working method for the first case study consists of carrying out a set of machining sequences with different strategies while keeping the cutting parameters constant, namely; cutting speed, feed rate, and depth of cut. This is in order to see the influence of sequences and machining strategies on energy consumption, cost, and surface quality. Following and after the realization of the first case and the prediction of the optimal sequence by the use of gray relational analysis, an experimental plan with a variation of the cutting parameters on this sequence will be carried out in the second case. The objective, in this case, is to predict the experimental results by the use of artificial intelligence and to determine the effects of the cutting parameters on the output responses.

Work plan diagram.
One of the big problems in companies is determining the time and cost of manufacturing such a product. 10 In the case of CNC machining, it is also interesting to determine the time and cost of each operation in order to choose the optimal machining sequence which takes into account quality, cost, and energy (QCE) in its execution. The cost of a machining operation can be estimated by the equation:


Results and discussion
First case
The first case study focuses on the variation of machining strategies and sequences by setting the cutting parameters for all the tests. The choice of technological machining parameters was made taking into account the catalog of the tool manufacturer and the capacity of the machining center. Table 2 presents the cutting parameter values used in this first part. This study takes into consideration the machining sequences and strategies (tool paths) in order to obtain the optimal sequence. Table 3 illustrates the values of energy consumed, cost, and roughness. According to this table, the sequence S8 = F1-F5-F6 has the minimum cost and energy. This sequence is characterized by the fact that the tool along its trajectory is in full material (cutting phase). This condition saves a significant amount of cutting time. On the other hand, the S8 sequence is realized by the IPC strategy for all the features F1-F5-F6, which proves that the choice of the tool path and the machining sequence has a significant influence on the cost and energy.
Cutting parameters (first case).

Experimental values (first case).

Industry and researchers face a big challenge when they try to study the surface quality of machined parts. Most researchers who have worked on surface quality as a function of the tool path have used a single machining feature in their studies. Examples of this claim are the work of Zaleski et al. 11 and Ali et al. 12 Indeed the use of interacting features with a set of tool paths can lead to logic of the choice of surface quality. On the other hand, an overlay of tool paths when machining Fi features can modify the surface texture of the machined part.
Figure 4 shows the surface roughness of successive machining of F1-F2 features for sequences S1, S5, and S7 with IPC-IPC, Zigzag-IPC, and Zig-IPC strategies, respectively. The Figure 4 shows that machining F1 and then F2 (F1-F2) with Zig-IPC strategies has the lowest roughness. According to the references by Aramcharoen and Mativenga 5 and Ali et al., 12 the Zig strategy for machining a single feature has the maximum roughness compared to the IPC strategy, which has the lowest roughness. In this study, the problem is a little different since the tool for the first feature F1 creates several passes with the same strategy in order to complete the depth h of the part. Then the tool will switch to executing F2 with another strategy. The problem occurs in the last pass for feature F2. Indeed, the tool causes the last pass with this new strategy, which passes over the texture left by the first strategy of the feature F1. This phenomenon can cause a super finish in the F1 area. This is possible when the first strategy has a poor surface quality compared to the second strategy. The next step is to determine the optimal sequence Si, which gives minimum energy consumption, machining cost, and surface roughness.
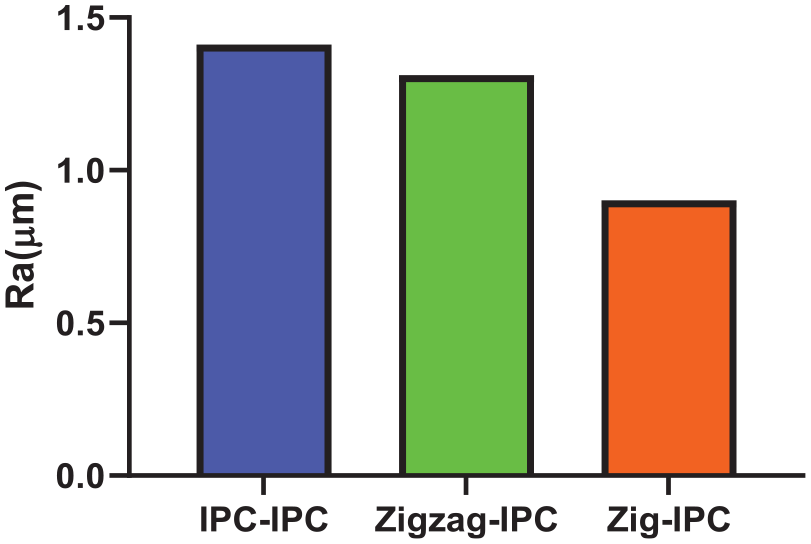
Surface roughness histogram of F1-F2 features made with IPC-IPC, Zigzag-IPC, and Zig-IPC strategies.
After carrying out the experimental tests for this first case, it is now necessary to determine the optimal machining sequence. In this study, there are three output responses, namely energy consumed, cost, and roughness. In this case, it is necessary to have a tool capable of solving this multi-criteria optimization problem. Gray relational analysis (GRA) helps to solve this type of uncertainty problem given its ability to understand uncertain systems with partially known information. 13 In this first study, the cutting parameters are constant for all the tests, so the combination S8 = F1-F5-F6 with the same IPC machining strategy is the optimal combination. The steps of this methodology are known and presented in several studies.12,13–15
In what follows, the study relates to this sequence S8 with the combination F1-F5-F6.
Second case
In this second part, the objective is to determine the effects of the cutting parameters on the output variables, Etot, Ctot, and Ra. Predicting experiment results has been done by using neural networks (ANN) and adaptive neuro-fuzzy inference systems (ANFIS). The cutting parameters associated with this part are shown in Table 4.
Cutting parameters (second case).

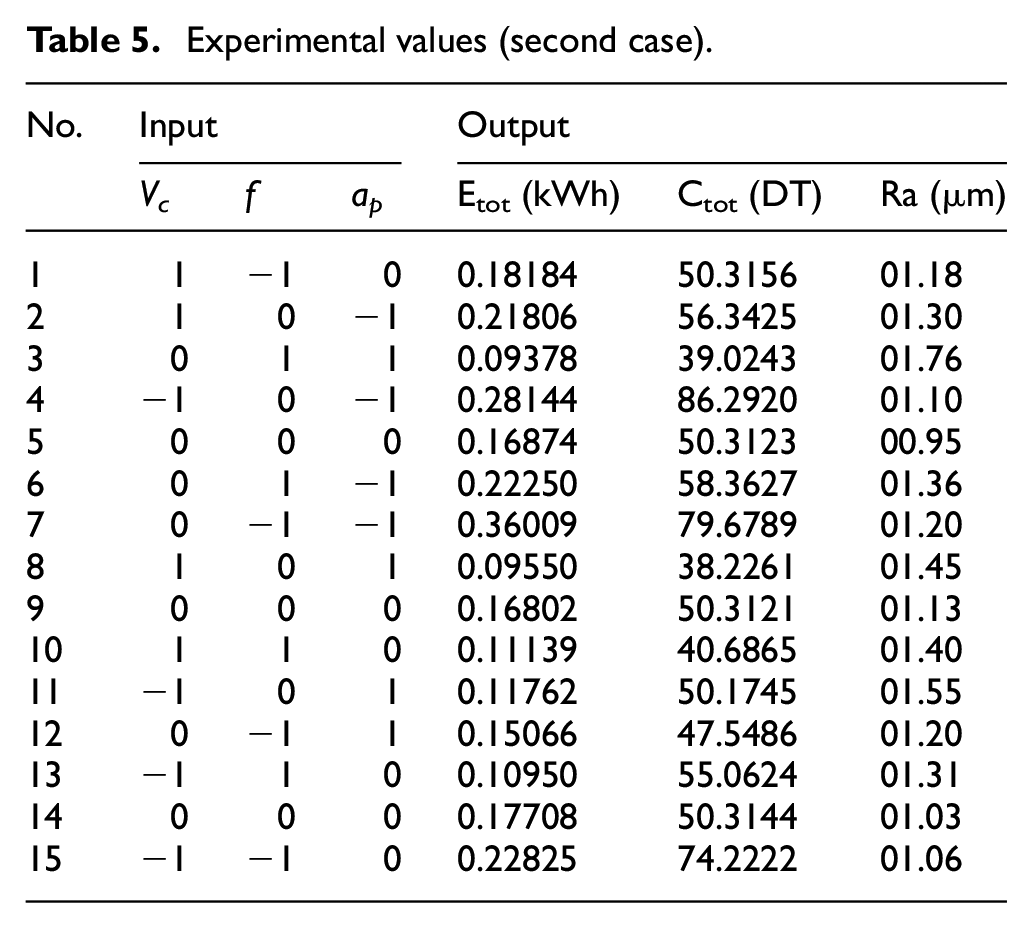
The depth of cut (ap) is chosen to ensure that for each level, the tool removes the same depth. The total cutting height of the part is h = 1.5 mm. Table 5 presents the experimental values of the 15 trials of Etot, Ctot, and surface quality Ra for the machining of the S8 sequence with a different combination of cutting parameters.
Experimental values (second case).
Prediction with artificial neural network (ANN)
ANN models are programming techniques that simulate the human brain. 16 These models have been implemented in several manufacturing, scheduling, and other industry applications. 17 Nonlinear regression analysis of network output responses 18 is used to Figure 5 out how well neural network-based predictions work. In general, a neural network consists of three layers, input layers, hidden layers, and output layers.

Proposed neural architectures: (a) general and (b) detailed model.
Two proposals for neural architecture were presented in this study in order to determine the structural performance of a neural network. The first architecture consists of three inputs (VC, f, and ap) and three outputs at the same time (Etot, Ctot, and Ra) (Figure 5(a)). The second consists of three inputs and a single output presented by the networks ANN1, ANN2, and ANN3 (Figure 5(b)).
The objective of this study is to determine the optimal structure at the output level, number of hidden neurons, and level of the learning algorithm used. The performance of all structures is measured using the Mean Squared Error (MSE) during the algorithm learning process. The MSE is given by the following equation:

The second performance criterion is the correlation coefficient (R2). The correlation coefficient varies between −1 and +1. R2 close to +1 indicates a strong positive linear relationship between input parameters and output variables. 19 The R2 coefficient is calculated from this equation:

Several learning algorithms use back-propagation in their processing systems to determine the weights and biases of neural structures. For structural neural network modeling, the Levenberge-Marquardt (LM) algorithm, the Scaled Conjugate Gradient (SCG) algorithm, and the Bayesian Regularization (BR) algorithm were used. The present work uses the sigmoid function as an activation function in order to normalize the output response.
For all neural architectures, the data is divided into three groups: learning, testing, and validation. 70% of the data is devoted to the learning phase, 15% to the testing phase, and finally 15% to validation. 20 Table 6 shows the values of MSE and R2 for the different algorithms and the different architectures. After several tests, the optimal architecture in this study for a single output is {3-10-1} for the output variable Etot and {3-14-1} for the variables Ctot and Ra. The same Levenberge-Marquardt (LM) learning algorithm is used to realize all optimal structures. The optimal architecture with three outputs (Etot, Ctot, and Ra) is now presented by the {3-10-3} architecture realized with the Bayesian Regularization (BR) algorithm. The back-propagation algorithm was very good at predicting the amount of energy used the cost of machining, and the quality of the surface. Figure 6 shows the predicted values of Etot, Ctot, and Ra versus the experimental values for the three-lead structure. The correlation coefficients (R2) for Etot, Ctot, and Ra are 0.9992, 1, and 0.9117 respectively. So, from Table 6 and Figure 6, the conclusion is drawn that the Levenberge-Marquardt (LM) algorithm has good learning with a single output response. On the other hand, the Bayesian Regularization (BR) algorithm has good learning with a multi-criteria response (three for this work). By comparison between these architectures, the {3-10-3} architecture with the (BR) algorithm has a good correlation compared to the other architectures. The MSE global mean square error for this architecture is 2.74 10−3. Therefore, the use of artificial intelligence by neural networks seems to be a useful methodology to simulate multi-criteria responses in mechanical manufacturing. In what follows, the {3-10-3} architecture will be retained.
Different neural architectures (second case).


Experimental values versus predicted values {3-10-3} (three outputs: (a) Energy Etot, (b) Cost Ctot and (c) Surface roughness Ra).
Prediction with ANFIS model
The ANFIS model is highlighted to predict experimental results in different fields of engineering.21–23 ANFIS is a hybrid fuzzy inference approach from Sugeno24,25 which simultaneously combines a fuzzy inference system (FIS) with a neural network (NN). This combination aims to make the system efficient in order to solve complex problems. 26 In the general case, the ANFIS model includes five consecutive treatment lines. The lines (layers) are connected to each other by different nodes. Each entry node is drawn from the previous line.
In this present work, in order to find the optimal architecture of the ANFIS model, a combination of numbers and types of MF was carried out. The MF functions used in this work are the triangular shape membership function (trimf), the Gaussian shape function (gaussmf), and the function (gauss2mf). The numbers of MF used are {2 2 2}, {2 2 3}, and {2 3 3}. The membership function of constant and linear types is used for the output variables. The ANFIS modeling process runs with 75% of the data for training and 25% for testing. In this process, the iteration number for the mapping is equal to 100. The findings show that structure {2 2 2} is the best configuration for the three output replies (Etot, Ctot, and Ra). With a linear output, the function (trimf) has the lowest test error for the energy (Etot). However, for Ctot and Ra output responses with constant and linear output functions, respectively, the (gaussmf) function has the lowest error. Figure 7 illustrates the comparison between predicted and experimental values for output responses. The correlation coefficient (R2) for the variables Etot, Ctot, and Ra are respectively 0.95, 0.965, and 0.968. These values present a good correlation but are less weak than those of the neural network, except for the surface quality Ra for the ANFIS model, which is greater than that of the neural network (0.968 > 0.9117).

Experimental values versus predicted values (ANFIS model: three outputs: (a) Energy Etot, (b) Cost Ctot and (c) Surface roughness Ra).
Comparative study between ANN and ANFIS
A comparative study of two models, ANN and ANFIS, was carried out to value this work. Table 7 shows a comparison between the two ANN and ANFIS models’ global MSE (Training and Testing) mean square errors for the different output variables. The result shows that the global mean square error (MSE) of the {3-10-3} neural structure is lower compared to that of the ANFIS model. Indeed, Figure 6 (ANN), Figure 7 (ANFIS), and comparison Table 7 shows that the use of the Bayesian Regularization (BR) algorithm with a multi-criteria output response can give good results when compared with ANFIS.
The MSE_ALL values of the ANN and ANFIS models (second case).

Development of an intelligent simulator based on prediction models ANN and ANFIS
An interactive interface has been developed to help machinists predict the energy consumed, surface quality, and cost of a 2017A alloy part containing an interacting pocket and groove. The simulator was implemented using the “Guide” interface of the Matlab 2016 software. Figure 8 shows this user interface named “QCE_Intelligent_simulator,” which is simple and extremely easy to learn. As shown in the Figure 8, the user must first input the values of the cutting parameters (Inputs), that is, the cutting speed (Vc), the feed rate (Vf), and the depth of cut (ap). Subsequently, the user has the choice to predict the results according to the ANN model or the ANFIS model by pressing the “Predict” button.
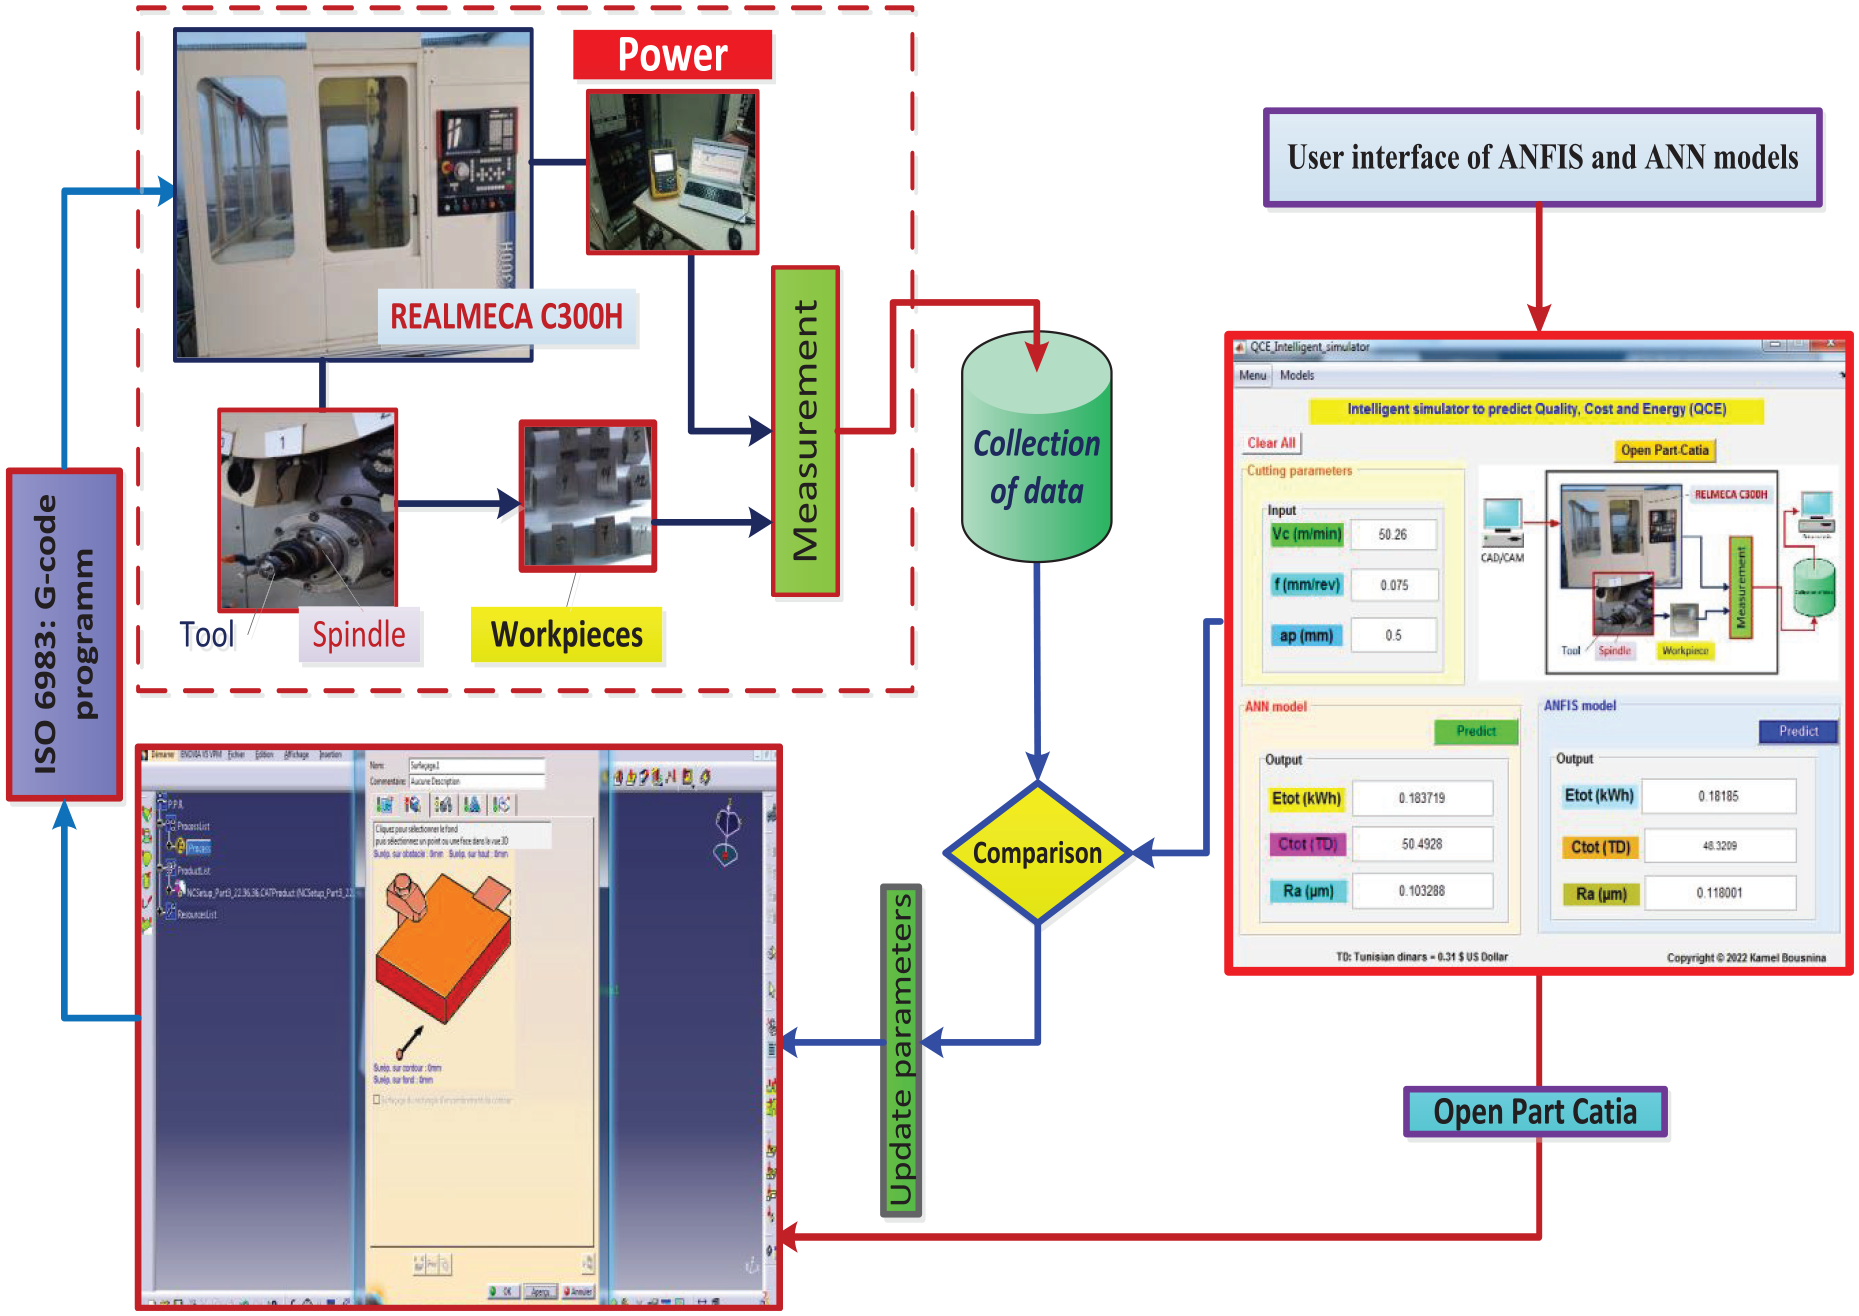
QCE intelligent simulator.
The Catia-machine interaction is achieved through the production of a G-code program according to the ISO 6983 standard compatible with the CNC director Num of the machining center. The power is measured in real-time during the execution of the machining operation. The actual results are compared to what was expected after the data and results have been analyzed. When another operation is executed, the machining parameters are updated.
Discussion
In traditional ANN training, the objective is to minimize a cost function that measures the discrepancy between the predicted outputs of the network and the target outputs. However, this approach often leads to overfitting. Bayesian Regularized Artificial Neural Networks (BRANNs) introduce Bayesian regularization techniques to address this issue. The key idea is to introduce prior knowledge about the model parameters into the training process. Instead of searching for a single set of weights that minimizes the cost function, BRANNs treat the weights as random variables and compute their posterior distribution given the training data and prior knowledge.
To incorporate Bayesian principles, BRANNs use prior distributions to specify the initial beliefs about the weights. These prior distributions encode assumptions about the weight values, such as their means and variances. During training, the network updates these prior distributions based on the observed data, resulting in posterior distributions that reflect the updated beliefs about the weights. Instead of providing a single prediction, BRANNs can generate a distribution of predictions,27–29 which represents the uncertainty associated with each prediction. This uncertainty estimation can be valuable in decision-making processes where knowing the confidence or reliability of the predictions is crucial.
When comparing ANN and ANFIS (Adaptive Neuro-Fuzzy Inference Systems) in general, rather than a specific modification of either model, several factors come into play. ANFIS combines fuzzy logic with neural networks to provide a hybrid approach that incorporates linguistic if-then rules into the learning process. This allows ANFIS to capture and utilize expert knowledge effectively. In conclusion, the choice between ANN and ANFIS depends on the specific requirements of the problem at hand. BRANNs, as a variant of ANN, provide a regularization technique that can enhance the generalization and uncertainty estimation capabilities of ANNs. By incorporating Bayesian principles, BRANNs strike a balance between fitting the training data and avoiding overfitting, making them a valuable tool for various applications. However, the comparison between ANN and ANFIS should be made considering their inherent characteristics and the specific needs of the problem domain, rather than focusing solely on a modification of one of them.
Conclusion
The increase in the world’s population promotes an increased demand for products, which requires enormous energy consumption in industries. In order to evaluate the trade-offs between cut quality, manufacturing cost, and energy consumption (QCE). This article presents an approach that integrates artificial neural networks (ANN) and adaptive neuro-fuzzy inference system (ANFIS) to predict the effects of strategies, machining sequences, and cutting parameters on the consumption of energy, machining cost, and surface roughness. Two in-depth case studies were carried out to understand the effects of the parameters introduced into the multi-criteria output responses. Based on the results already found, the studies first show that the strategies and the planning of the machining sequences have a remarkable influence on the energy consumption, the cost of machining, and the surface quality of the parts. In this work, a multi-objective optimization based on the gray relational analysis was proposed, which is applied to optimize the sequences and strategies of machining on a part that contains interacting entities. The results obtained confirm that the proposed optimization method is a very indispensable tool for multi-criteria optimization. The use of a variety of architectures and a variety of learning algorithms for the construction of neural networks allows us to increase the range of choice and the rigorous selection of the optimal solution (architecture + algorithm). The {3-10-3} architecture with the Bayesian Regularization (BR) algorithm is the optimal neural architecture that yields an overall mean square error (MSE) of 2.74 10−3. Similarly, for the adaptive neuro-fuzzy inference system (ANFIS), the optimal structure which gives a better error and better correlation is the {2 2 2} structure, and this for the three output variables (Etot, Ctot, and Ra).
Future work will aim to extend multi-criteria output responses to account for other factors (e.g. dimensional error, vibration). Finally, an application to a wider range of prediction and optimization with other methods of artificial intelligence can contribute positively to the desired performance.
Footnotes
Appendix
Handling Editor: Chenhui Liang
Declaration of conflicting interests
The author(s) declared no potential conflicts of interest with respect to the research, authorship, and/or publication of this article.
Funding
The author(s) received no financial support for the research, authorship, and/or publication of this article.