
Abstract
In this paper, the impact jet field between the pneumatic nozzle and the workpiece surface is simulated by the computational fluid dynamics method, and the influence law of the nozzle structure parameters on the jet performance is obtained by combining the response surface method (RSM), so as to improve the dust removal effect of the pneumatic nozzle. Firstly, the nozzle impact jet field calculation model was established, and the experimental platform of wind speed and volume measurement was built to verify the accuracy of the numerical calculation model and to simulate and analyze the jet field distribution characteristics of the nozzle under rotating working conditions. Then combined with the Box-Behnken Design (BBD) method, a response surface regression model with nozzle inlet radius (R1), cylindrical section length (L), and cone angle (A) as design variables and nozzle jet fixed point (20 mm) flow rate as the target variable was established to find the optimal combination of nozzle characteristics parameters. The results show that the optimized nozzle characteristics parameters using RSM can effectively improve the nozzle jet performance, the optimized jet flow rate increased by 8.38%, and can be more effective in dust removal; jet pressure on the workpiece surface decreases as the nozzle incidence angle increases; in the speed range of 400–1200 r/min, the pressure change caused by the jet on the wall surface is small, and the flow rate is relatively stable.
Introduction
The miniaturization, integration and fine pitch of components during surface mount technology (SMT) production has led to an increased focus on the impact of micro-particles (dust and impurities) on printed circuit boards (PCBs). These particles can lead to various defects such as under-tinning, continuous soldering, and solder paste printing omissions. In order to reduce or eliminate the negative impact of these particles on product quality, the surface particles of PCBs need to be removed. 1
Currently, there are two types of dust removal solutions commonly used in the industry: contact and non-contact. Contact dust removal solution by rolling sticky bar and other tools to the PCB board surface dust sticky operation, its advantage is to be able to remove the volume and mass of dust or impurities, but rolling sticky bar maintenance costs are high, the replacement process consumables, cleaning device itself prone to secondary pollution. 2 The non-contact dust removal solution uses high-pressure airflow generated by tools such as air knives and pneumatic nozzles to remove impurities and dust adhering to PCBs, and collects the raised dust and other pollutants by setting up dust-absorbing devices using the principle of negative pressure, but the air knives used as dust-blowing tools are too large in size, have limitations in installation location, and the number of nozzle openings is too large causing large air loss, and the dust removal angle is mostly fixed and cannot meet the dust-blowing needs of complex structure spaces.3–5
Scholars have carried out various studies on pneumatic nozzles. By conducting simulation experiments, Zhao 6 demonstrated that for a certain nozzle and workpiece configuration, there exists an optimal jet distance that maximizes the jet operation efficiency and minimizes the energy consumption. Jiang et al. 7 developed an experimental device for measuring the jet impact force of pneumatic nozzles using pressure sensors, flow meters and digital weighing scales, and obtained satisfactory results. Xu and Cai proposes a novel energy-saving device for nozzles applied to surface cleaning of workpieces. The device trans-forms continuous airflow into intermittent airflow with periodicity, which enhances the cleaning performance and significantly reduces the air consumption. 8 Zhang et al. 9 utilized an image processing method that relates the intensity variation of images to particle density in order to conduct experimental research on the efficiency of dust removal from gas gun nozzles. Soemoto et al. developed a high-speed air jet nozzle with a triangular cavity, which increased the velocity and pressure fluctuations of the airflow. Experimental research was carried out to demonstrate the effectiveness of pulsating airflow for the removal of microparticles. 10 The above studies have shown that the pulse characteristics of the airflow can effectively remove fine particles such as dust and impurities, and the rotating jet has a periodicity. For the workpiece itself, the airflow effect it receives is pulsating.
Similarly, the internal structure of the nozzle also has a great impact on the jet. Fang et al. and others designed a Laval nozzle that can quickly and effectively impact and destroy the material arch formed above the outlet of the silo. By combining orthogonal experiments with numerical simulation, the appropriate nozzle structural parameters were selected and the jet velocity was measured with a small relative error. 11 Li 12 analyzed the influence of the parameters of the 3D rotating jet gun nozzle contraction angle and aspect ratio on the internal and external flow fields by changing their sizes, and then obtained the optimal nozzle structural parameters suitable for oil tank cleaning. Li established a mathematical model between the nozzle jet performance and the nozzle structural parameters, and used a genetic algorithm to optimize the combination of nozzle parameters. Simulation and experiments jointly proved that this method can improve jet stability. 13 Wu et al. 14 used 3D printing technology and high-speed photography technology to design a visualization experiment, and obtained the influence of organ pipe self-resonant cavitation nozzle resonator and throat size parameter changes on cavitation characteristics through image processing analysis. Li conducted parameter optimization on the double arc right-angle bend pipe flow channel. Based on orthogonal experiments, sample data was obtained and regression analysis prediction models and BP neural network pre-diction models were established. By comparison, it was found that the regression analysis prediction model had higher prediction accuracy and could effectively reduce the internal pressure loss of the bend pipe. 15 These suggest that an optimal set of nozzle structure parameters exists that can enhance the performance of the aerodynamic nozzle. Optimizing the nozzle structure is necessary to improve jet performance.
In summary, the pneumatic nozzle with a certain pulse airflow can better remove the particles attached to the surface of the workpiece, this paper designs a pneumatic rotary nozzle, so that it produces a rotary jet to form a pulse airflow on the surface of the workpiece to achieve a better cleaning effect. In this paper, the response surface model between pneumatic nozzle structure parameters and nozzle axis jet velocity is constructed by using Design of Experiment (DOE) to select sample points. In order to make the pneumatic nozzle to minimize the pneumatic loss, the maximum jet velocity as the response target, the nozzle performance to reflect the degree of axial velocity decay, to get the optimal combination of nozzle structure parameters and jet conditions, and to study its flow field pressure and nozzle jet velocity distribution law under rotating conditions, to provide a theoretical basis for the subsequent pneumatic rotary nozzle dust removal operations and structural optimization design.
Numerical computational model
Structure and working principle of rotating nozzle
The rotary nozzle designed in this paper consists of a hollow shaft, pins, nut, bearings, X-shaped seal ring, drive cavity, dust cavity, etc., as shown in Figure 1. The high-pressure gas flows in from the hollow shaft inlet, and the drive cavity and the dust cavity are interconnected. The high-pressure gas flows in the designed flow channel and is finally ejected at high velocity from the drive nozzle and the dust nozzle opening, and the resulting counter-thrust drives the nozzle to rotate, thus forming a rotating jet on the blowing surface and achieving pulsating airflow to blow dust on the workpiece surface. Among them, the internal dust nozzle is a conical columnar structure, installed around the ring cavity, the type and number of nozzles can be changed, and the ring cavity can be rotated around the central axis of the mounting bolt to achieve stepless adjustment of the dust nozzle angle to meet the dust removal needs of different products.

Pneumatic rotary nozzle structure and working principle: (a) working principle and (b) 3D model.
Analysis of jet flow theory
When the jet impinges on the surface of the printing plate, the airflow spreads along the surface of the printing plate in the direction of

High-pressure jet impacting the wall.
The theoretical impact force of the high pressure jet on the printing plate is the stable impact force formed by the impact of the high pressure jet on the printing plate.

In the formula,
Through the above formula can be calculated to obtain the theoretical impact force of the high-pressure jet acting on the surface of the printing plate, from the formula can be seen that the theoretical impact force is proportional to the speed, nozzle exit cross-sectional area. Jet by gas diffusion and air resistance and other factors, the final effect on the printing plate surface impact force is less than the theoretical impact force.
Assuming that the working mass is an ideal gas, the flow rate at the exit of the tapering nozzle is much greater than the speed of heat exchange with the outside world, and friction losses can be ignored. When the nozzle inlet and outlet cross-sectional pressure configuration is reasonable, the nozzle will produce the maximum air velocity, therefore, this paper will be the flow in the nozzle as isentropic flow, Figure 3 shows the gas from the chamber ① through the tapering nozzle into the chamber ②.

Nozzle flow parameters.
The flow velocity at the outlet section is obtained by substituting the hysteresis parameters of the chamber ① with those at the outlet section into the equation of motion for isentropic flow 16 :
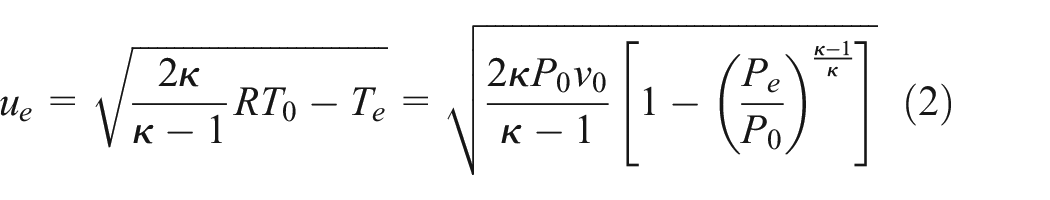
Where
When the cross-sectional work pressure

Also with critical ratio volume:

Substituting the above two equations into equation (2), we get:

The simplification of the equation (5) leads to:
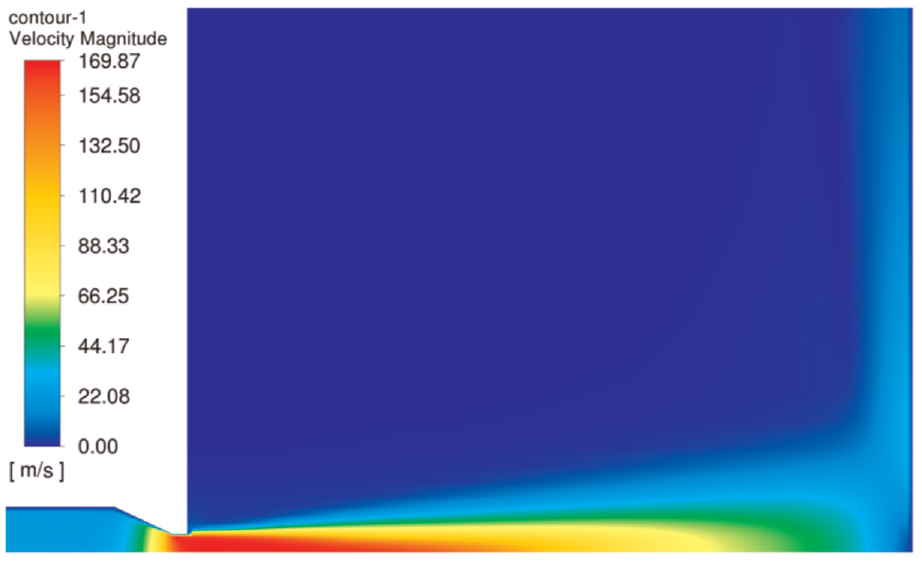
From equation (6), it can be seen that the critical pressure ratio
Simulation model and boundary conditions
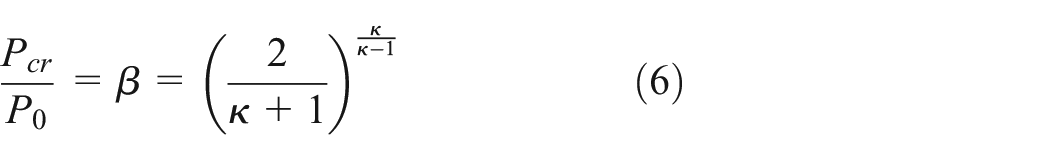
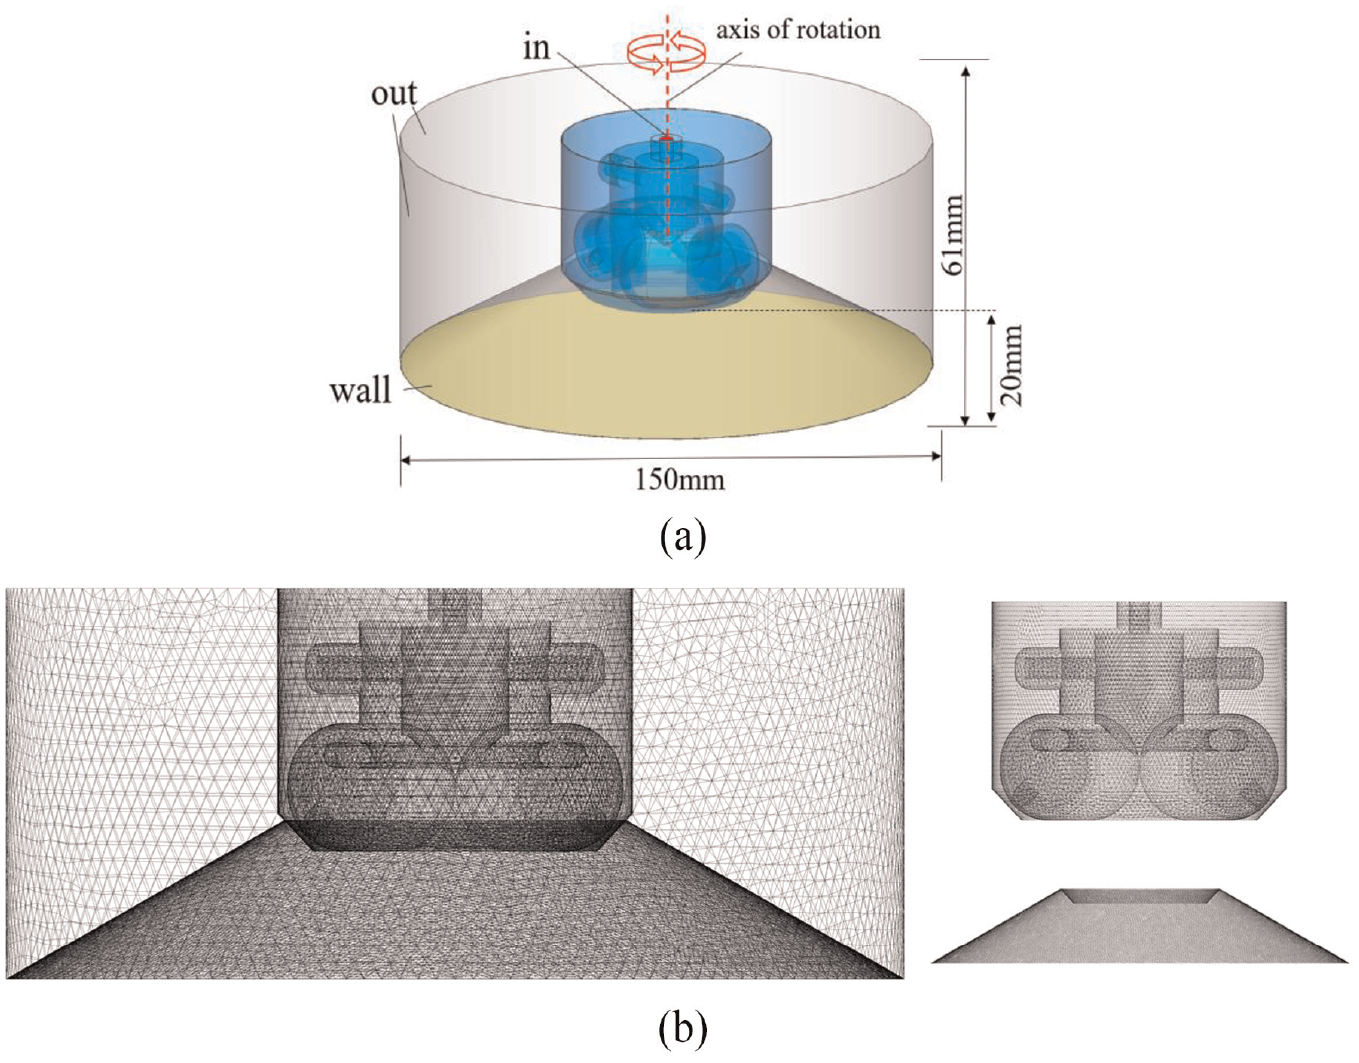
As shown in Figure 4, the nozzle jet simulation model boundary conditions settings, taking into account the axisymmetric characteristics of the nozzle structure and save computer resources, the simulation uses a quarter of the three-dimensional model to calculate the overall length of the nozzle control in 10 mm; flow field domain length is affected by the actual nozzle installation distance, and 40 mm can meet the normal decay law of the nozzle jet, the flow field length is set to 40 mm; in order to prevent the simulation results appear “wall” effect, the radius of the field to expand the processing, the radius of the field wall for 30 times the R2 distance, set to 30 mm.

Simulation model boundary conditions.
The nozzle outlet surface axis position as the center of the coordinates, the outlet section for the 0-scale section. The model of the central jet section of the flow field is segmented by processing the 3D model, in order to achieve the purpose of the subsequent division of a more detailed and high-quality grid, the nozzle internal, jet section area are required to refine its model mesh operation, in order to increase the accuracy of the solution, to get more accurate simulation data results. As shown in Figure 5, for the model mesh division, in which, af section for the nozzle inlet; cd section and de section for the exit of the jet flow field; ef section for the nozzle internal flow field wall; bc section for the jet external flow field wall. The mesh of the model is completed by Ansys Meshing.
Mesh division.
In order to accurately simulate the effect of high-pressure jet impact on the wall, the inner part of the nozzle and the central jet are meshed with a hexahedral mesh. The encrypted grid scales are 0.5, 0.8, 1, 1.5, 2, 3 mm, focusing on the nozzle jet velocity in the axis of the weakening degree, compare the simulation results under the six encryption scales, the model for grid-independent verification, verification results are shown in Figure 6, the smaller the grid scale and up to 0.8 mm, the velocity curve highly coincident and no longer change. Based on the number of grids, calculation accuracy, and computer running cost, the encryption scale of 0.8 mm is preferred for this simulation.

Mesh independent verification.
Nozzle jet three-dimensional simulation boundary conditions set: gas inlet using the total pressure inlet boundary conditions,
CFD model description.

The realizable k-ε model is chosen for the turbulence model, which has a better performance in strong streamline bending, vortex and rotation compared to the standard k-ε model and can calculate the dispersion ratio of the cylindrical jet more accurately considering the effects of the average strain rate and rotation, and is suitable for complex flows with the turbulent kinetic energy k and turbulent dissipation rate ε transport equations, 17 respectively:


In the formula,
Simulation results and experimental verification
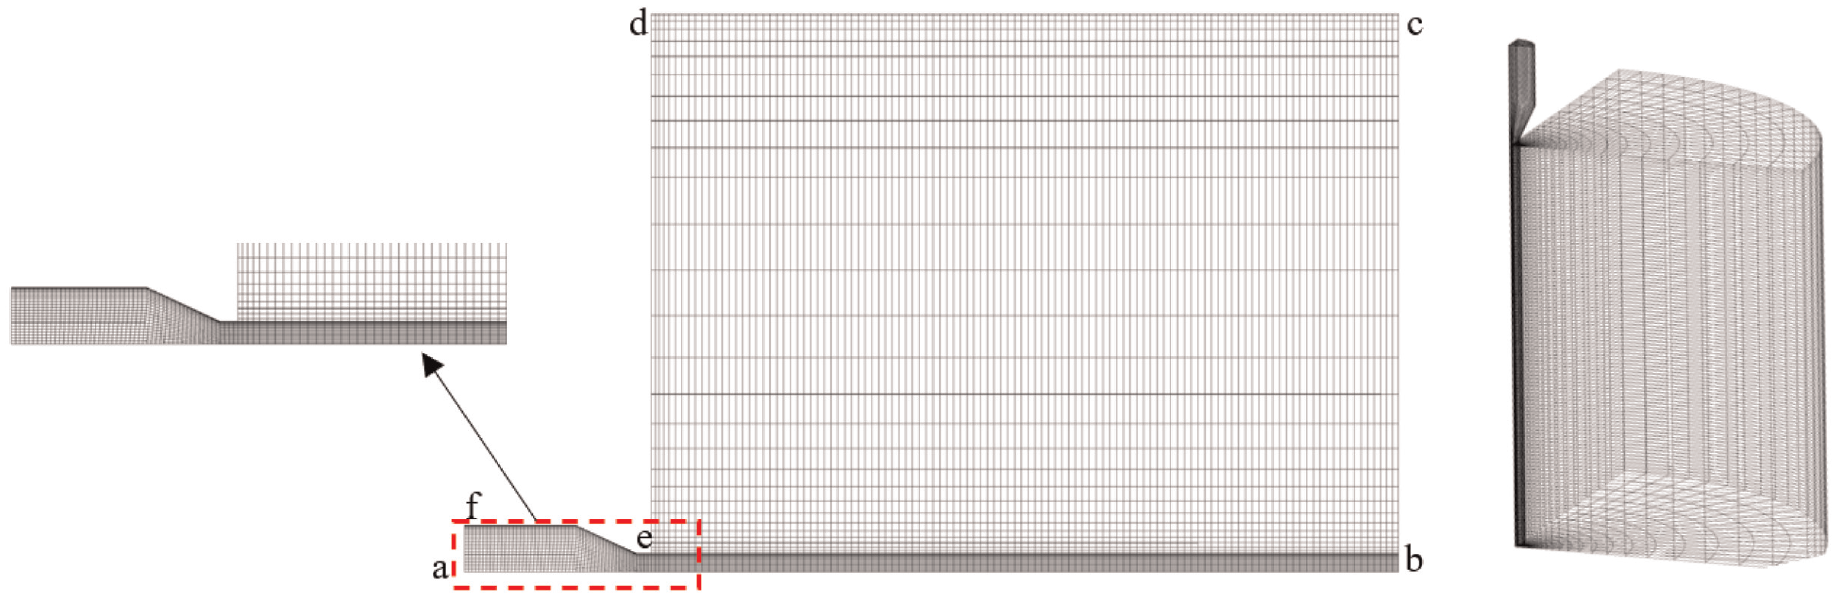
The velocity cloud diagram of the nozzle high-pressure jet impacting the wall is obtained by FLUENT as shown in Figure 7. High-pressure gas is ejected from the nozzle outlet, and the high-speed jet impinges on the wall, diffuses in the tangential direction of the wall, and finally flows out slowly in all directions along the wall. The maximum flow velocity at the nozzle outlet reaches 169.87 m/s, which is in good agreement with the theoretical calculation results.
High-pressure jet impact wall velocity cloud.
In order to obtain more accurate data from the numerical simulation of the impact jet, the wind speed and air volume measurement platform shown in Figure 8 is built to measure the velocity magnitude on the jet axis at different ranges by comparing the real data with the simulation data. The experimental platform is mainly composed of air compressor, wind speed and air volume measuring instrument (the wind speed and air volume measuring instrument consists of L-shaped pitot tube, hose and the main body of the measuring instrument), aluminum support, nozzle (the nozzle used in this experiment is completed using 3D printing technology, the printing accuracy is controlled at ±0.1 mm, the material is transparent resin, the surface is smooth) and other devices, wind speed and air volume measuring instrument and air compressor specific parameters are shown in Table 2 shows.

Nozzle flow rate measurement experimental platform: (a) experiment flow chart and (b) experimental platform.
Experimental equipment parameter table.

In the experiment, the nozzle was supplied with a high-pressure air source by an air compressor to ensure that the ambient temperature in the laboratory was at 27°C. The nozzle was aligned with the pitot tube several times before measurement to ensure that the data read by the measuring instrument was as much as possible the velocity on the nozzle axis. The nozzle inlet pressure was controlled to 0.12 and 0.16 MPa through the regulator, and each set of data was measured ten times to take the average value and simulated to obtain the axial flow velocity data under both pressures. Finally, the nozzle axis velocity with the jet distance curve and experimental comparison results are shown in Figure 9. Nozzle measured along the axis of the velocity value with the increasing distance of the jet decay, with the increase in range, the airflow diffusion escape is more obvious, resulting in the experimental value and the simulation of the value of the gap is too large, but the overall error between the simulation data and experimental data is not large, in line with the jet decay law, can provide the basis for further study of the nozzle jet field under the rotating jet.
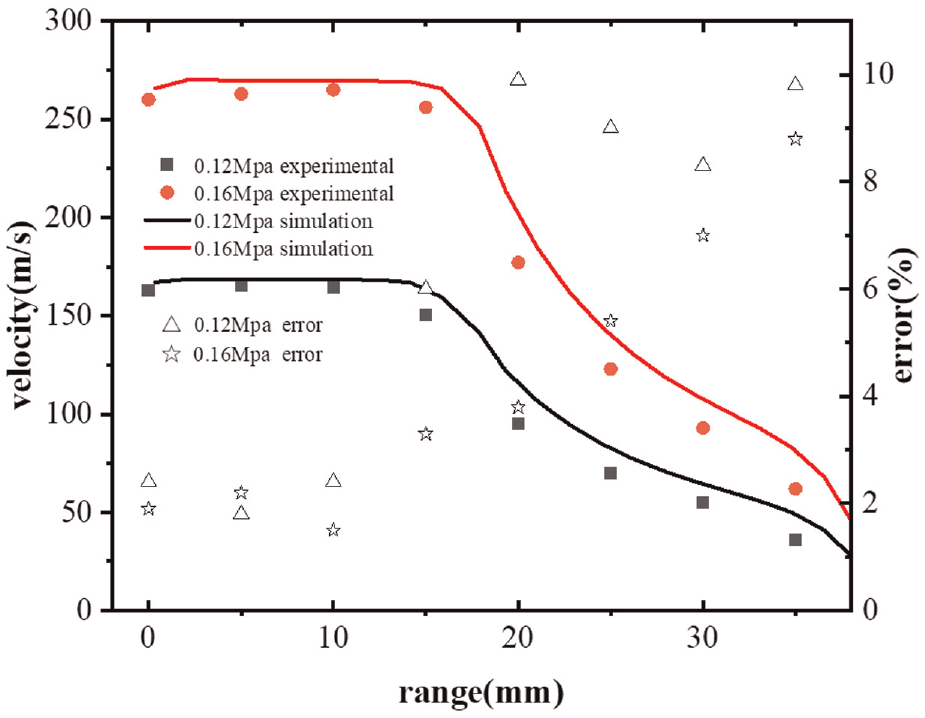
Comparison of simulation data and experimental data
Response surface method
Selection of nozzle parameters
This paper chose the common conical columnar nozzle structure, the type of nozzle has a good set and easy processing, can produce a more concentrated impact on the surface of the workpiece, easy to remove surface dust. As shown in Figure 10, where R1 is the nozzle inlet radius, R2 is the nozzle outlet radius, L is the length of the cylindrical section, A is the cone angle, it is known from the literature that the nozzle inlet section length L1 has a small effect on the nozzle jet flow rate, R2 is a fixed value of 1 mm, so the three parameters R1, L, and A as the factors of this response surface method design. 18

Nozzle structure parameters.
In the impact jet flow field, as can be seen from the formula (1), the impact force generated by the nozzle has a great relationship with the jet flow velocity, the decay of the jet flow velocity largely determines the ability of the jet to clean the surface of the workpiece, therefore, the size of the velocity at the fixed point of the nozzle axis (20 mm) position is selected as the nozzle optimization index, as far as possible to improve the nozzle itself jet performance.
BBD experimental design
In response surface design tests, Box-Behnken Design (BBD) is widely used and can be used to efficiently fit first- and second-order models. In this paper, R1, L, and A are used as design factors, representing nozzle inlet radius, nozzle cylindrical section length, and nozzle cone angle, respectively, with −1, 0, and 1 representing three levels of the three factors, respectively, and the nozzle design variable size variation range is shown in Table 3.
Design variable size variation range.

The experimental design scheme in this paper has 17 test points, and the results obtained from each set of test calculations were recorded to form the experimental scheme and response values as shown in Table 4.
BBD test design scheme and corresponding target values

Response surface model establishment and regression analysis
The response surface method conducts a limited number of experiments on factors within a specified range and constructs polynomials of different orders to model the relationship between the response value and each factor. This allows for the determination of an optimal solution. In general, the relationship between the response surface

In the formula:

In the formula: the terms on the right side of the function are constant term, first-order term, square term, second-order interaction term, and error term in turn;
By adopting a BBD design to arrange test points and conducting simulation tests, the response surface model parameters are fitted using the least squares method. The resulting second-order polynomial response surface approximation model for output is obtained:

The variance analysis and significance test results of the nozzle response surface regression model are shown in Table 5. It can be seen that the B, B2, and C terms are extremely significant (p < 0.0001), indicating that in the conical cylindrical nozzle structure, the nozzle cone angle A has a significant impact on the nozzle jet velocity. The A2 and C2 terms are significant (p < 0.05), while the p values of the remaining terms are greater than 0.05 and are not significant. Within the entire experimental design range, the overall p value of the response surface model is less than 0.0001, which is extremely significant, indicating that the model has high fitting accuracy and validity. 21
Analysis of variance (ANOVA).

*significant. **extremely significant.
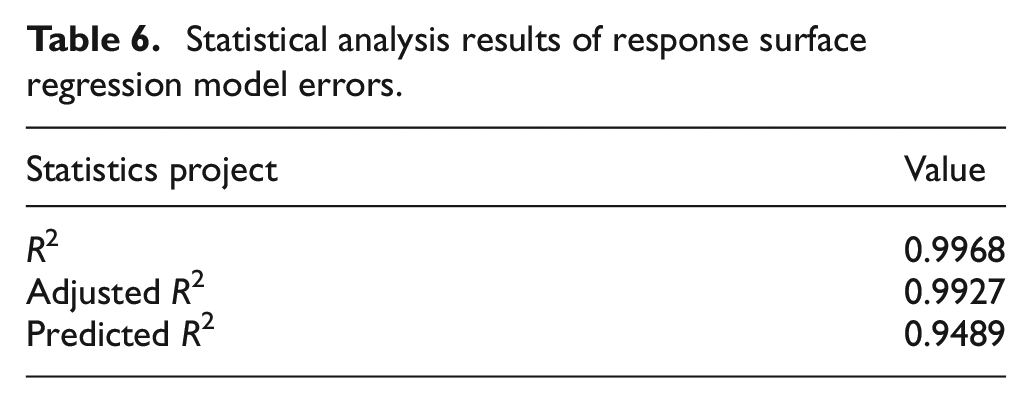
Table 6 shows the error statistical analysis of the response surface regression model. The correlation coefficient R2 and the correction coefficient adjusted R2 are close to 1, and the difference between the correction coefficient adjusted R2 and the predicted correlation coefficient predicted R2 is less than 0.2, which indicates that the predicted data of the model are in good agreement with the experimental data and have a high reliability.
Statistical analysis results of response surface regression model errors.
The normal probability distribution of the nozzle jet velocity residuals is shown in Figure 11. The distribution of each residual is almost near a straight line, indicating that the residuals obey a normal distribution, and the regression model is highly accurate and adaptable.
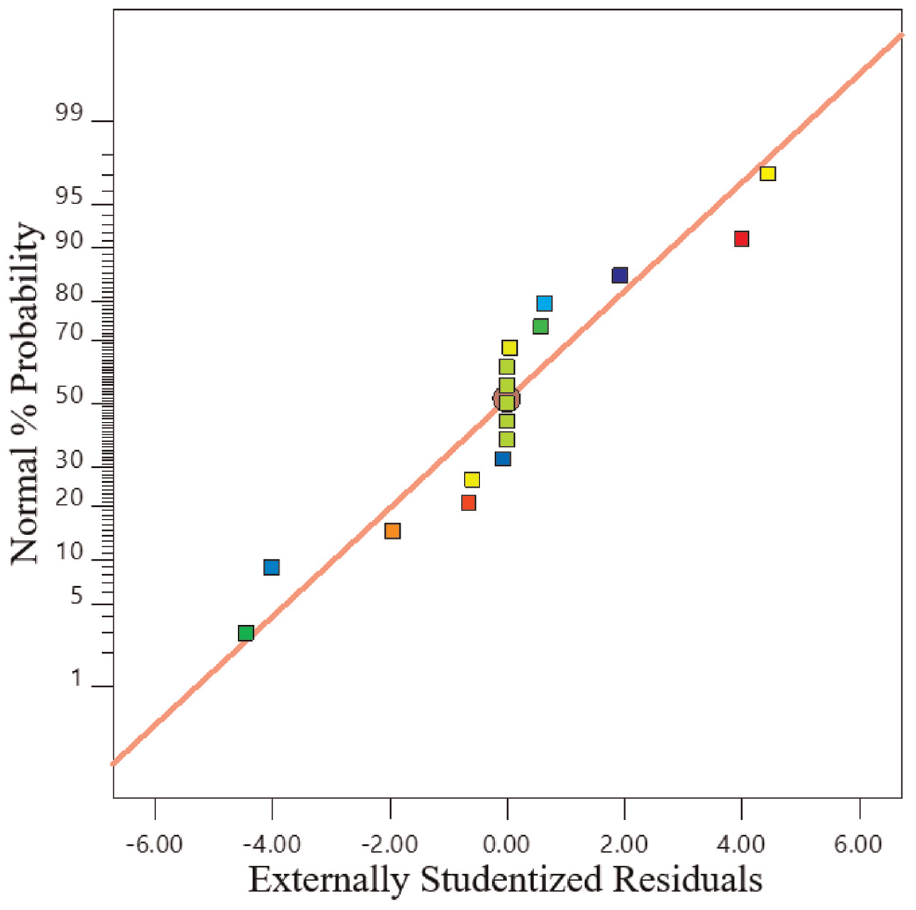
Residual normal probability distribution of nozzle jet velocity.
Response surface analysis
According to the response surface regression model to obtain the response surface and contour map of the interaction of each characteristic parameter on the nozzle jet fixed point velocity, thus reflecting the effect of each parameter of the nozzle on the response value, as shown in Figures 12 to 14.

Interaction effect of L and A on jet velocity at fixed point: (a) response surface plot and (b) contour map.

Interaction effect of L and R1 on jet velocity at fixed point: (a) response surface plot and (b) contour map.

Interaction effect of A and R1 on jet velocity at fixed point: (a) response surface plot and (b) contour map.
From the response surface plot in Figure 12, it can be seen that when the nozzle inlet radius is constant, the interaction between the length of the cylindrical section and the cone angle has a certain significance. Nozzle jet velocity along the taper angle direction gradient changes more obvious. It shows that the cone angle on the nozzle jet velocity dominates the effect. This is due to the larger cone angle on the high-pressure airflow is easy to form a stagnant effect, the cone angle is small so that the flow rate increases. From the contour plot can be seen in Figure 12 within the range of each factor, by reducing the cone angle can be obtained by a larger jet velocity, where the cone angle is 25°–30°, the length of the cylindrical section to 0.5–0.55 or 0.75–0.8 mm, the nozzle jet velocity reaches the maximum.
From Figure 13 response surface diagram can be seen, the cone angle is constant, the inlet radius and cylindrical section length interaction is not significant enough. This is due to the nozzle jet velocity size is mainly determined by the internal and external pressure difference, the inlet radius on the jet flow velocity is not obvious enough. As can be seen from the contour plot, in Figure 13 within the range of factors, increasing or decreasing the length of the cylindrical section can obtain a larger jet velocity, which when the inlet radius of 2–2.5 mm, the length of the cylindrical section of 0.5–0.55 mm or 0.75–0.8 mm, can obtain a larger jet velocity.
From the response surface curves in Figure 14, it can be seen that the interaction between the cone angle and the inlet radius is significant when the length of the cylindrical section is constant. The gradient of jet flow velocity changes significantly in the direction of the taper angle, and the effect of the inlet radius on the jet flow velocity is almost negligible, indicating that the effect of the taper angle on the jet flow velocity is dominant. From the contour plot, it can be seen that in the range of the values of each factor in Figure 14, decreasing the taper angle can obtain a larger jet flow velocity, among which there is a larger jet flow velocity when the taper angle is 25°–30° and the inlet radius is 2–2.8 mm.
Optimization results optimization analysis
The fixed point velocity of the nozzle jet is the response value of a hopper, and the results of the optimized combination are obtained by solving the numerical optimization module. Among the reference solutions of the given objective function, three optimal combinations of solutions and their response values are selected and compared by CFD simulation as shown in Table 7. Among the three selected optimization solutions, the predicted jet fixed-point velocity obtained by response surface optimization analysis of the optimized combination of parameters is more consistent with the simulation results, and the relative error is not large, further proving that the model (11) established in this paper between the nozzle structure parameters and the response target value is accurate.
Prediction and simulation comparison of optimal parameter combination of nozzle.

In order to consider the subsequent processing and production problems, the nozzle structure parameters for rounding, and finally determine the nozzle structure parameters: nozzle inlet radius R1 for 2.5 mm, cylindrical section length L for 0.5 mm, nozzle cone angle A for 25°. The above parameters were substituted into the model and re-simulated, and the results are shown in Table 8, with an 8.38% increase in the nozzle jet fixed point speed before optimization.
Comparison before and after optimization.

Analysis of jet flow field under rotating conditions
Simulation model of rotating jet field
After optimization of the nozzle structure parameters, the optimal nozzle structure was selected and applied to the rotating nozzle, and the flow field characteristics of the nozzle jet under rotating conditions were obtained through CFD simulation analysis. As shown in Figure 15, set the flow field boundary conditions for the rotating nozzle, the simulation process, set the pressure inlet for 130,000 Pa; the overall region for the rotating domain, the rotation axis and rotation direction in Figure 15, the rotation speed was set to 400, 1200, 2000 r/min; the outlet pressure was set to 101,325 Pa; the bottom surface as the wall; selected Realizable k-ε turbulence model is chosen. The radius length of the outflow field is 75 mm, and the height of the rotating nozzle from the wall is 20 mm.
Meshing and boundary conditions: (a) boundary conditions and (b) mesh.
In order to ensure the accuracy of the calculation, the same grid-independent verification of the rotating jet field. The rotating nozzle side of the nozzle jet axis velocity was selected as a reference indicator to analyze the jet in the 100,000, 350,000, 620,000, 1.03 million grid number of its axis velocity change trend, the grid division as shown in Figure 15. The results show that when the number of grids is 620,000 the velocity of the jet axis no longer changes with the increase in the number of grids, and the trend of velocity change is more stable, taking into account factors such as computer resources, this paper chooses the number of grids of 620,000 for the simulation of the rotating jet field.
The detailed properties of the rotating jet field model were summarized in Table 9. The residual curve is gradually stabilized when the simulation step length reaches about 1000, which further converges. The energy residuals are less than 10−6 and the residuals of the continuous velocity term are less than 10−4 as the first judge of the simulation convergence; by setting the velocity of the nozzle exit point, its value no longer changes, as the second basis of the simulation convergence, both conditions are considered as the completion of the simulation calculation.
CFD model description.

Influence of incident angle on flow field
In order to analyze the effect of the nozzle on the rotating jet field characteristics at different incidence angles, the velocity and pressure distribution on the nozzle jet axis is taken as the object of study, and the simulation results are shown in Figure 16. Figure 17 shows the velocity and pressure distribution curve of the nozzle jet axis, from Figure 17(a), it can be seen that the high-pressure gas from the nozzle after the injection, the gas pressure rises steeply, corresponding to the I stage in the figure; after a distance, the pressure force is almost constant with the ambient pressure, corresponding to the II stage in the figure; finally, the gas impinges on the wall, the pressure begins to increase rapidly, corresponding to the III stage in the figure, the jet will be converted into velocity kinetic energy pressure energy.

Rotating jet flow velocity distribution.

Influence of angle change on the pressure and velocity of jet axis: (a) pressure distribution and (b) velocity distribution.
As can be seen from Figure 17(b), after the gas is injected, the velocity starts to drop significantly, which corresponds to stage I in the figure; however, after the gas is injected for a certain distance, it forms a relative isokinetic state, which corresponds to stage II in the figure; when the gas gradually approaches the wall, the velocity starts to drop rapidly and finally reaches 0 m/s. At this time, the jet converts the impact velocity into the impact pressure on the wall, so the velocity drops significantly and the pressure rises rapidly, which corresponds to stage II in the Figure 17(a) and (b) presents the velocity and pressure distribution law is basically the same.
Figure 18 shows the comparison of velocity cloud maps before and after nozzle optimization. From the figure, the optimized nozzle has a wider jet contour and a longer isokinetic core area in the middle, indicating that the jet velocity of the optimized nozzle decays slowly. The structure under this combined parameter effectively reduces gas energy consumption and greatly improves the effectiveness of dust removal.

Comparison of flow field optimization before and after.
By changing the nozzle incidence angle to observe the maximum impact pressure caused to the wall, the law of change is shown in Figure 19. As can be seen from the figure, with the increase in the angle of incidence, the maximum impact force decreases continuously. As can be seen from the rotating nozzle principle of operation, the greater the angle of incidence of the nozzle, the longer the effective working distance of the jet, the impact force on the wall located in the horizontal orientation and thus decay significantly, so the impact pressure will gradually become smaller. When the angle of incidence from 45° to 55°, the approximate slope of this interval curve is −14.7; angle of incidence from 55° to 65°, the approximate slope of this interval curve is −9.8; angle of incidence from 65° to 75°, the approximate slope of the interval curve is −3.4; it can be seen that, as the angle of incidence increases to a certain value, the magnitude of the change in impact pressure will is no longer obvious.

Variation curve of pressure and incident angle.
Influence of rotating nozzle speed on flow field
In order to study the impact of changes in rotational speed of the rotating nozzle on the jet flow field, so as to determine the normal operation of the rotating nozzle speed range, extract speed at 400, 1200, 2000 r/min when a total of three rotational rates of pressure and velocity on the nozzle axis, as shown in Figure 20, it can be seen from the figure, compared to changes in the angle of incidence of the nozzle, changing the rotating nozzle speed on the jet axis of pressure and velocity distribution has almost no effect. By calculation, when the rotating nozzle speed at 1200 r/min, corresponding to the nozzle circumferential rotation line speed of 2.66 m/s, the value is much smaller than the jet velocity, so the speed change for the jet flow field almost no effect.
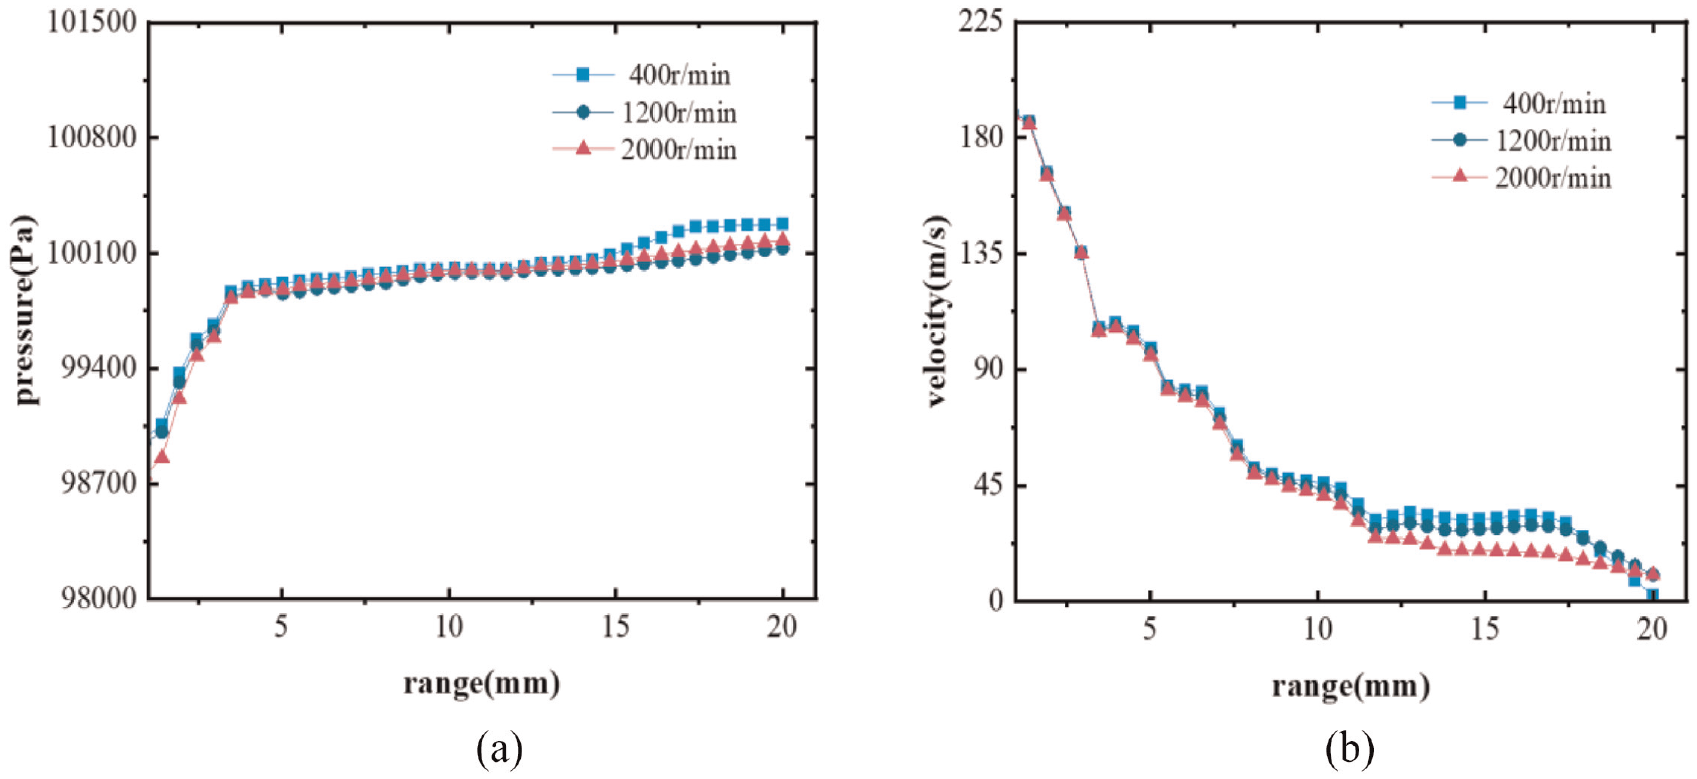
Influence of rotational speed change on the pressure and velocity of the jet axis: (a) pressure distribution and (b) velocity distribution.
Conclusions
This study employs CFD techniques to conduct numerical simulations and analyses of high-pressure gas nozzle jets. The response surface method is used to determine the effects of nozzle structural parameters on jet performance and to identify the optimal com-bination of parameters. Finally, simulations are performed to evaluate the performance of the nozzle under rotating conditions. Based on these findings, we can draw the following conclusions:
(1) Establish a computational model of the nozzle impinging jet field, simulate and analyze the flow field, and verify the accuracy of the simulation results by building an experimental platform. On this basis, optimize the structure of the nozzle. Using the BBD model, design an experimental scheme and form experimental samples. Establish a second-order response surface regression model between the nozzle inlet radius (R1), nozzle cylindrical segment length (L), nozzle cone angle (A) and nozzle jet set point velocity. The model fits well and can make effective predictions.
(2) According to the prediction results, the nozzle cone angle (A) has a significant impact on the nozzle jet flow velocity. This characteristic parameter accounts for a large proportion of the impact on the nozzle jet flow velocity and should be given priority when optimizing the design of the nozzle. Through result optimization analysis, the optimal solution is determined to be: nozzle inlet radius (R1) is 2.5 mm, cylindrical segment length (L) is 0.5 mm, and nozzle cone angle (A) is 25°. Compared with the initial structural parameters, the jet set point velocity increased by 8.38%.
(3) The simulation analysis of the nozzle under rotating conditions shows that as the nozzle injection angle increases, the impact pressure of the jet on the wall surface decreases continuously, and after the angle is about 55°, the rate of decrease begins to slow down. When the rotational speed is 400, 1200, and 2000 r/min respectively, the pressure and velocity of the nozzle axis jet basically do not change.
Footnotes
Handling Editor: Chenhui Liang
Author contributions
All of the authors contributed to the work. PW proposed the key ideas; PW and WY analyzed the key contents using a simulation and wrote the manuscript; PW obtained the financial support for the project leading to this publication; PW and WY modified the manuscript. All authors have read and agreed to the published version of the manuscript.
Declaration of conflicting interests
The author(s) declared no potential conflicts of interest with respect to the research, authorship, and/or publication of this article.
Funding
The author(s) disclosed receipt of the following financial support for the research, authorship, and/or publication of this article: This work was financially supported by the Mining Intelligent Technology and Equipment Research and Innovation Team (grant no. 2022AH010052); Open Fund of State Key Laboratory of Mining Response and Disaster Prevention and Control in Deep Coal Mines (grant no. SKLMRDPC20KF12); and Open Fund of Anhui Key Laboratory of Mine Intelligent Equipment and Technology (grant no. ZKSYS202103).
Data availability statement
Data sharing is not applicable to this article.