
Abstract
The objective of this research is to experimentally investigate the metallurgical, mechanical, and tribological behavior of
Keywords
Introduction
Nowadays, two of the important plans, namely lightweight materials and effective manufacturing process usage, are carried out by automotive and aerospace manufacturing industries during part production. In general rule for passenger car, 86% of their energy consumption is caused due to large loads, that is, their weight and passengers. In the present condition of global warming due to increase of CO2, the legislation on the limitation of emission has activated the acts to engage with magnesium alloy and its composites. In addition to this, a manufacturing process like powder metallurgy (PM) which requires less energy for part production and finishing processes as well as which has a better raw material utilization is desirable. Composite materials are the most promising material that will have a power in future due to their high strength to weight ratios and advanced mechanical property. In a composite material, metal matrix composites are applicable after more than a quarter of a century of active research that comprise a metal as a matrix and other material as dispersed phase such as ceramic or metals. Accordingly, MMCs provide a significant contribution toward industrial and engineering areas. And, it can be grouped into aluminum, magnesium, titanium as well as copper matrix composites, and others. 1
In Mg metal matrix composites, Mg occurs in a combined form with other elements that have a high reactive property when it is prepared as free element artificially. Mg is less dense than aluminum but it lacks strength even though it categorizes as light in weight materials. Its stiffness to weight ratio is very high; comparatively, 1 kg of magnesium has stiffness property equal to 3.96 kg of aluminum and 4.62 kg of steel. 2
Magnesium alloys are the primarily used to combine the features of lightness and strength. Comparatively, they have a relatively low Young’s modulus and low specific gravity than aluminum and steel common alloys, that is, 42 GPa and 1.74 g/cm3, respectively. 3 Due to the property of Mg alloys, they are widely exposed to use as lightest structural material for light weight application. 4 Nevertheless, Mg alloy have a limitation due to their ability to inhibit corrosion, creep at high temperature, and also blaze. 5
Industrially, several type of alloys is produced from those, AZ31 is one of the most popular Mg alloy with aluminum. Burke and Kipouros 2 reviewed that the 3% Al, by weight, content permit to overcome the ductility problem at high working temperature likewise it stands for strengthen a matrix by solid solution. Therefore, it suggests to utilize in manufacturing wrought products such as sheet and plate, as well as extruded bars and shapes. And also, AZ31 Mg alloy is usually used for light weight or specific gravity property such as aircraft industry to produce flat parts with ribs like brackets. 6 AZ31 Mg alloy also have the ability to resist corrosion better than AZ91 (Table 1). 7

Mg alloys can also be improved further for enhancing their property as desired in the application areas. Abbas et al. 10 reviewed that Mg alloys has a limitation on the thermal conductivity and capability of performing well between hot and cold temperatures in automotive areas. However, improvements in tribological characteristics, dimensional stability, damping capacity, and elevate temperature creep properties can be circumvented by the proper selection in type, size elastic modulus, and volume fraction of the reinforcement materials in general harder and stiffer ceramic particles reinforcements (Table 2).
AZ31 Mg alloy and reinforcement material properties.

For Mg metal matrix, some of methods are used to manufacture particulate reinforced magnesium metal matrix composites (MMMCs) including powder metallurgy, squeeze casting, gas pressure infiltration, stir casting, and disintegrated melt deposition. 11 From those, powder metallurgy is a solid-state fabrication technique of composite material that is used to add a value in engineering process for fabrication of metal matrix composites (MMCs) parts. Its process comprises powder preparation, compaction, and sintering the pressed part as general stage for the producing the desired materials which used to enhance their mechanical, metallurgical, and other properties of the products. Indeed, it depends on the process parameter used to follow for providing the desired property such as compaction pressure, sintering temperature, sintering time, type and rate of reinforcement, size of matrix, and reinforcing elements. 12
Currently, the Mg MMCs have a broad area of application toward mass saving application, that is, less fuel consumption, and also the requirement of higher strength and stiffness. In addition, it is obvious that Mg composite are the lightest structural alloys. 13 In structural applications, Mg and its composites used in Transfer case, radiator support, instrument penal beam, and steering components in automotive category. And, it is also utilized in aerospace industry in different part that make it to be the promising material for future in aviation industry. Namely, the airplane contains 12 parts, including control surfaces, wheels, engine gearbox, structural items, door frames, and edge flaps are made of magnesium alloys. 10
Karuppusamy et al. 14 studied that MMCs composed of AZ91 Mg-MMCs as matrix and tungsten carbide as reinforcement were investigated with 1.5 and 3.0 wt.% of reinforcement and found that the mechanical properties were improved. Sun et al. 15 examined a novel fine-grained AZ31 magnesium alloy reinforced with sub-micron vanadium particles was prepared by powder metallurgy. It was found that vanadium particle could accelerate the pile-up of dislocations and the refinement of Mg crystallite sizes during the milling process. Additionally, the AZ31-2.5 wt.% vanadium particle composite exhibited competitive mechanical properties. Results proved that, compared to the cast AZ31 Mg alloy, the micro hardness, yield strength, ultimate tensile strength, and elongation of AZ31-2.5 wt.% vanadium particle composite increased by 102%, 128%, 59%, and 10%, respectively. This showed that how the reinforcement alters the mechanical property.
Yadav et al. 16 investigated the mechanical and corrosion behavior of Al-based composites reinforced with 3, 6, and 9 wt.% of hybrid reinforcements, that is, SiC, graphite, and ZrO2 fabricated via stir casting process. Kumar et al. 17 investigated on the microstructure and mechanical properties of AZ31D Mg alloy reinforced with 1, 2, 3, and 4 wt.% of SiC using the stir casting process. The addition of SiC reinforcement notably reduces the grain size of AZ31D Mg matrix (i.e. linear relation b/n the grain size and SiC particulate) due to having good interfacial bonding between matrix and reinforcement and dense dislocation as Transmission Electron Microscopy (TEM) micrographs indicated. Due to the reinforcement of SiC particles distributed in the alloy matrix, the composite’s hardness, compressive, and tensile strength are increased. Qiao et al. 18 investigated the mechanical, microstructural, corrosion, and biological properties on AZ31/ZrO2 nano composite fabricated by friction stir processing. With the addition of ZrO2 particles, the average grain size is refined from 10 µm of Base metal (BM) to 3.2 µm. Venkatesh and Deoghare 19 studied the mechanical behavior of aluminum matrix reinforced with kaoline metal matrix composite that fabricated through powder metallurgy technique. Composite specimens are fabricated using powder metallurgy technique with reinforcement different percentages of weight. The hardness of the composite increases with increase in kaoline reinforcement, the ultimate compression strength was found to be increased and ultimate tensile strength was enhanced when compared to monolithic pure aluminum. Sun et al. 15 examined the microstructure and mechanical properties of fine-grained AZ31 magnesium alloy reinforced with 40 μm sub-micron vanadium average particles size (VP) prepared via powder metallurgy. Mazaheri et al. 20 focused on improving wear resistance of AZ31 Mg alloy by reinforcing 38 wt.% ZrO2 (estimated) nanoparticles and increasing pass number. Padmanaban et al. 21 investigated on A356 Al-Si alloy with 7.5 wt.% Si and 0.3 wt.%Mg and Al-Si MMCs with 5–20 vol.% of SiCp were produced using house made Rheo-Die Cast (RDC) machine. In a case of RDC composites, the grain size of the matrix is markedly decreased with increasing percentage of SiCp reinforcement. In addition, the wear resistance was found to be nearly three times higher than that of RDC alloy.
Esen et al. 22 studied on the effect of coupling of unalloyed Mg and Mg-alloys (AZ91 and WE43) with Ti6Al4V alloy on corrosion and degradation behaviors of composites which are produced via liquid infiltration into porous Ti-alloy samples. It showed that Ti6Al4V-Mg composites fractured and lost their mechanical stabilities even after 1 day. Sahu et al. 23 investigated on tribological behavior and effect in mechanical properties of AZ31 Mg alloy with different Al composition manufactured via friction stir alloying process. The results showed as the friction coefficient and average COF and also the wear rate and wear volume loss in the case of 6% Al alloying is less as compared to other composition. Zang et al. 24 fabricated nano-ZrO2-reinforced AZ31 alloy composites by friction stir processing with three multi-passes and high rotation speeds. Kumar et al. 25 studied on microstructure and mechanical properties of AZ31Mg alloy reinforced with various vol.% of ZrO2 particle composites produced via stir casting process. Kavimani et al.8,9 fabricated using homogeneously reinforced AZ31 alloy with different wt.% of reduced graphene oxide (r-GO) nano sheets for the first time through solvent-based powder metallurgy with a series of methodologies involving solvent processing, mechanical alloying, and cold pressing and finally sintering under argon atmosphere at 560°C. Microstructure characterization studies reveals that GO nano sheets were uniformly distributed with good bonding strength since no cracks were viewed in the micrograph and a few micro-voids due to decrement in density.
Madeshwaran et al. 26 studied the effects of molybdenum disulfide on thermal expansion and mechanical properties of epoxy composites which was fabricated using both ultra-sonication and mechanical stirring for 4 h at 700 rpm. Narayanasamy and Selvakumar 27 investigated tribological and mechanical behavior of magnesium matrix hybrid composites reinforced with a wt.% composition of TiC via powder metallurgy. The hardness of the hybrid composite specimens was increased with an increase in weight percentage of TiC. Rodríguez-Cabriales et al. 28 states that PM have a role in Cu based MMCs material such as appropriate material utilization, provide neat net shape product, that is, less scrapping and complex geometrical shape by using isostatic pressing, etc. Yu et al. 29 stated that it also provides a good mechanical, electrical, and metallurgical property. Besides, it has significantly an advantage over reduction of material removal processes that supports in minimizing the cost and also capability of producing novel material that could be hard to make in other melting or forming processes.
Ren et al. 11 reveals that the mechanical property of carbon nano tubes reinforced MMCs indicates the powder metallurgy process is the most preferable in future production. Suryanarayana 30 suggested that PM is most preferable method to manufacture bulk ultra-fined grained Mg alloys compared to other processes. Powder metallurgy process is a method preferably used rather than other processes like casting, stamping, or machining. Reasonably, it become more suitable when the materials own the property of high wear resistance or strength with high operating temperature exceed the ability of die casting alloys. In addition, it eliminates the finishing machining operation cause of offering a great precision and evade the casting defects namely blow holes, shrinkage, and inclusions. 31 PM method is suitable for Mg MMCs materials even though a number of techniques can be utilized during the fabrication of metal matrix composites based on some literature justification. Likewise, it has some drawback in terms of the cost of fine powder of the raw materials and the die materials. Tjong 4 and Kumar et al. 12 showed that the impact of compaction pressure on the electrical conductivity and hardness property at different levels of pressures. Mechanical and electrical properties are improved when small particle size of 3–5 µm of Cu-matrix material used. A process parameter wt.% of reinforcement can also affect the final property of a composite material which processed via powder metallurgy. 32 Generally, researchers found that the addition of Gr reinforcement decreases the mechanical properties such as: ultimate tensile strength and hardness of the composite as compared to the base material, but improves the wear behavior.
Yu et al. 33 examined the effects of heat treatment on the microstructure and wear properties of Al–Zn–Mg–Cu/in-situ Al–9Si–SiCp/pure Al composites fabricated by powder metallurgy process. Linong et al. 34 investigated the effect of reinforcement type on the final property of a composite material. The experimental results revealed that the tensile strength of the composite with the addition of 5 wt.% β-SiC nanoparticles could be increased to 215 MPa, increasing by 110% compared with pure Al matrix. Farhadinia et al. 35 studied the properties and microstructure of a hybrid composite under hot pressing of powder metallurgy methods using aluminum as matrix with different amounts of TiB2, ZrB2, and Al2O3 powders as dispersed phase. The mechanical properties of the composites are investigated on the basis of micro hardness and compression tests. The results showed well distributed particle in matrix that leads to have uniform microstructure of the composites. Zhu et al. 36 studied the friction and wear behavior of Mg powder reinforced with 5 wt.% WS2 and 15–20 wt.% SiC particles fabricated via powder metallurgy processing. The mechanical and tribological behavior of aluminum–graphite (Al–Gr) composites is investigated in order to determine the optimum composition of reinforcement. 32
Kaviyarasan et al. 37 followed the hardness and wear resistance property on the magnesium reinforced with 0.5%, 1%, 1.5%, and 2% wt.% of SiC manufactured via powder metallurgy technique. As a result, the average values for all the hardness test of pure Mg, 99.5% Mg 0.5% SiC, 99% Mg-1% SiC, 98.5% Mg-1.5% SiC, and 98% Mg-2% SiC was obtained as 13, 16, 27, 35, and 65 HV, respectively. From the average values of all the hardness test, 2% SiC reinforced samples obtained high value. And, the tribological behavior of the composite specimen (i.e. pin) carried out under pin on disc wear test apparatus at three different velocities of 0.4, 0.6, and 0.8 ms-1 as well as two loads of 5 and 10 N for a constant sliding distance of 500 m.
Unnikrishnan et al. 38 showed that gray relational analysis combined with L9 consists of three factors and three levels of Taguchi method was taken to experimentally evaluate the weld ability of AZ31B magnesium alloy by FSW process. As a result, during confirmation test, it showed that better results in the optimization of welding parameters in FSW of AZ31B magnesium alloy was obtained through gray relational analysis along with Taguchi based method.
In this manuscript, the density, porosity, hardness, compression strength, and wear properties has been investigated for AZ31 magnesium metal matrix composites reinforced with silicon carbide and zirconium dioxide particles through powder metallurgy process. The optimum combinations of the process parameters like milling time, compaction pressure, and sintering temperature has been identified for the best values of responses.
Materials and methodology
Materials to be used
The main objective for manufacturing this MMMCs was mainly to have a property of high strength to weight ratio. For that matter, the material selection was taken as the basic foot step to obtain the desired product for specified application area. The materials selected based on their properties were AZ31 Mg alloy as matrix and SiC, ZrO2, and MoS2 as reinforcement. AZ31 Mg alloys is very essential cause of having a properties of high strength to weight ratio but it need further improvement in mechanical and tribological behaviors. Due to this, SiC and ZrO2 were selected to improve the mechanical (Hardness and Strength of the materials in addition Fracture Toughness properties) and tribological properties (wear resistance properties) of the composites. The other reinforcement MoS2 was taken as solid lubricant to improve and assist the formation of the microstructure. The MMMCs were then fabricated via powder metallurgy process with calculated mass for individual materials as showed in Table 3. During composite fabrication via powder metallurgy process, it was estimated around 243.18 g for total mass of the matrix material (around 0.3 kg) and 54.42 g (0.06 kg), 48.18 g (0.05 kg), and 34.38 g (0.04 kg) for the reinforcements of SiC, ZrO2, and MoS2, respectively.
The total mass of each base metal and reinforcements of Mg alloy composite.

Methodology
The MMMC specimens were produced by means of powder metallurgy manufacturing process in order to obtain better material properties. Several processing stages were there during manufacturing the samples using PM. At first, the estimated amount of powder for the experiment was calculated based on the vol.% of the powders (i.e. Rt. and BM) and expected green compact dimensions.
Precisely, the calculated amount of powder was measured for each experiment run using analytical precision balance with weighting capacity of 252 g/0.1 mg. The manufacturing process was achieved sequentially through following the procedures as stated below in the flow chart. And, it was conducted based on the DOE using different machines for different tasks. The machine facilities used in different stages during the PM manufacturing processes were ball milling machine, hydraulic pressing machine, and sintering apparatus. Ball milling is one of a physical method used to synthesis particles assisted with various balls inside the vials. In this study, high energy mixer/mill machine was operated to obtain fine and uniformly mixed powders (i.e. matrix and reinforcement mixture) using zirconium balls. Its operation was carried out as per DOE with 1:2 balls to powder ratio. And, it was operated under constant rotational speed of 250 rpm with intervals of 40–15 min gap to reduce overheating of the powders in the vial.
Moreover, cold pressing was carried out under a hydraulically operated mounting press machine using mold. It was used to compact uniformly mixed powders at room temperature in order to form a solid part called a green compact. In this study, the pressing mold made of D2 steel, was taken to produce the sample as described in Figure 1. It was geometrically designed with 20 and 80 mm internal and outer diameter, respectively, and 30 mm height. The experiment was operated under 20 min holding time after applying the axial loading into the specimens at different levels of compaction pressure adhering to the DOE. In order to enhance the material properties of the specimens, sintering furnace apparatus was used to apply heat into the green compact, that is, compacted powder. The process was operated under considering the atmosphere to increase the product’s mechanical strength, density, and translucency as well as reduce oxidation of the specimens. During sintering process using high temperature box furnace, the heat was applied with 15°C/min heating rate under various levels of sintering temperature at 40 min constant sintering time. Since the process does not require to liquefy the material, the levels of the sintering temperature ware taken below the melting temperature of base metal.

Flow chart for composite fabrication using PM processes.
Process parameters analysis for the product quality
Based on the data found from the experiment, optimum combination of process parameters for a good quality product can be selected and analyzed through Taguchi based GRA optimization technique. In this study, the response data were analyzed using multi objective optimization technique, that is, GRA to obtain optimal level combination of the process parameter for the factor. Since, GRA based Taguchi method is suitable for data analyzing to provide an optimum specimen during the analysis of interrelationships between multiple responses using response graph method. In order to implement, several GRA equation were utilized under each step to obtain optimal parameter combinations. At first, the response data were transforms to S/N ratios (Yij) based on Taguchi quality loss function (QLF) in order to minimize the sensitivity of quality characteristic to noise factors. The types of quality characteristic are smaller the better, nominal the best and larger the better. Those types were used rely on the desired property of the product.
For smaller the better,

For larger the better,

And, variability along with the units was avoided through normalizing the Yij to the Zij (0 ≤ Zij ≤ 1) by the following equations as listed below. Since the objective for this study is to minimize the density and increase strength and hardness, the smaller the better and larger the better were taken for the characterizing the quality, respectively. Normalization, which have a value among 0 and 1, is a method of transforming a single input to evenly distributed data and then to scale it for extra analysis. For both hardness and compressive strength during normalizing, the formula of larger the better was used as stated below.

And, the formula of the smaller the better for density normalization method is,

After that, each normalized S/N ratio values were taken to find the gray relational coefficients (GRC) using equation (5),

Where,
At the last, the gray relational grades (Gi) were calculated using equation (6) for selecting optimal levels for the process parameter. Optimal levels for factors as well as influential process parameter was analyzed further using response graph method.

Composite fabrication
The composite was manufactured using a material AZ31 as base metal and SiC, ZrO2, and MoS2 as reinforcement. The experiment was designed under four input parameters, that is, milling time, compaction pressure, sintering temperature, and reinforcement percentage with three level as it is described below in the Table 4. Since composition of the composite was one of the process parameters used to design the experiment, the experiment was decided to carry out under taking coded unit for composition to represent the percentage of the reinforcement.
Composite proportion of reinforcements.

Design of experiment
The experiment was carried out based on the principle of design of experiment (DOE) to randomly construct designs for factors and its levels. As Dr. Genichi Taguchi proposed the orthogonal array (OA) method for minimum experimental run with random combinations, the experiment was proceeded with L9 orthogonal array design of experiment for this study. The experiment was designed using three levels for each selected factors, that is, input parameters. The selected factors for experiment were volume percentage of reinforcement, milling time, compaction pressure, and sintering temperature that are represented as A, B, C, and D, respectively for interpretations of the optimization result using GRA. And, their corresponding levels for the factors are stated below in Table 5.
Process parameters with their levels.
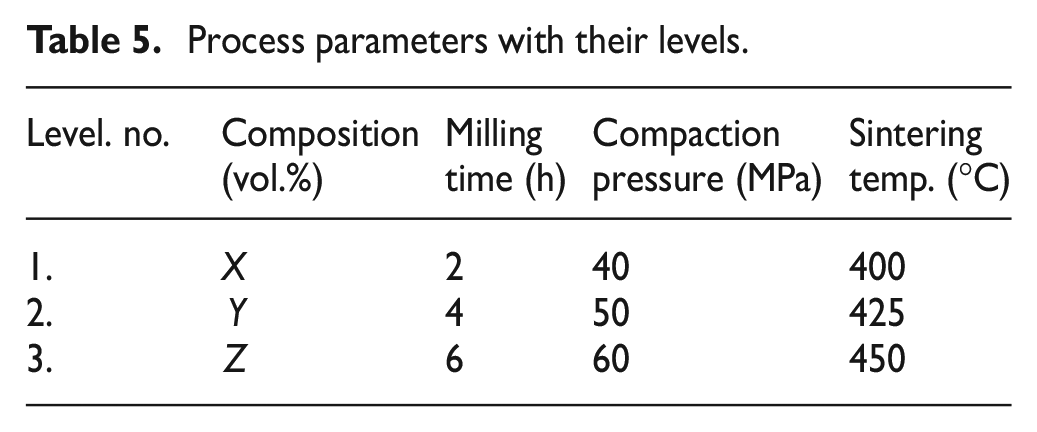
The Taguchi based L9 orthogonal array design was used to design the factors with their level randomly to obtain response of experiments. It was designed using Minitab 17 statistical software. The MMMCs specimens were then manufactured with replication using PM processing techniques following to design of the experiment. Moreover, the experimental results of response variables adhering to DOE were taken to optimize the process parameters using density, hardness, and compression. The design of experiments used for preceding the research is stated below in Table 6.
Design of Experiment based on L9 orthogonal array.

Specimen preparation
The specimen preparation, after successful manufacturing process, has a role in order to prepare the specimen for different testing methods.
Method for mechanical property tests
The MMMCs specimens for mechanical properties are usually prepared using sectioning process and grinding the surface. In this thesis work, the specimens surfaces were sectioned using abrasive cutter under the guide of ASTM standards based on the type of tests. And, specimens was followed by grinding process using different grades of sand paper to have a mirror surface especially for Vickers hardness testing
Method for characterization tools
Characterization of the material is essential to analyze different behaviors and properties of products. In this study, characterization of the optimal samples was followed in order to analyze the behavior of the samples before and after mechanical testing along with their objectives. During specimen’s preparation, the specimens were exposed to grinding using sand papers from coarse to fine grades with orientation of 90° from the previous direction of grinding. Sequentially, the sand papers of 220, 800, 1200, and 2200 grade were used assisted with air blower after each grinding operation in order to remove debris. The specimen was then polished to obtain a flat, scratch-free, and mirror like surface at the end. From the characterizing tools, SEM were used for analysis of wear morphology and fractography after wear and compressive tests, respectively, as well as microstructure of the optimal samples. And, X-ray diffractometer (XRD), with XRD-7000 X-Ray diffractometer Maxima model of Shimadzu Corporation (Japan) company, were used to investigate the crystalline phases and elements in the MMMCs samples with their corresponding sample preparation procedures and sample holder devices. It had operated through only cleaning the powders from surfaces without no further preparation.
Mechanical and tribological testing for MMMCs
The testing and characterization of the MMMCs were conducted sequentially. The specimens were corresponding to measuring density and porosity, hardness, wear (wear morphology), and compression (fractography is a method for studying the fracture details) properties. The specimens, that obtained from the optimum process parameters using Taguchi based GRA techniques, was also prepared for different test with corresponding ASTM standards for further verifications of the results. For hardness and compressive tests, the specimen’s preparation method was achieved following the same steps used in the first phase of process. However, the specimen preparation for wear test was reached based on ASTM standards. Characterizations were also carried out using XRD and SEM.
The porosity and density of the composites
Density can simply take as a concentration of something within a given defined occupied space. The simple mass density of composite materials, or materials made from two or more distinct materials with known individual densities, can be worked out based on Archimedes principle. The theoretical density of the composite material was obtained through finding the occupied space of matrix and reinforcement in the composite with their corresponding density based on rule of mixture.
A simple process was followed,
Find the densities of all the constituent’s (or elements) in the composite.
Convert each constituent’s percentile contribution in the composite to a decimal number (a number between 0 and 1) and divide by 100.
Multiply each decimal by the density of its corresponding constituent’s.
Add together the products from step 3.
Therefore, it was obtained using equation (7).

Where, VBM and Vrein1 represents percentile contribution in the composite,
The actual densities for Mg MMCs were also calculated using principle of Archimedes. Since the buoyant force existed is equal to the multiplication of mass of the displaced water and gravity (i.e. the weight of the displaced water) when the object is submerged in the water or fluids as stated by Archimedes. The samples were prepared using 100 grit grade sand paper and tested as per ASTM B962-08 standard. At first, the composite samples were weighed in air and then suspended in distilled water at 25°C using Oil with a viscosity of 20–65 cSt (or 100–300 SSU) at 38°C for further sample preparation. Therefore, the actual density was calculated according to equation (8).

Porosity of the composites
From the actual and theoretical density, porosity, or void fraction was determined by means of measuring the void spaces entirely in a composite. The porosity (

Relative density of composites
Their relative density of the material was calculated using the equation (10) to analyze the actual density of sample relatively to the theoretical density of the composites.

Where
Hardness test
The micro hardness test was conducted according to the requirements of the Vickers method using HVS-50 machine which is mostly applicable for micro parts and thin sections. At first, the specimen’s surface was polished using sand papers of 220, 800, 1200, and 2000 grades to obtain mirror surface. And, the hardness test for Mg MMCs samples were conducted according to ASTM E384-17 with cylindrical shape of sample preparation under ASTM E3-95. In this study, 10 kgf force was applied gradually for 10 s at different positions (i.e. three trials) in order to have average result values. The resulting indent mark was then analyzed optically at 10× magnification to find the lengths of the diagonals to determine the hardness value. The VHT machine then automatically analyzed and brought the HV number.
Compression test
Compression test was used to obtain ultimate compression strength of the material and some details of fracture regions. In this study, the specimens were tested using uniaxial compressive loading using universal testing machine (UTM) of WP 310 gunt model with 50 kN capacity at rate of 50 mm/min at room temperature. The specimens of MMMCs were prepared under ASTM E9-09 standard of 10 mm in diameter and 8 mm of height dimension with respect to 0.8 approximated length to diameter ratio.
Wear tests for optimized sample
Wear is the phenomenon of deformation in the material due to relative motion (like rubbing or impacting) between a surface and contacting substances. In this study, Dry sliding wear test up on the MMMCs specimens was conducted using TR-20 Micro model of Micro Pin on disk micrometer apparatus.
It was used to analyze the wear rate of the composite and investigate the wear mechanisms. In this investigation, wear test was conducted under ASTM G99-05 Standard with dimensions of 6 mm diameter and 12 mm height and then polished using fine sand paper for sample preparation. The wear property of the specimens was determined under test parameter of 30 N applied loading on the 25 mm diameter wear truck. And, it was also operated with sliding speed of 250 rpm at room temperature. Equation (13) was used in order to obtain the wear rate of the Mg MMCs samples,

Where,
The wear rate improvement with respect to the mono ceramic reinforced MMMCs (i.e. reinforced with SiC) were obtained using calculated wear rate values based on equation (14),

where,
Results and discussion
Surface morphology analysis
The topography of the composite is observed using SEM at different magnification as depicted in Figure 2. It shows some accumulation and agglomeration of the reinforced particles in some part of microstructure in the MMMCs. 39 It is used to determine the average particle size of MMMC samples using Image j software. And, the particle size distribution of the composites is determined based up on each particle measurement and ana lyzed using Origin Pro 8.5 software as depicted in Figure 3.
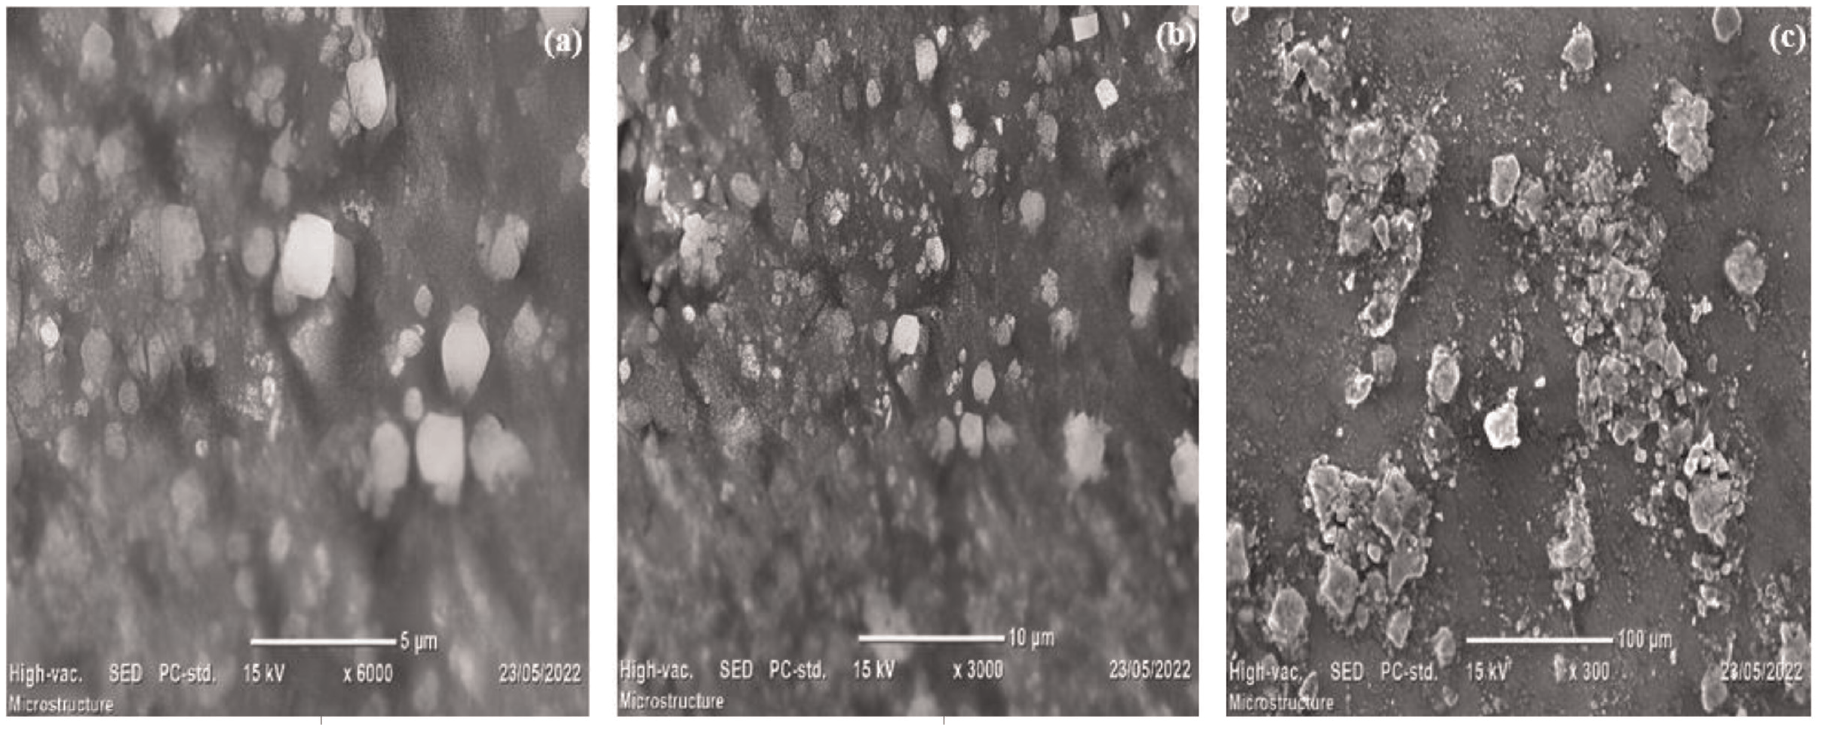
Microstructure of the optimum M MCs from the manufacturing process.

The particle size distribution using Image j Software.
The average grain sizes of the manufactured composite are obtained using SEM micrograph. It is around 809.14 nm based upon a calculation using a number of replications in particle measurements. Particle size distribution on the magnesium alloy metal matrix composite is also determined as shown in Figure 3. And, it is also showed in Figure 2 that the reinforcement particles are well distributed along the magnesium alloy matrix in the manufactured composites.
The surface morphology, that is, fractography of the material at different magnification is illustrated in Figure 4. It is used to analyze fracture mechanism of the composite. The fracture mechanisms of the composites are observed using the SEM at different magnifications to analyze the fractography of the micrographs.

(a) and (b). SEM image displaying the fracture mechanism of optimum MMMCs subjected to compression.
It is clearly observed that cleavage cracks and facets are depicted in Figure 4(a) and (b), that is, it implies the existence of brittle fracture in the MMMCs. Meanwhile, the micro pores and cracks are also existed that leads reduction in mechanical properties and a lot of dimples also observed in the micrographs. The compression tests showed accumulation of particles with sharp edge of fracture modes around cleavage facets in Figure 4 that makes to reduce ductility behaviors of the manufactured composite. Therefore, it exhibits modern fracture mechanism, that is, it shows both brittle and ductile fractures as the same phenomenon was reported in AZ31 alloys reinforced with vanadium MMCs. 16 In this study, the wear morphology of MMMCs are also studied after conducting wear test in pin on disc apparatus. The worn surface of the composite tested under 30 N using SEM.
It is clearly observed that the worn surface shows various wear mechanisms; commonly continuous grooves, wear debris, delamination, and scratches are detected comparative to sliding directions. From Figure 5, worn surface indicates that abrasive wear, delamination, oxidation, and fatigue wear mechanisms are mainly detected in the specimens. The investigations on worn surfaces and wear debris validated that the presence of the reinforcements (i.e. ZrO2 and SiC) improve the wear resistance. And, the addition of molybdenum disulfide reduces wear loss through guiding for uniform distribution of the particles over the matrix materials. As reported in other literatures, the composites manufactured with addition of ZrO2 and solid lubricants shows an improvement in reducing the wear losses as reported in other literatures.40,41
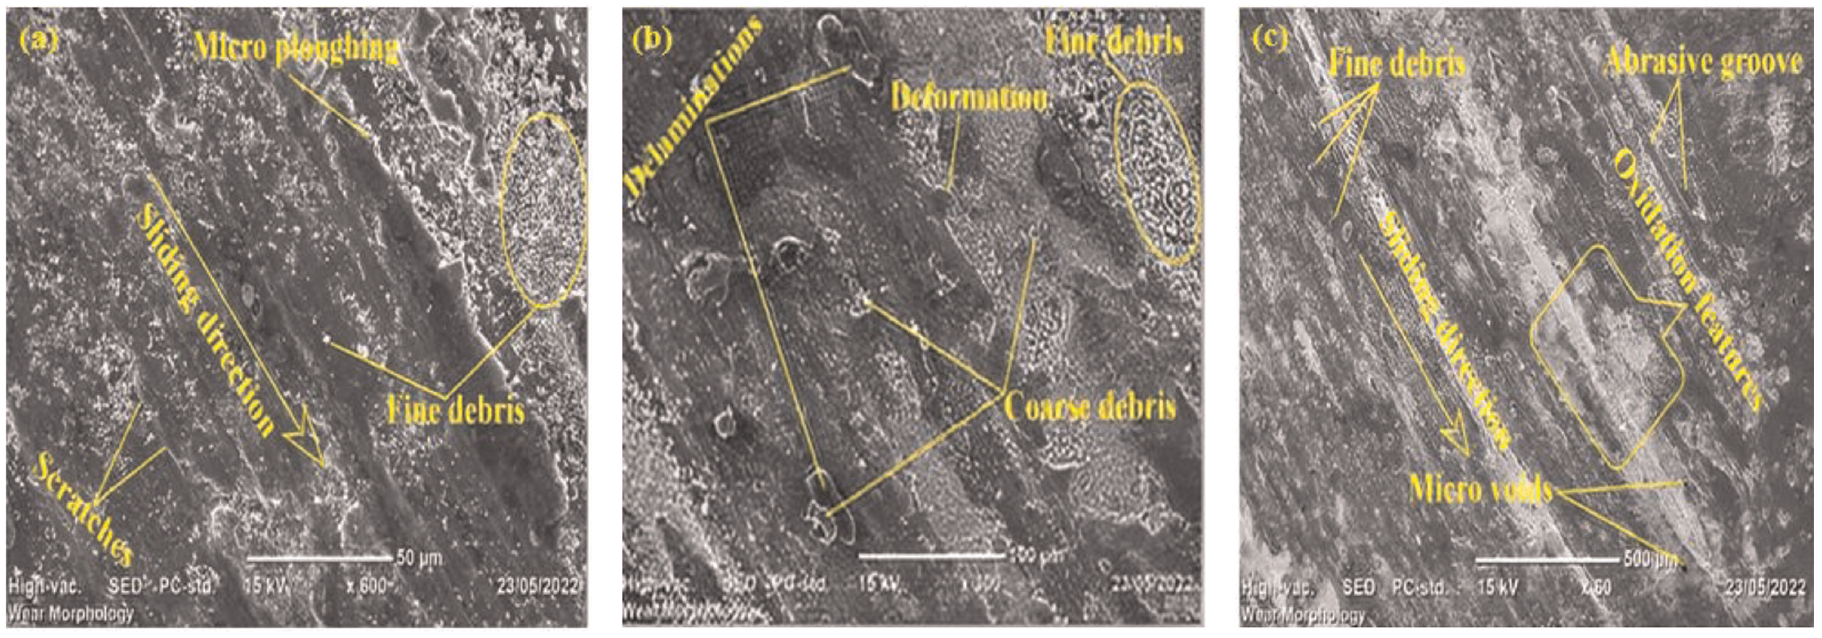
SEM micrographs of wear morphology for optimum composite at different magnifications.
X-Ray diffraction (XRD) analysis
The XRD pattern of the AZ31 powders and AZ31-5, 10, and 15 vol.% SiC composites provide details of the elements in the specimens as illustrated in Figure 6. The silicon carbide an MgO peak are observed among the identified compounds phase based upon the XRD data. Meanwhile, there is no Mg17Al12 peak detected in the XRD pattern which is similarly obtained in AZ31 Mg-alloy reinforced with sub-micron vanadium composites. 16 This might be due to the decomposition of the Mg17Al12 phase and dissolving of Al into Mg alloy matrix during high energy milling process. The presence of oxide phase may be due to heat in the process of milling and sintering of the samples in the atmosphere.

XRD spectrum of MMMCs at different reinforcement content.
Analysis of single objective response
In this study, it mainly focuses on having high strength to weight ratio through reducing the weight besides the fact of desiring high mechanical properties of the materials. Therefore, smaller the better criteria is taken for density and porosity and larger the better for hardness and compressive strength of the material. The analysis for the selected criteria is carried out using equations (1) and (2) as stated in the previous chapter. But the responses variations are observed due to the contribution effect of the process parameter of the powder metallurgy. The density and porosity of the composite are obtained through finding the theoretical and actual density of the materials. In Figure 7, it shows the experimental run vs. the measured values of theoretical and actual density of the materials. For the responses used smaller the better criteria also analyzed using main effect plots and response tables. It shows that the density and porosity is decreasing when the reinforcement percentage decreases. Indeed, density response follows the same trend for the milling time, compaction pressure and sintering temperature. But, porosity is depicted through following the reverse form of the density. The main effect plot at 425°C sintering time, both the density and porosity show abrupt change, that is, the higher and lower values, respectively, relative to other levels.

The density and porosity responses vs. experimental trials.
The response table also shows the grades of influential parameters upon the responses as tabulated below in Tables 7 and 8. The sintering temperature is the first influential parameter up on the density and followed by reinforcement percentage, milling time, and compaction pressure. And for porosity, the reinforcement percentage takes the first rank and followed by sintering temperature, milling time, and compaction pressure.
The response table for density.

The response table for porosity.

The optimum combination of process parameter is identified using main effect plot for individual process parameter. It is obtained as A1B1C3D3, A3B1C3D1, A3B3C3D1, and A3B1C1D1 for compressive strength, hardness, density, and porosity, respectively.
The main effect plot for S/N ratios clarify the influence of process parameters on compressive strength and the hardness in Figures 8(a) and (b). It shows that the hardness and ultimate compressive strength (UCS) property is dependent on different parameters. The UCS of the composite decrease when the reinforcement percentage of SiC increases and sintering time decreases. It is possibly due to reducing the reinforcement percentage of ZrO2 causes to decrease the compressive strength. The milling time from 2 to 4 h decreases compressive strength and increases its value at range of four to six milling hours. This indicates that the size reduction and uniform distribution of powders have an impact on properties of the composite. In addition, it obtains the influential process parameter for better hardness and compressive strength property using main response table. The main response table shows the main factor affect the compression strength is shown in Table 9. The compaction pressure was taken the first grade for influencing the property of compression strength followed by reinforcement percentage, milling time, and sintering temperature. The regression model is constructed using a given experimental values for predicting the response for compression strength as mentioned in equation (13).


Main effect plot for (a) ultimate compression strength, (b) hardness, (c) density, and (d) porosity.
Response table for S/N ratio of compression strength.

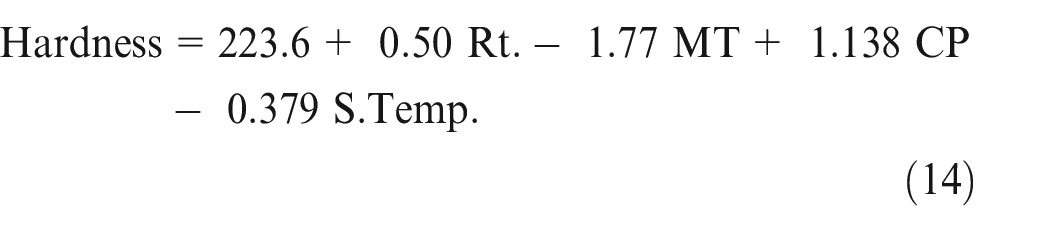
The hardness of the material is reduced when the sintering temperature and milling time increase in Figure 8(b). On the other hand, it shows a direct relation with the compaction pressure and reinforcement percentage, that is, ranges of 10–15 vol.%. Moreover, the response table in Table 10 assures that the compaction pressure has a great impact on the hardness property as the compression strength and followed by reinforcement percentage, sintering temperature, and milling time. The regression model for hardness is used to obtain the predicted values without interaction effect as it stated in equation (14).
Response table for S/N ratio of hardness.

The main effect plot is depicted to show the effects through correlating each process parameters with the test result of the responses as shown below in Figures 8(a–d).
This implies, the reinforcement percentage and sintering temperature have a great impact on the density and porosity than the compaction pressure. It indicates the values of density of the MMMCs is increased as the reinforcement percentage increases. 40 However, it is clearly observed from the response table that compaction pressure has higher impact on hardness and compressive strength.
The bar graphs provide the correlation of the influential parameters with experimental responses is shown in Figures 9 and 10. It provides the values of compressive strength and density of magnesium alloy hybrid composites. In 5 vol.% of SiC reinforced MMMCs, it has recorded as increasing the hardness and compressive strength. The mechanical properties is enhanced based on the fact that the SiC and ZrO2 are working as a barrier to the crack propagation due to better distribution in the magnesium alloy matrix. 40 In Figure 10, it is observed that the density is increased with addition of ZrO2 and followed by SiC in the composites. And also, the increasing in sintering temperature also shows an increment of density in manufactured composites. The theoretical and experimental densities are used to determine the porosities of all samples. Therefore, the addition of micro sized reinforcements has a great impact to increase the density and also porosity of the composites as reported by other literatures. 40
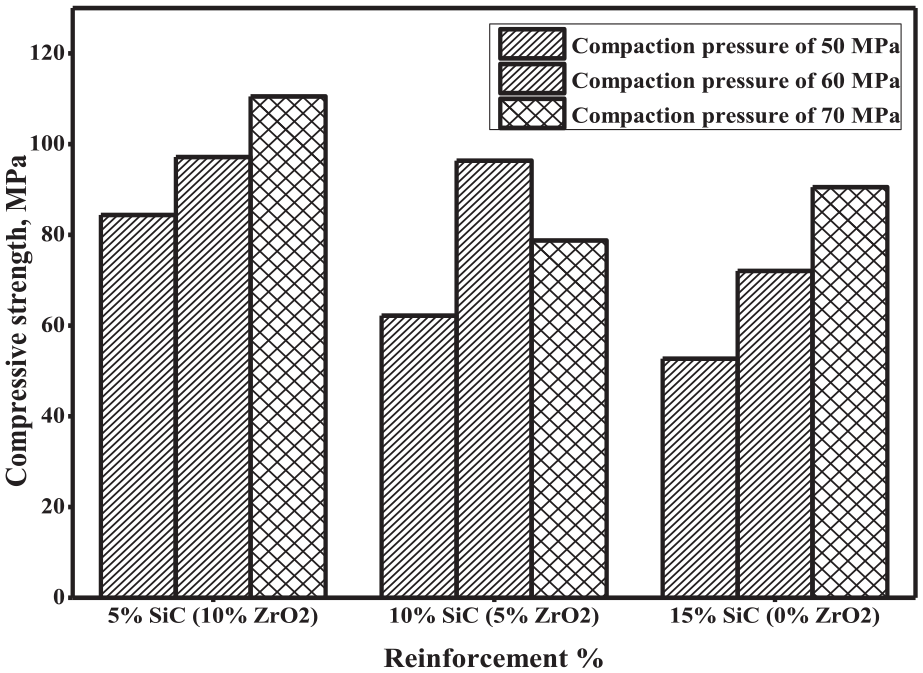
Compression strength versus reinforcement composition of the manufactured composites.

Density versus reinforcement composition of the manufactured composites.
The optimization of process parameter using Taguchi based GRA
In the multi response optimization, the Taguchi based GRA tools are mostly used to determine the optimum response values (Prakash et al. 41 and Hussain et al. 42 ). In this study, the optimization of multi objective response was analyzed using GRA coupled with the Taguchi method in order to determine the optimal level combination of PM process parameter used for composite manufacturing. For optimization, three levels for four process parameters are used as a measuring index to analyze the four responses to obtain optimum level and combination of parameters. The optimal level is highest value that obtained from the values of gray relational grade. The optimal parameter combinations are obtained through mean GRG analysis at each level. This analysis was carried out under the following steps mentioned in the previous chapter using Minitab-17 software (Table 11).
Mean values of the experimental responses.

Signal to noise (S/N) ratio
Robust design is an engineering methodology used to improve productivity during Research and Development (R&D) activities so that high quality products can be developed fast and at low cost. A product or a process is robust if its performance is not affected by the noise factors. And robust design is a procedure used to design products and processes such that their performance is insensitive to noise factors. In this, trial is done to determine product parameters or process factor levels so as to optimize the functional characteristics of products and have minimal sensitivity to noise. The Signal to noise ratio (S/N ratio) is a statistic that combines the mean and variance. The objective in robust design is to minimize the sensitivity of a quality characteristic to noise factors. This is achieved by selecting the factor levels corresponding to the maximum S/N ratio. That is, in setting parameter levels always the S/N ratio is maximized irrespective of the type of response (i.e. maximization or minimization). These S/N ratios are often called objective functions in robust design.
The qualities of measurement are essential for enhancing the signals with considering the uncontrolled variables, that is, noises to reduce in the response results. That provides the responses to have the expected product with optimum properties. The qualifications are “smaller the better,”“nominal value the better,” and “the larger the better.” In this study, the responses, that is, density, hardness, ultimate compressive strength were taken as response for L9 OA design of experiment. Due to this, the theoretical and actual density as well as the porosity and relative density were determined using equations (7)–(10) as mentioned in the previous chapter. Statistical formula of “the smaller the better” was utilized for porosity and actual density to determine the performance quality of the composites. Since the actual density and porosity were estimated to provide the property of high strength to weight ratio in product. The S/N ratios for ‘smaller the better’ condition was obtained to minimize the noise factors of the porosity and actual density. Meanwhile, the composite hardness and ultimate compressive strength responses were analyzed using ‘larger the better’ statistical formula as expected to have higher properties. The S/N ratios for each response were tabulated in Table 12.
S/N ratio of the experimental responses.

Normalizing the data
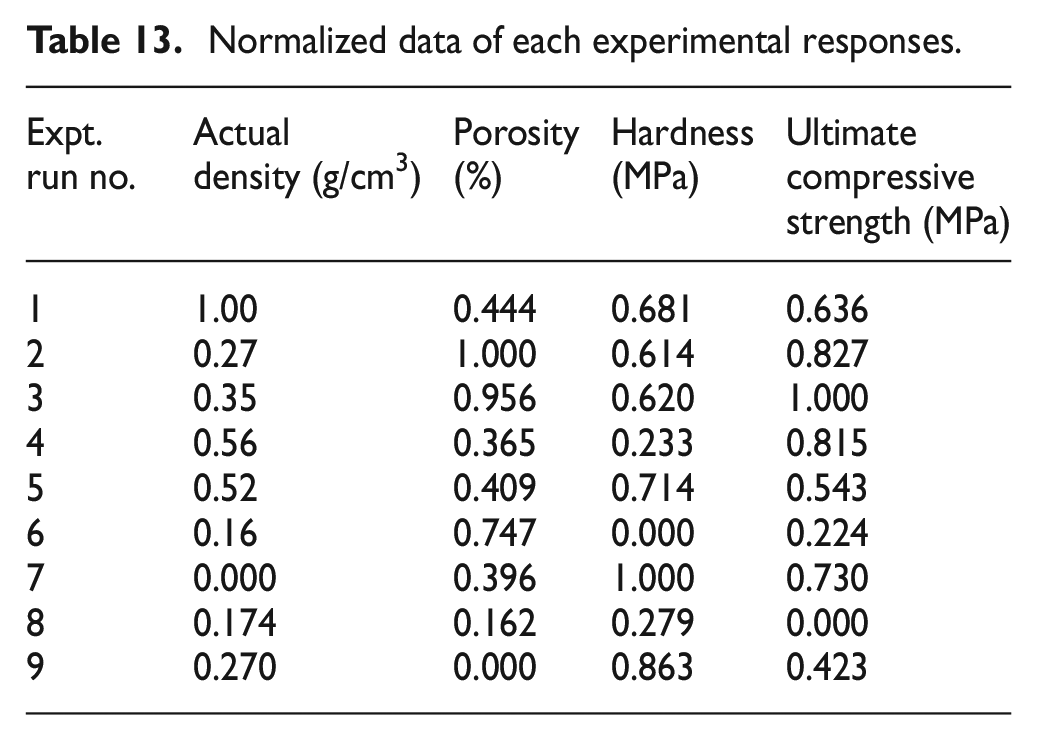
In this step, the data obtained from S/N ratio is normalized in order to scale it for further analysis by eliminating the effects due to variability and different unit. Therefore, all experimental run of S/N ratio values is normalized between 0 and 1 using equations (3) and (4) as mentioned in the previous chapters. The transformed responses are tabulated in Table 13.
Normalized data of each experimental responses.
Gray relational coefficient and gray relational grade
This step is used to determine GRC values which used to transform the response data as single response for further analysis. GRC is calculated using normalized S/N ratio data to figure out the relation of actual and experimental data using equation (5). The deviation sequence values for each response are tabulated under Table 14 including GRC and GRG, respectively. The maximum and minimum values are taken as 0 and 1 with 0.5 values for coefficient of distinguish for each response.
Deviation sequence of the normalized S/N ratio.

The values which transformed into single response using equation (6) is called Gray relational grade (GRG.). From those, the highest value of GRG is taken the first rank for nine experimental run and last rank is provided to the lowest value. In Figure 11, the GRG values, obtained using equation (6), with their corresponding ranks is defined for the MMMCs. Therefore, the highest value of GRG for this experiment is experiment run number 3 due to having high values which takes the first rank from nine experiment run as stated in Figure 11. For this experiment, the optimum level of process parameter among design of experiment value is A1B3C3D3.

GRG values and rank for the responses.
Meanwhile, the mean value of GRG is used to obtain influential factor and optimum level combination from each process parameters using main effect Table 15 shown. The optimum level combination of parameter based on responses has been found from main effect table is: factor A at level 1, that is reinforcement percentage at 5% SiC and 10% ZrO2; factor B at level 1, that is, milling time at 2 h; factor C at level 3, that is, compaction pressure at 70 MPa and factor D at level 2, that is, sintering temperature at 425°C. As a result, the optimal levels combination for PM process parameter has been found as A1B1C3D2. In addition, the influential process parameter was obtained from main effect table of GRG values. It is computed as Rt. Percentage was the first rank and followed by compaction pressure depend on the contribution of response value. The mean GRC for compression strength is 0.601 which is the highest among all the responses. This implies, the compression strength has the strong interaction with all process parameters relative to the density, hardness, and porosity. Therefore, the factors, which used to run the experiment, can easily influence the compression strength than other responses.
Response table of mean GRG and * is optimum level.

The reinforcement percentage is the strongest among controlled process parameter from value of mean GRG difference between low and high level. It was obtained as high as 0.1982 followed by compaction pressure, milling time and sintering temperature, respectively, as shown below in Table 15. It can be interpreted as the reinforcement percentage has a strong correlation with the responses, that is, density, porosity, hardness, and compression strength of MMMCs. And, it is followed by compaction pressure as the second process parameter that influences the responses.
Evaluation/analysis of process parameter of powder metallurgy process
The responses of the process parameters are analyzed and evaluated further using different techniques to develop a regression model. Different illustration and diagrams are used for implementing the result values for the response.
3D surface plot for GRG and predicted process parameters
The desired response values correlate with the two predicted parameters can be investigated using 3D surface plot. Figure 12 show the 3D surface plots for GRG wrt two predicted process parameters of PM. The 3D surface plot for GRG variation w.r.t Rt. Percentage and milling time is shown below in Figure 12(a). The plot illustrates as GRG value increases with increasing the milling time and reducing the composition percentage of reinforcements. It is also nearly observed the same interpretation as the above in Figure 12(b and c). The increment in composition of the reinforcement percentage proportionally to compaction pressure (and indirectly to sintering temperature) makes the value of GRG to decrease. The time takes for milling the powder from 2 to 6 h lead to increment the value of GRG as illustrated in Figure 12(c and d). And also, increasing the compaction pressure proportion to the sintering temperature provides better response for GRG in Figure 12(f). The 3D surface plots of GRG responses show non uniform changes in the slope of curve that predicts the possibility of occurring the interaction effect along the process parameter.

(a)-(f) The 3D surface plot of predicted process parameters on the GRG response.
Contour plot for GRG for predicted process parameters
2D topographical map of a 3D surface, that is contour plot, is provided using two predicted parameters on the y axis and a desired response value as contours in z axis. It is used in order to analyze the interaction effect among the parameters on given response and obtain the range for optimal responses. In Figure 13, the contour plots for response GRG using two predicted process parameters are shown below. The contour plot of the response for GRG wrt the milling time and reinforcement percentage in Figure 13(a) indicated that the maximum GRG value is in the range of 0.7 and above with the high level of milling time with low level of Rt. %. And, it also shows the possible interaction effect between the process parameters. In Figure 13(b), it shows contour plot for GRG by varying Rt.% and compaction pressure parameters. By varying these two parameters, maximum GRG value is in the range of 0.7 and above. The predicted parameters of sintering temperature wrt the Rt. % to obtain the GRG value in the range of 0.7 and above as shown in the Figure 13(c). The contour plot indicates the compaction pressure, milling time, and also sintering temperature have high influence on the response of GRG over percentage of reinforcement. And, it shows the possible interaction effect between parameters on GRG due to the existence of curvature formation in Figure 13(a–c). The compaction pressure with respect to the milling time provides higher value of GRG in range of 0.7 and above as shown in Figure 13(d). It indicates that the compaction pressure and milling time have higher effect on the response of GRG. The milling time and compaction pressure wrt the sintering temperature have been shown in Figure 13(e) and (f), respectively. The highest GRG values for both are in range of 0.7 and above. As the contour plot indicated that the compaction pressure has high influence on GRG response relative to milling time.

(a)-(f) The contour plot of predicted process parameters on the GRG response.
Confirmation test for optimum parameters
The optimal level combination, that is, A1B1C3D2 of process parameters is taken for confirmation test of various properties since it is essential to confirm with the experimental tests. The results of the confirmation experiment are listed in Table 16 with the optimal process parameters of powder metallurgy A1B1C3D2 that is used to manufacture the optimum sample.
Results of confirmation test.

The combination of process parameter at optimal level, that is, experimental density, porosity, compressive strength, and hardness value are 2.058 g/cm3, 0.138, 110.17 MPa, and 1288.888 MPa, respectively. Hence, the properties, that is, experimental density, porosity, compressive strength, and hardness value of MMMCs are improved by using GRA integrated with Taguchi method.
Regression model for GRG
The model for the GRG responses is constructed to predict the response values through considering the main and interaction effect of the process parameters. The regression equation developed for the GRG with considering interaction effect among the process parameters is stated below in equation (15).

As the model summary showed that the R-Square values of the model is 92% so it is significant since it lied between 90% and 100%, that is, it is nearly approached to 1 value. This implies, the model has an efficiency to predict the response values at any parameter values. In Figure 14, the distribution of the normal probability plot shows the values are not far from a theoretical normal distribution, that is, it is tends to form normal distribution when relative to residuals values.

Normal distribution of the GRG values.
The predicted GRG values obtained using the above model equation (3) are calculated for each experimental run. And, it is used to analyze the response of GRG with the experimental values of GRG. It is shown on that of the experimental and predicted GRG graph as depicted in Figure 15 are nearly same. Due to this, the influences of interaction effects of process parameters have signwearificant influence on GRG responses.

The predicted and experimental GRG with experimental trial numbers.
Wear test
The wear resistance of the MMMCs is evaluated through analyzing the wear loss and rate as well as the friction coefficient of the materials. In this study, the wear test is conducted on the optimum and mono hybrid MMMCs samples using (DUCOM TR-20 MICRO) pin-on-disc equipment. The wear behavior was investigated under loading of 30 N and sliding speed of 250 rpm on 25 mm diameter wear truck at 5 min running time. The weight (mass) loss is obtained using the weight difference of the samples, that is before and after conducting wear test and the values is used to calculate the wear rate of the samples using equation (13) as mention in previous chapter. The results of the weight loss and wear rate of hybrid and mono hybrid samples are tabulated below in Table 17.
Mass loss and wear rate of the samples at specified load.

The reinforcements of MMMCs made the matrix to be stronger and resist the wear rates during the Dry sliding wear test. Form Table 16, low mass loss is observed when the volume percentage of silicon carbide decreases relatively to the vol.% of zirconium dioxide in the composite. Similarly, it is also showed the same ideas in Figure 16. The wear rate is also high due to taking an average loading value, that is, the higher loading with high sliding speed make the wear rate higher due to the frictional heat at contact surface of pin and disc. Similar results of the study are obtained by other researchers (Arif et al. 43 ).
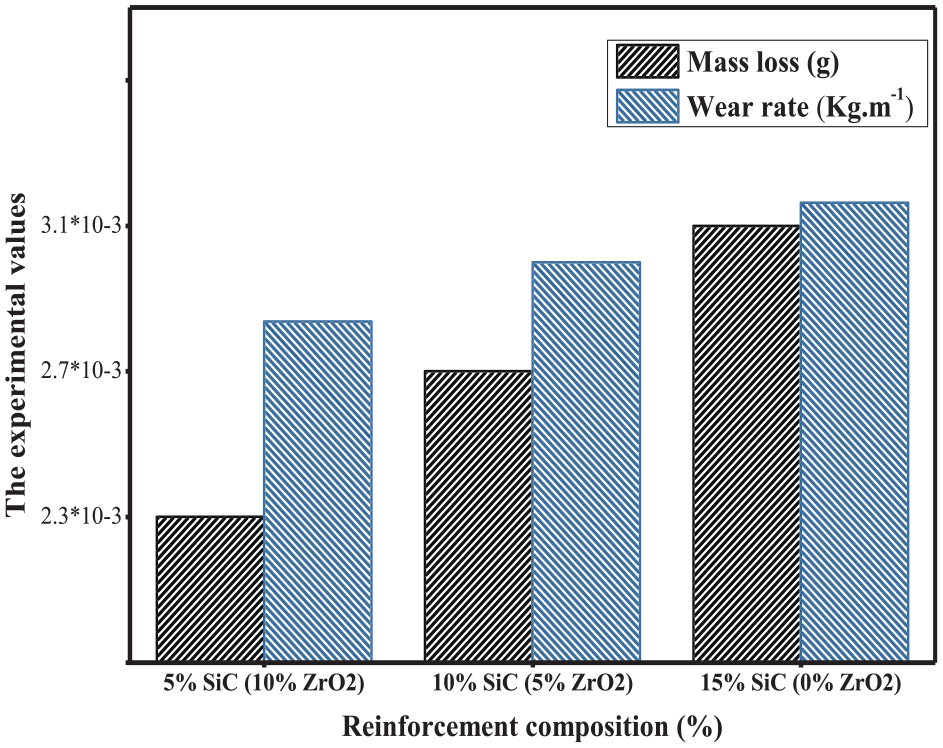
Mass loss and wear rate of MMMCs in different reinforcement percentage.
The variation of wear rate is clearly observed for different volume percentage of SiC as shown in Figure 16. The wear rate of hybrid MMMCs was lower than the mono hybrid MMMCs at a constant process parameter of 30 N load and 250 rpm sliding speed for 5 min at room temperature. As shown in Table 17, The 5 vol.% of SiC have a low wear rate than of both 10 and 15 vol.% of SiC reinforced MMMCs at a 30 N constant applied load. The wear rate is gradually reduced in composite of having high volume percentage of ZrO2 as shown in the graphs of Figure 16. However, the wear rate of the composite has exhibited a good improvement with addition of ZrO2 reinforcement which have provided the same result with Aydin and Sun. 44 Indeed, the hybridization of the particles enhances mechanical properties as well wear resistance of the composites. The enhancement of the wear resistance is expected due to silicon carbide and zirconia reinforcements. Both are harder and strong in nature that makes the base metal to resist the wear. When the percentages of zirconia increased and uniformly distributed all over the matrix, the wear resistance of the composites also increases. The improvement of the wear resistance performance in percentile for 10 vol.% SiC and 5 vol.% are around 12.9% and 25.8%, respectively, compared to mono hybrid MMMCs. In general, the property of composite materials enhances with the increasing the type and contents of the reinforcement. This is due to the fact that the hardness and strength of the composite enhances based up on the contents of the reinforcements. Even though, it has a tendency to build lubricant film cause of temperature existence during wear test. 45 However, it is better to further investigate the wear behavior or resistance for the given composite using optimization of parameters that makes to observe the effects in detail.
Conclusions
In this study, the effect of powder metallurgy process parameters is investigated on multi responses of SiC, ZrO2, and MoS2 reinforced AZ31 Mg alloy composite based on the GRG integrated Taguchi method. Surface morphology at SEM shows the reinforcement distribution in Mg alloy matrix were uniform and brittle and ductile fracturing were noticed. XRD also has provided the data of no existence of intermetallic compound phase. The optimal process parameter combination for responses, that is, density, porosity, hardness, and ultimate compression strength is obtained as A1B1C3D2 based on the response table for mean GRG. That means the optimal process parameters are reinforcement percentage at 5 vol.%, milling time at 2 h, compaction pressure at 70 MPa, and sintering at 425°C. The porosity has a strong relation with the process parameters as it has the highest mean GRC value (i.e. 0.589) compared to the compression strength, hardness, and density. This implies the porosity have easily influenced by the selected factors. Reinforcement percentage has a strong correlation among the controlled parameters with the MMMCs responses. As response table for GRG shows the reinforcement percentage is the most influential process parameters that followed by compaction pressure, milling time, and sintering temperature sequentially. The 3D surface plots and the contour plot also depicted that the reinforcement percentage has significantly affect the GRG at 5 vol.% and 70 MPa for compaction pressure. The interaction effects between parameter on GRG are insignificant since the experimental and predicted GRG are nearly same. Meanwhile, the confirmation test responds that the density and porosity, hardness as well as the compressive strength values of MMMCs are enhanced through GRA integrated with Taguchi method. And, the wear resistance is enhanced by 12.9% and 25.8% for 10 vol.% SiC and 5 vol.%, respectively. Therefore, the magnesium alloy MMCs have brought a better mechanical and tribological property for the different application areas.
Footnotes
Acknowledgements
The authors would like to acknowledge Adama Science and Technology University for the experimental facilities. The authors would also like to acknowledge Dr. Gaurav Gupta for his contribution.
Handling Editor: Chenhui Liang
Author contributions
Betelhem Teklehaymanot Haylemaryam (Writing of the manuscript), Devendra Kumar Sinha (Data Analysis and Optimization), Samuel Kefyalew (Testing of samples), Satyam Shivam Gautam (Review and Editing), Santosh Kumar (Review and Editing), and Sarang Pande (Review and Editing)
Declaration of conflicting interests
The author(s) declared the following potential conflicts of interest with respect to the research, authorship, and/or publication of this article: The authors declare that manuscript has not been published or communicated anywhere.
Funding
The author(s) received no financial support for the research, authorship, and/or publication of this article.
Consent to participate
All the authors have participated in the research work.
Consent for publication
All the authors have already given the consent for publication.
Availability of materials
The datasets used and/or analyzed during the current study are available from the corresponding author on reasonable request.