
Abstract
Classification is a critical task in many fields, including signal processing and data analysis. The accuracy and stability of classification results can be improved by selecting the most relevant features from the data. In this paper, a new criterion for feature selection using wrapper method is proposed, which is based on the evaluation of the classification results according to the accuracy and stability (standard deviation) of each class and the number of selected features. The proposed method is evaluated using Random Forest (RF) and Ant Colony Optimization (ACO) algorithms on a benchmark dataset. Results show that the proposed method outperforms classical feature selection methods in terms of accuracy and stability of classification results, especially for the difficult-to-classify combined damage class. This study demonstrates the effectiveness of the proposed new wrapper feature selection criterion to improve the performance of classification algorithms with higher stability (STD: C1 = 0.5, C2 = 0.8, C3 = 0.6, C4 = 1.8) and better accuracy (average C1 = 98.5%, C2 = 96.6%, C3 = 9.5%, C4 = 93) for the both; the statoric current and the vibration signal compared to other techniques. Machine learning methods had proven their efficiency in time-varying machines fault diagnosis when taking vibration signals and statoric currents extracted features as inputs. However, the use of the both demonstrated a higher robustness and a remarkable superiority.
Keywords
Introduction
Rotating machinery, such as pumps, fans, compressors, generators, and motors, plays a crucial role in various industrial and commercial applications. 1 Despite their importance, the continuous operation of rotating machinery can result in various types of faults, including bearing faults. 2 Bearings are critical components in rotating machinery and their failure can cause significant damage to the machinery and surrounding equipment. 3 Bearing faults can occur due to a variety of causes, including improper lubrication, misalignment, excessive loads, and manufacturing defects. 1 These faults can result in increased vibration, noise, and heat, which can be detected by monitoring the vibration signals or current signals of the machinery. The early detection of bearing faults is essential for ensuring the safe and efficient operation of the machinery and preventing catastrophic failures. 4
To address this issue, many condition monitoring technique are proposed. 5 Most diagnostic techniques are based on signal processing techniques, which is divided into three steps: processing the raw data, extracting the features, and creating the model,6,7 but these classical techniques have several limitations.8,9 Since signal processing techniques are based on the frequency signature, they cannot be used for fault identification and location (two faults may have the same frequency signature, such as gears). 10 Recently, many researchers have focused to develop a model, based upon a new feature extraction techniques in signal processing using morphological filter such as enhanced morphological difference filtering (EMDF) to diagnosis bearings failures, 11 a novel multi-scale morphological filtering algorithm based on the entropy threshold (IET-MMF) to extract effectiveness fault feature information and perform early fault detection of bearings, 12 and unbiased-autocorrelation morphological filter (UAMF) to remove random impulse interference by combining a morphological filter with an autoregressive filter, 11 these techniques are successfully applied in fault feature extraction information. But they still have given certain restrictions, because the conventional selection of the structural element (SE) scale parameters of morphological based on sliding window, lead to complicated and inappropriate select morphological filtering calculation process for bearings under high background noise.
To improve the performance of developing the robust and adaptive SE scale for bearings fault feature extraction information, an adaptive time varying morphological filtering (ATVMF) algorithm is proposed for adaptive extraction of impulse features. 13 The ATVMF uses a new time-varying SE strategy to adaptively determine the shape and scale of SE according to the inherent characteristics of the vibration signal and stator currents, and adopts a new morphology hat product operator (MHPO) 14 to extract fault-related impulse features from vibration signals and stator currents. This model allows the ATVMF to display significantly enhanced impulse feature extraction capability and higher computational efficiency compared to on traditional methods.
In order to enhance the robustness of numbers and nature of features extraction from ATVMF algorithm that can’t affect classification performance and accuracy. For this purpose, the researchers proposed to use feature selection algorithms before the classification stage.15–17 Feature selection, as a dimensionality reduction techniques, such as a particle swarm optimization, 18 Genetic Algorithm, 19 Marine Predators Algorithm (MPA), 20 Henry Gas Solubility Optimization (HGSO), 21 Emperor Penguin Optimizer (EPO), 22 Slime Mould Algorithm (SMA), 23 and Tree Seed Algorithm (TSA). 24 However, these algorithms have some drawbacks and suffering from a high computational complexity. By contrast, Wrapper methods called Ant Colony Optimization (ACO) 25 it is require a learning algorithm and overcome the previous limitations which leads to a higher accuracy but also a much higher computation time and aims to choose a small subset of the relevant features from the original ones by removing irrelevant, redundant, or noisy features. Therefore, the obtained feature selection are feed into the Random forest learning algorithms for feature classification. 26
In order to overcome the shortcomings of conventional signal processing-based feature extraction techniques and to enhance the reliability of fault identification, a new wrapper feature selection criterion based on Adaptive time-varying morphological filtering (ATVMF
We propose a new feature selection criterion based on stability and accuracy of each class. To achieve this, we conduct 10 tests on the classifier to evaluate its performance.
The average accuracy and stability are then calculated by combining two costs: cost 1 and 2, which represent measures of mean accuracy and stability for each class. Cost 3 is the ratio of selected features to the total number of features.
The final cost is calculated using three previous equations of cost. The feature selection process is carried out using the ant colony optimization algorithm (ACO), which is a swarm intelligence optimization method that mimics the behavior of ants searching for food. Finally, the classification results are evaluated using the random forest classifier (RF), which is an ensemble learning method that creates multiple decision trees and combines their results to obtain a final prediction and compare it with similar classifier.
The method was tested on data collected under varying loads, force, and speeds and showed a high performance.
Theoretical background
Adaptive time-varying morphological filtering
Feature extraction is commonly concerned with highlighting important information to help the classification task. In the proposed system we used a new method of extraction named Adaptive time-varying morphological filtering (ATVMF) to extract time and frequency domains features.
The ATVMF algorithm is a method for extracting impulse features from vibration signals in rolling bearings. It uses an adaptive time-varying structure element (SE) strategy and a new morphology hat product operator (MHPO) to identify fault-related impulse features. The process of the ATVMF algorithm is as follows:
Collect the vibration acceleration signal.
Create a series of adaptive SEs based on the vibration signal.
Divide the vibration signal into small segments and use the MHPO and time-varying SE to extract fault-related impulse features using the ATVMF method. 14
This approach provides improved impulse feature extraction and computational efficiency compared to traditional methods.
Here’s a mathematical representation of the ATVMF process:
Initialization: The ATVMF algorithm starts by initializing the morphological filter, usually by defining a structuring element (SE) and an operation (such as dilation or erosion).
Time-varying adaptation: At each time step, the morphological filter is adapted based on the current signal conditions. The adaptation process is typically implemented as a time-varying filter, given by:

Where:
The time-varying gain can be computed based on various criteria, such as signal properties or statistical models.
Filtering: The signal is filtered using the adapted morphological filter:

Where:
This equation represents the erosion operation, where the minimum value in the neighborhood defined by the structuring element is subtracted from the current value of the input signal. The dilation operation is performed by reversing the order of subtraction in the above equation. 13
ATVMF is a powerful signal processing technique that can effectively handle changing signal conditions and produce high-quality results. The key to the success of ATVMF is the ability to adapt the morphological filter over time to changing signal conditions, which makes it well suited for many signal processing tasks (Figure 1). 13

Flowchart of the ATVMF method for bearing fault diagnosis.
Ant Colony Optimization for feature selection
Feature selection means selecting and retaining only the most important features in the model. In wrapper method, the feature selection algorithm exits as a wrapper around the predictive model algorithm and uses the same model to select best features. Though computationally expensive and prone to over fitting, gives better performance.27,28
The Ant Colony Optimization algorithm is inspired by the behavior of ants in finding food. Ants use pheromones to communicate the path to food, with the quantity of pheromones laid depending on the distance, quantity, and quality of the food. When an ant detects a pheromone trail, it is likely to follow it and lay more pheromones, strengthening the trail and making it more attractive to other ants. This creates a positive feedback loop where the most attractive path is the one with the highest concentration of pheromones. This behavior is applied in optimization problems, where the algorithm finds the most efficient path.
Ant Colony Optimization (ACO) is a meta-heuristic algorithm proposed to solve combinatorial optimization problems. It is based on the behavior of ants in finding food sources, using pheromones to communicate the quality of a path. 29 The ACO was initially used to solve the Traveling Salesman Problem and has since been applied to other optimization problems like data mining, telecommunications networks, and vehicle routing. It has been shown to be effective in finding good solutions (Figure 2). 30
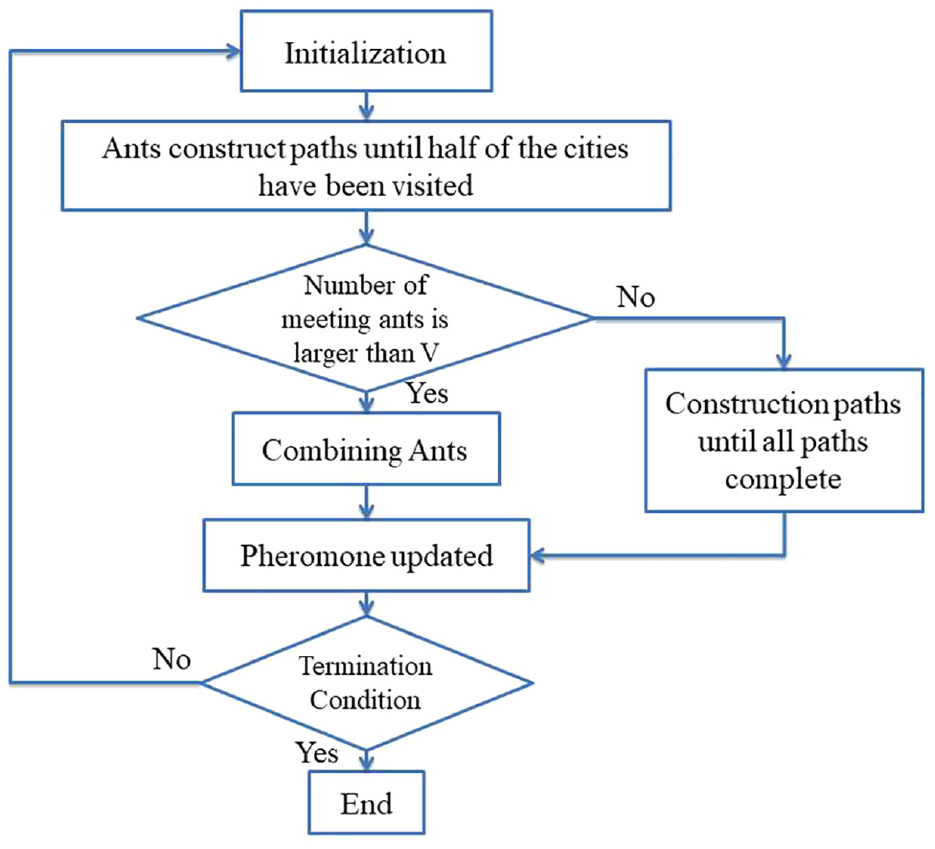
Ant Colony Optimization algorithm flowchart.
The ACO algorithm consists of the following steps:
Initialization: The algorithm starts by initializing the pheromone trail on all edges in the solution space to a small positive value.
Solution construction: At each iteration, each ant constructs a solution by visiting a series of cities (or nodes) based on a probability rule that balances exploitation and exploration. The probability of choosing a particular edge is given by:
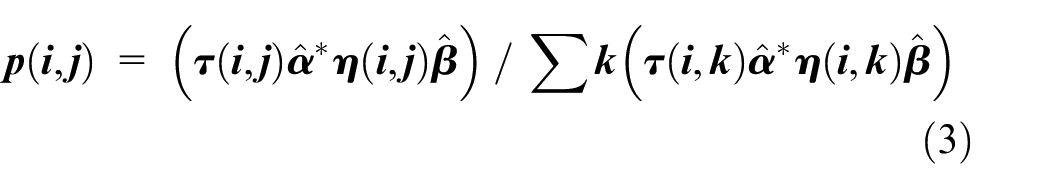
Where:
Pheromone update: After all ants have finished constructing solutions, the pheromone trail is updated using the following rule:

Where:
The above equations describe the three categories of the Ant System (AS) optimization algorithm: ant-quantity, ant-density, and ant-cycle.
The ant-quantity algorithm updates the pheromone trail after each step, and the pheromone quantity per unit of length is given by equation (5).
The ant-density algorithm updates the pheromone trail after each step, and the pheromone quantity per unit of length is given by equation (6). Q is a constant.
The ant-cycle algorithm updates the pheromone trail at the end of the tour. The pheromone quantity per unit of length is given by equation (7).
Note: Equations (5) and (7) both use the same formula for the pheromone update rule, but they apply it at different times.
ANT-Quantity:

ANT-Density:

ANT-cycle:

The ACO algorithm is a simple and effective approach for solving optimization problems that can be applied to a wide range of real-world problems. 31
In our work we interest our focus at classification using Random forest to get the best results of accuracy.
Random Forest for automatically classification
In the past few years, Deep Neural Networks (DNNs) have shown remarkable results in various application domains, including bearing problems. However, they have several disadvantages, including the need for a large labeled dataset, the complexity of hyper parameter tuning, the difficulty of training, and sensitivity to outliers or missing data.
In this paper, we adopted the random forest algorithm, which is a supervised machine-learning method suitable for binary and multiclass problems. 32 It has been applied to a range of problems in various domains and has several desirable properties: robust to noise/outliers, fast, provides useful error information, simple to deploy (few hyper parameters), easy to parallelize, and can handle missing data. The main characteristics of this algorithm are:
Ensemble method combining multiple decision trees
Each tree in the forest votes for the best prediction
Avoids over-fitting by de-correlating trees through random feature selection
Handles missing data and non-linear relationships between features and target variable.
Can handle both binary and multi-class problems
Has been applied to various domains, such as gene selection, remote sensing, and protein prediction.
The equation used in Random Forest is the Gini Impurity, which is used to determine the quality of a split in the decision tree. The Gini Impurity is a measure of the probability of misclassifying a randomly chosen element from the dataset. It is defined as:

Where
The random forest algorithm is an ensemble learning technique that combines multiple decision trees to form a stronger model. The trees are trained on different subsets of the data and features, reducing over fitting and improving accuracy. 33 During prediction, the class with the majority vote from all trees is assigned to the input sample as shown in Figure 3.

General schematic diagram of the random forest classifier.
Experimental study
Data set
The benchmark dataset for bearing fault diagnosis described in Lessmeier et al. 34 consists of synchronously measured currents and vibration signals from six healthy bearings and 26 faulty bearings. Vibration and the stator currents were filtered and sampled at 64 kHz. The dataset includes both artificially induced and real damages (12 have artificially induced damages and 14 have real damages).
This paper focuses on diagnosing real bearing damages using the test data provided by a valuable dataset. The dataset includes four classes: healthy with severity condition operating, outer race, and inner race damage, as well as combined damage (see Tables 1 and 2). The detailed description of the datasets can be found in Lessmeier et al. 34 (Figure 4).
Categorization of datasets.

Operating parameters.


Experimental test ring.
The data sets (e.g. K001) consist of 80 measurements, each lasting 4 s, for the operating conditions listed in Table 2. The operating conditions (such as speed, torque, and radial force) vary among the diverse datasets.
Discussion results and comparative study
The suggested method for classifying bearing faults consists of three main steps, summarized in the flowchart in Figure 5.
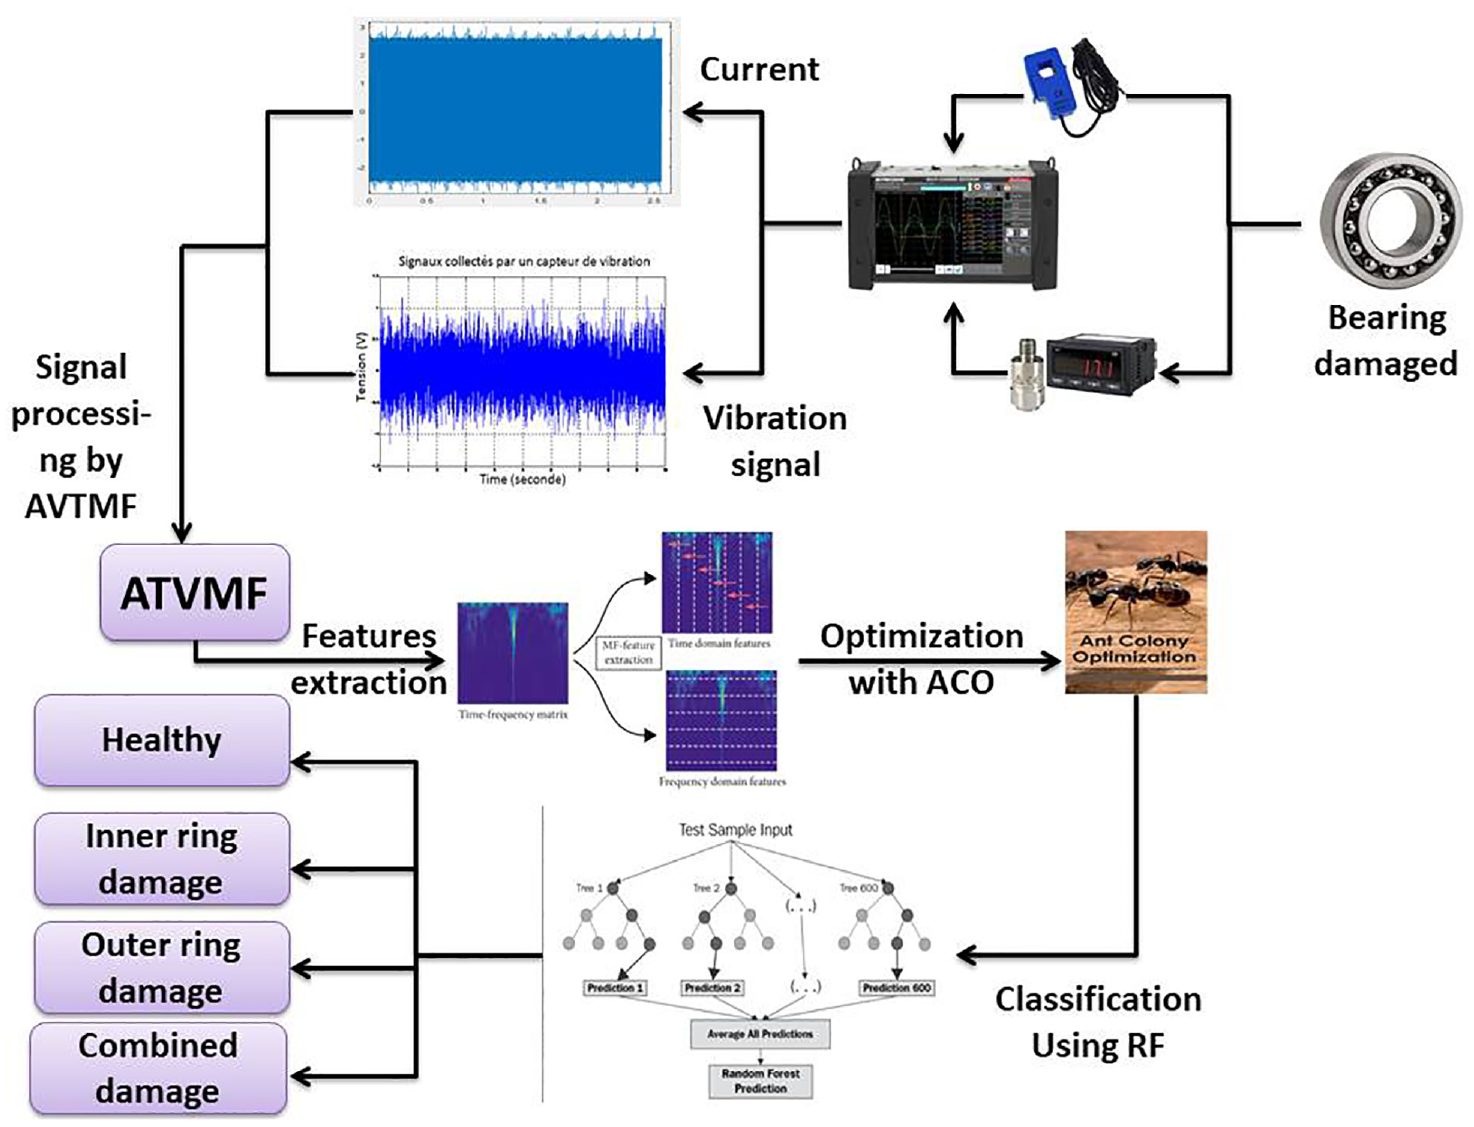
Flowchart of proposed method.
Features extraction based on adaptive ATVMF
Our method is carried on current and vibration database noted that the damage of this dataset is real damage caused by accelerated lifetime test. The dataset consists of healthy, inner ring damage, outer ring damage, and combined damage. As shown from Figures 6 and 7 we cannot distinguish the state of bearings because the fault-related impulse hidden by the noise. Firstly, we start by processing the signals by ATVMF, the signals of the four states are then decomposed by ATVMF after processing these signals. Secondly, the 20 statistical feature as illustrated in Table 3 are extracted in the time and frequency domain to construct the fault-related impulse features for stators currents and vibrations signals.

Original stator currents.

Original vibration signal.
Time domain and frequency domain features extracted.

Feature selection and classification using classical wrapper method
Statistical features are extracted from ATVMF in the time and frequency domain in currents stators and vibration signal, lead to high dimensionality and high complexity of the extracted feature set, it is inherently difficult to select the most effective features that can be applied for bearings condition monitoring, which generally leads to inadequate detection and classification. To address this issue, the optimization step is introduced in order to selecting the relevant parameters and discarding those that are redundant. Hence, in order to enhance the robustness and effectiveness of proposed approach, a comparison carried out between RF in tandem with ACO and multiple classifiers (KNN, DT, RF, NB, and SVM) in tandem with optimization algorithms (EPO, HGSO, MPA, and TSA). The obtained results of these techniques were evaluated based on global accuracy and standard deviation (std) for 10 tests.
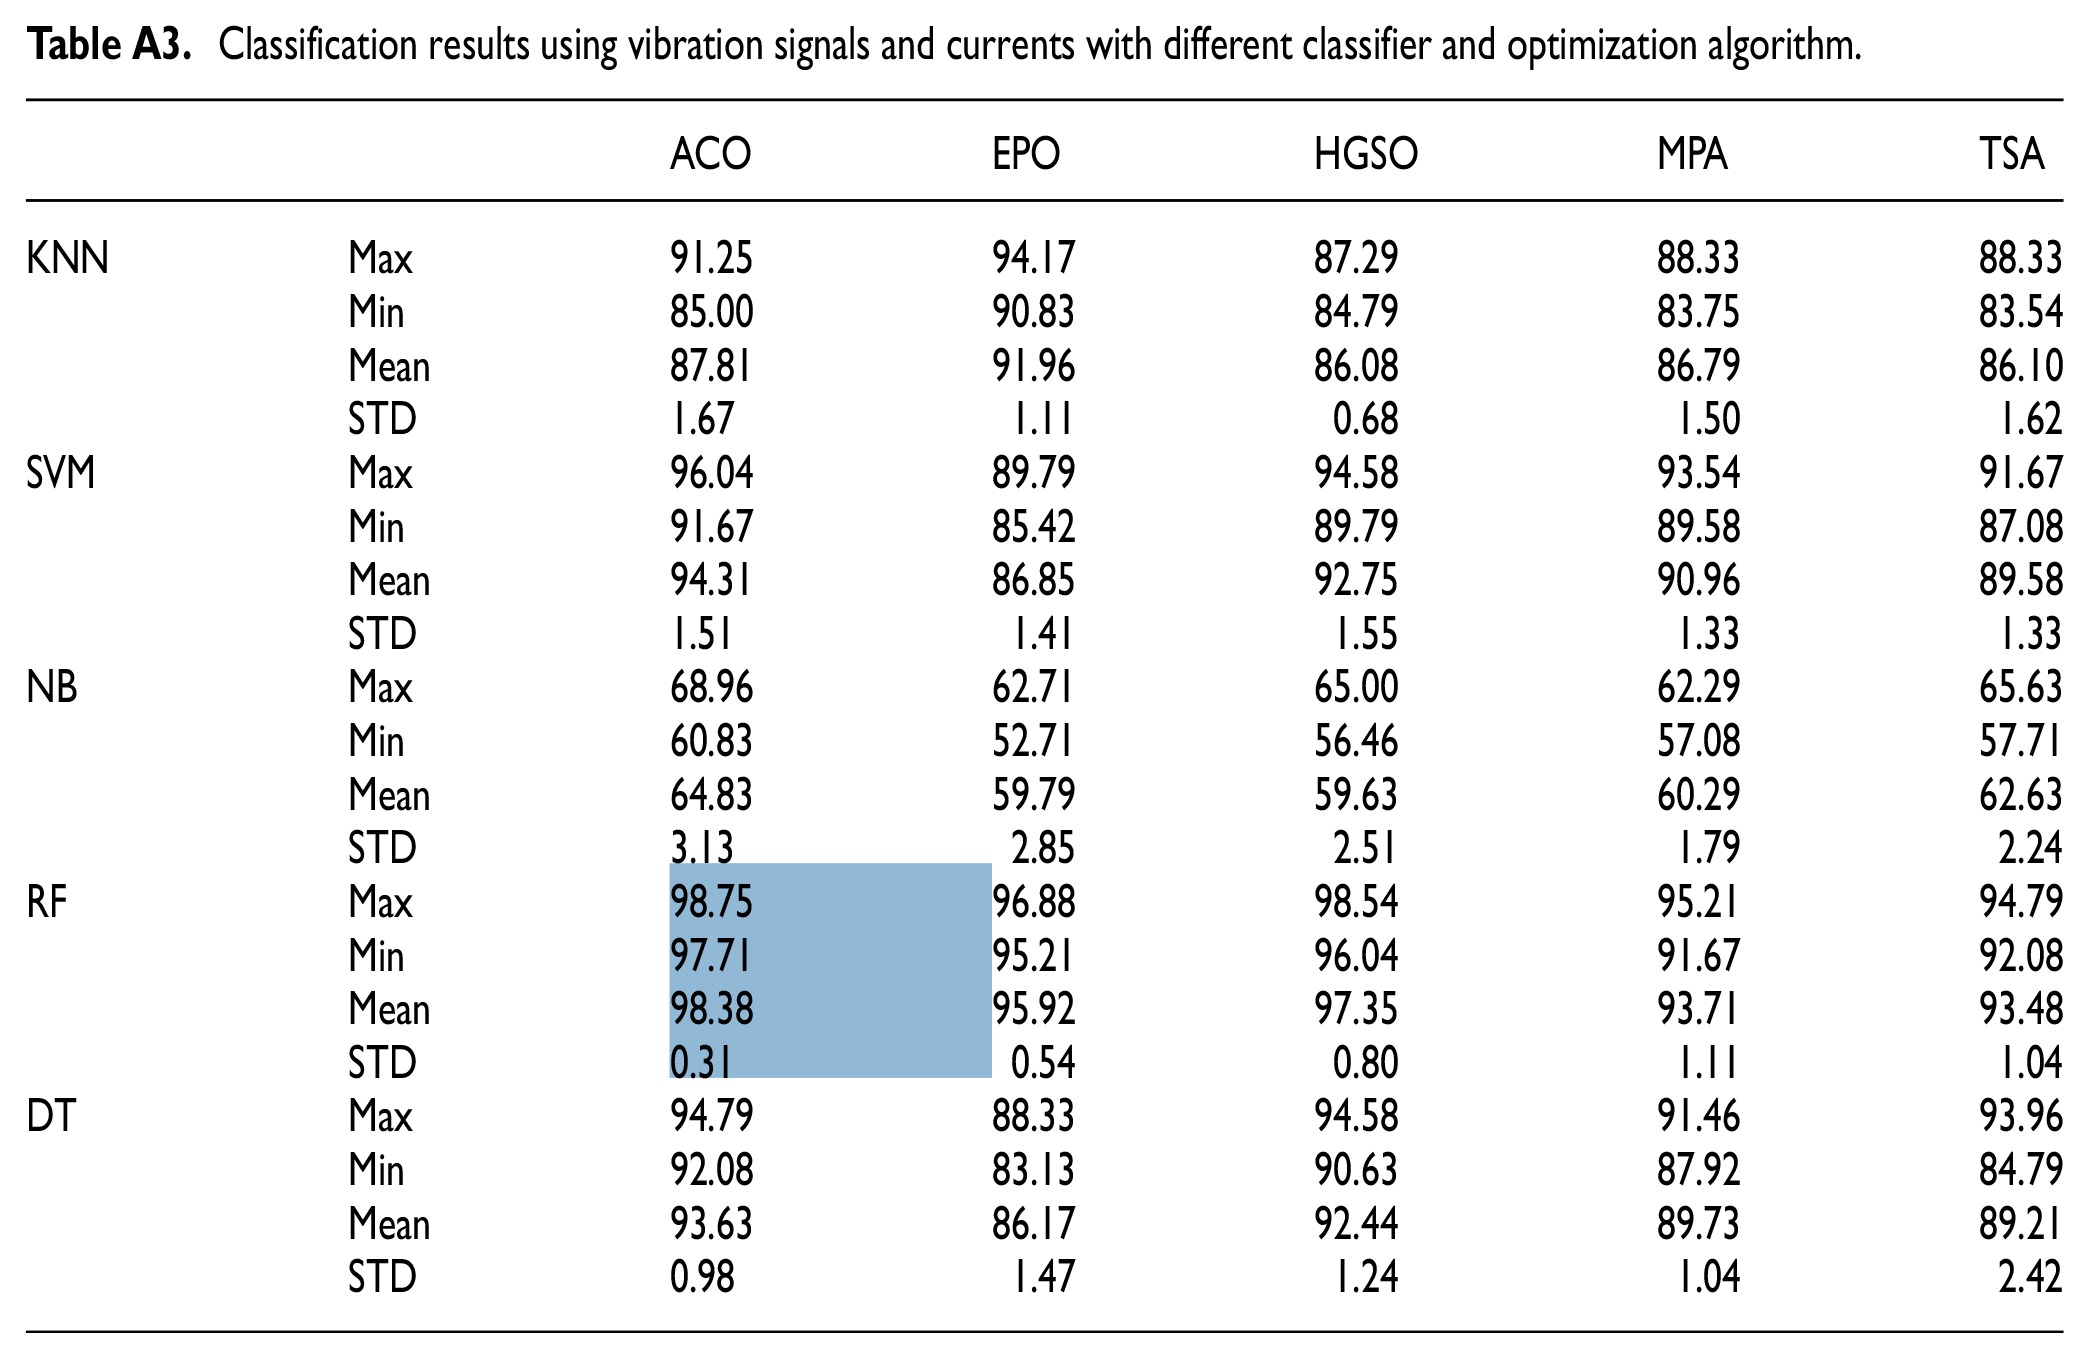
The classification results are divided in three processing tests, were tested using only the current signal as shown in Table A1, only the vibration signals, see Table A2, and the combined between both signals as illustrated in Table A3. It’s can observed from the Table 4, that the best results were obtained using the currents and vibration signals, with the RF classifier and ACO optimization, achieving an accuracy of 98.38 and stability a STD value of 0.31
Fault classification performance globally for vibration signal, current and both signals.

To perform an analysis of the defect recognition ability of the proposed method for four different faults modes (C1, C2, C3, and C4), a set of faults predictions on four faults modes of the test set is implemented. The confusion matrix of the prediction results is shown in Figure 8.
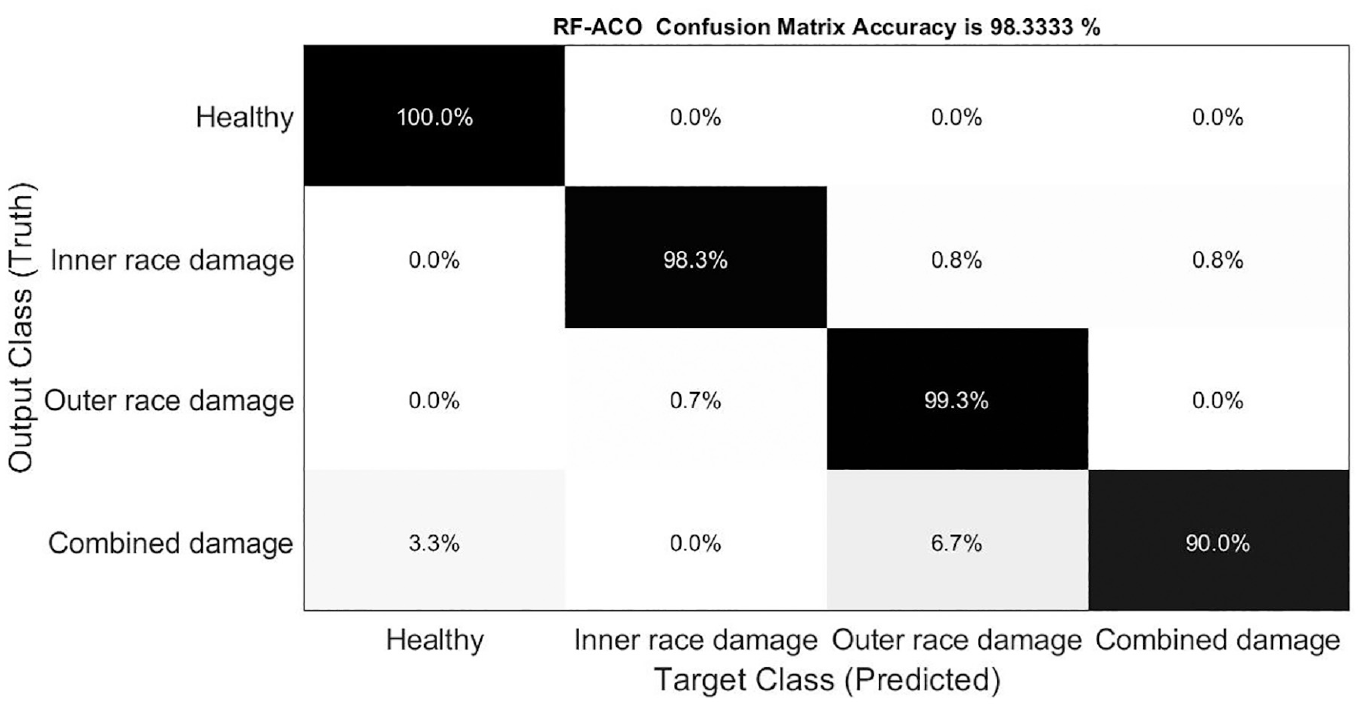
Recognition results for different bearings faults of RF in tandem ACO.
It is can be seen form Figure 8 the global accuracy is successfully predicted with higher percentage ranges is 98.33%. This means that the degree of fault differentiation in the identical class mode from other class fault modes is the highest. By contrast, we can see that the accuracy of combined damage (fourth class) is 90% and the stability std in the combined damage case (fourth class) is 2.7.
We concluded that, while obtain the best accuracy and stability classification result, the accuracy and stability classification results for each class can be different, as illustrated in Table 5.
Fault classification performance of RF in tandem ACO for each class.

To improve the performance of accuracy and stability of system, a new criterion to select optimal features based on Wrapper method, not only improves the classification accuracy denoted as cost1, but also enhances the stability for each class by decreasing the std for each class denoted as cost2, it also reduces the number of inputs by selecting the relevant feature denoted as cost3, which results in the decrease of the processing time and the increase of the speed of the classification process.
The flowchart of the proposed criterion is shown in the Figure 9. The number of selected features is used by a classifier, which is then simulated N times to test the stability of the classification results. The accuracy and the stability of classification (measured by standard deviation) for each class are calculated N times, and the average accuracy and std are calculated using the Cost1 and Cost2 equations.


Flowchart of the proposed criteria for feature selection.
Where:
N = Number of tests.
C = Number of classes.
The final cost is calculated by adding the results from

Where:
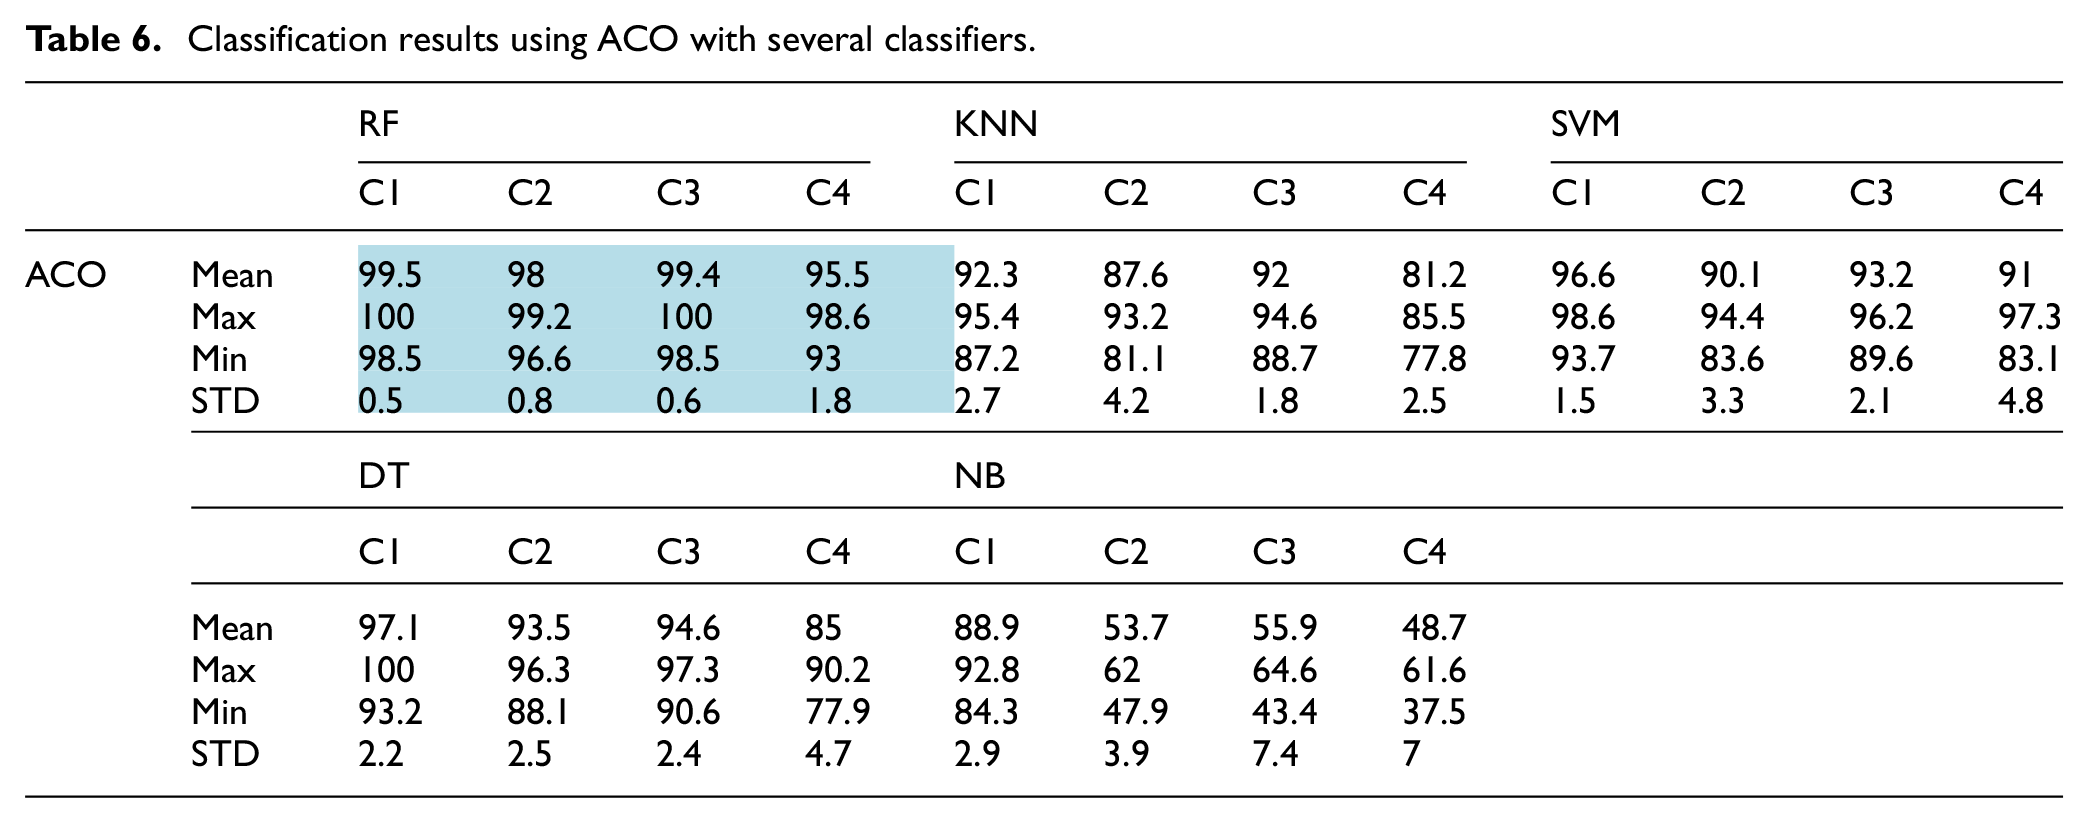
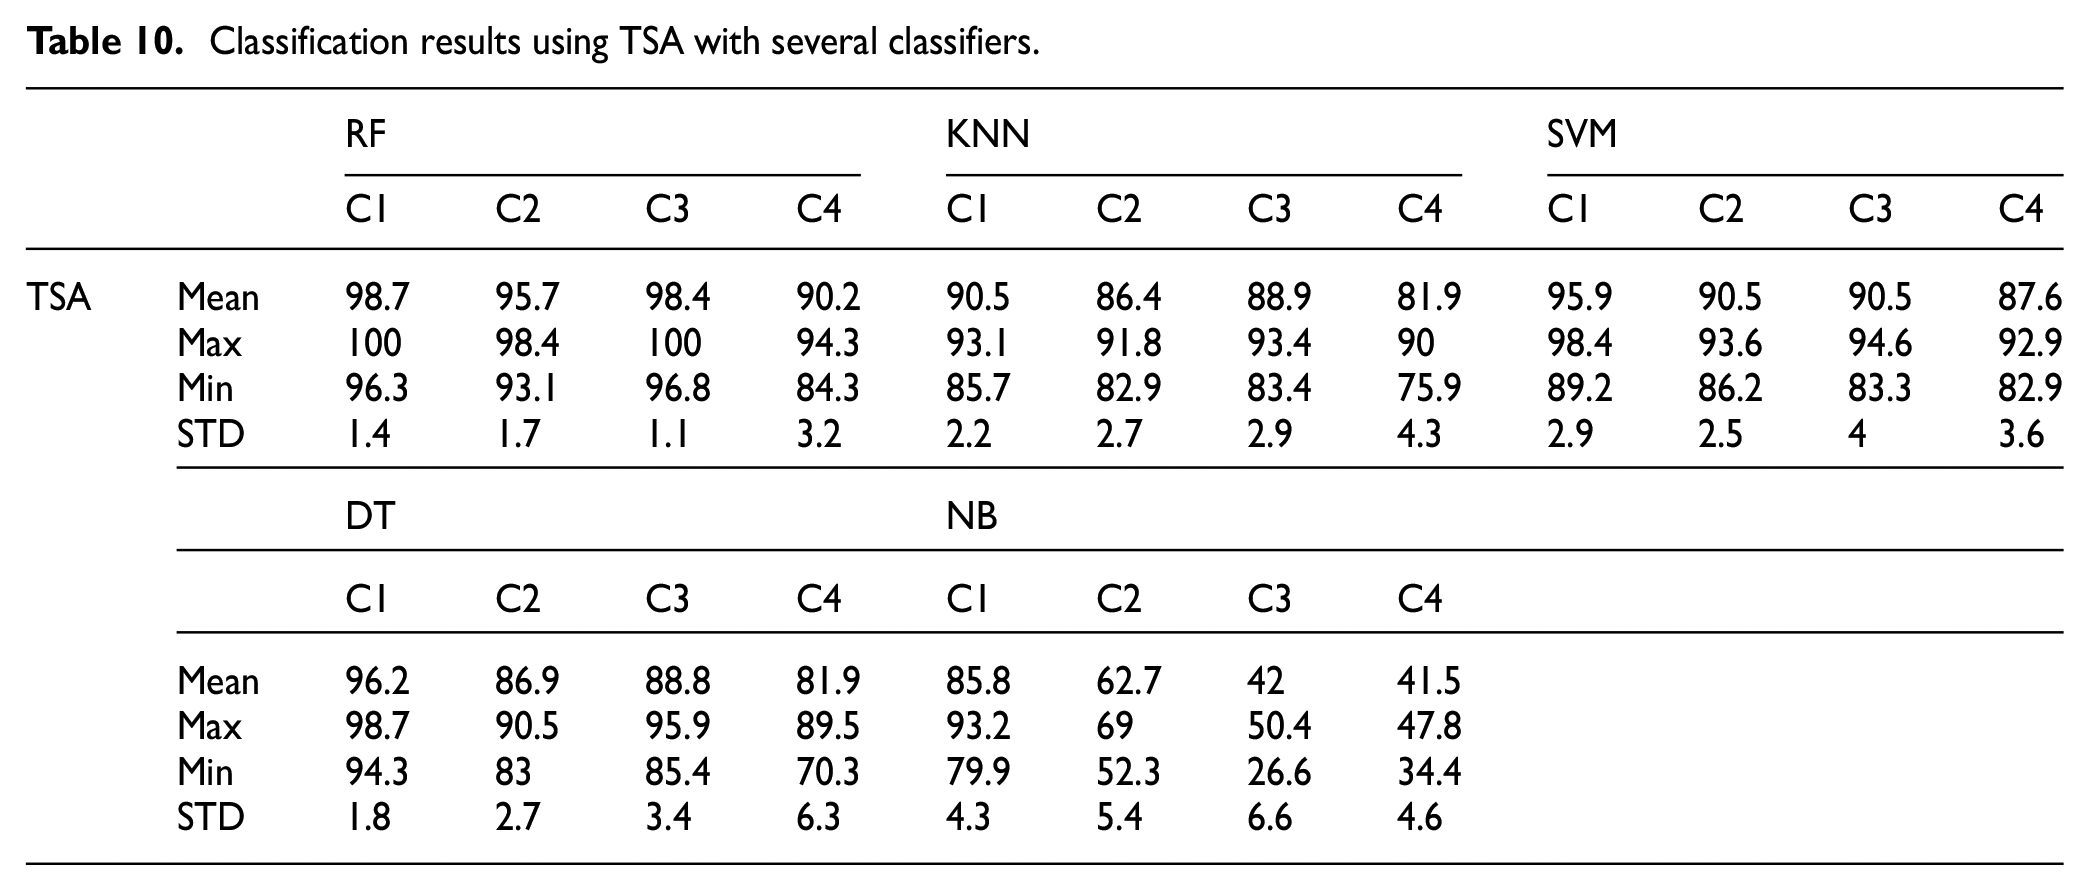
Tables 6 to 10 shows obtained results for several classifiers (KNN, DT, RF, NB, and SVM) combined with several optimization algorithms (ACO, EPO, HGSO, MPA, and TSA). Table 6 shows the best obtained results. From these tables we can notice that the proposed criterion for feature selection was able to improve the accuracy and stability of classification especially at the fourth class (combined damage) we obtain an accuracy of 93% and stability of classification 1.8.
Classification results using ACO with several classifiers.
Classification results using EPO with several classifiers.

Classification results using HGSO with several classifiers.

Classification results using MPA with several classifiers.

Classification results using TSA with several classifiers.
Concluded that, the proposed criteria it is not only improve the overall accuracy but also enhance the classification of each class of faults, making it a more effective method for fault diagnosis in bearings. The results obtained through the proposed method, Table 11 have shown that it has the potential to accurately identify and classify different types of bearing faults for different operating condition (speed, torque, and force) and can provide valuable information for the bearing condition monitoring.
Fault classification performance of RF in tandem Cost-ACO for each class.

It can be observed from Figure 10 that, the huge majority of samples for four bearing fault modes are successfully predicted with higher percentage ranges between 93% and 98.5%. This means that the degree of fault differentiation in the identical class mode from other class fault modes is the highest.

Recognition results for different bearings faults of RF in tandem Cost-ACO.
Additionally, the proposed method shows improvement in terms of accuracy and std for each class, especially for the fourth class (combined defect) which was previously misclassified in the classical method also the other classes as show in Table 12.
Comparison between results of classic and proposed method.

This improvement in results highlights the effectiveness of the proposed method in providing better results for the classification of bearing faults for different operating condition (speed, torque, and force).
Conclusion
In this paper, which is based on the evaluation of the classification results according to the accuracy and stability (stander deviation) of each class and the number of selected features for bearings components. It is based on the constructed of a new criterion for feature selection using wrapper for classification. In detail, the proposed technique based on Adaptive TVMF in tandem with the optimization algorithm ACO and the Random forest algorithm for bearings faults classification for currents and vibrations signals.
The performance and robustness of the proposed approach have been established through different comparative study cases. Firstly, a set of relevant features information’s was extracted using Adaptive TVMF in time and frequency domain from the stator currents and vibrations signals. In a second step, the feature obtained are used to create a new criterion for feature selection combined with optimization algorithm Cost-ACO that allow separating the different states of the bearing, taking into account the impact of the operating conditions of the synchronous machine bearings. Finally, the constructed wrapper method is fed into an RF model to classify the different health states of the bearings.
The proposed criterion for feature selection was able to improve the accuracy and stability of classification especially at the fourth class (combined damage) we obtain an accuracy of 93% and stability of classification 1.8 as we have seen that the defect combiner is difficult to classify, our method has succeeded not only to classify it but also to improve its results in relation to the conventional methods, which proves the efficiency of our new criteria for wrapper feature selection approach to improve the performance of classification algorithms with higher stability (STD: C1 = 0.5, C2 = 0.8, C3 = 0.6, C4 = 1.8) and better accuracy (average C1 = 98.5%, C2 = 96.6%, C3 = 9.5%, C4 = 93) for the both; the statoric current and the vibration signal compared to other techniques. Overall, combined methods had proven their efficiency in time-varying machines fault diagnosis when taking current and vibration signals. However, criterion for feature selection demonstrated a higher robustness and a remarkable superiority.
Footnotes
Appendix
Classification results using vibration signals and currents with different classifier and optimization algorithm.
| ACO | EPO | HGSO | MPA | TSA | ||
|---|---|---|---|---|---|---|
| KNN | Max | 91.25 | 94.17 | 87.29 | 88.33 | 88.33 |
| Min | 85.00 | 90.83 | 84.79 | 83.75 | 83.54 | |
| Mean | 87.81 | 91.96 | 86.08 | 86.79 | 86.10 | |
| STD | 1.67 | 1.11 | 0.68 | 1.50 | 1.62 | |
| SVM | Max | 96.04 | 89.79 | 94.58 | 93.54 | 91.67 |
| Min | 91.67 | 85.42 | 89.79 | 89.58 | 87.08 | |
| Mean | 94.31 | 86.85 | 92.75 | 90.96 | 89.58 | |
| STD | 1.51 | 1.41 | 1.55 | 1.33 | 1.33 | |
| NB | Max | 68.96 | 62.71 | 65.00 | 62.29 | 65.63 |
| Min | 60.83 | 52.71 | 56.46 | 57.08 | 57.71 | |
| Mean | 64.83 | 59.79 | 59.63 | 60.29 | 62.63 | |
| STD | 3.13 | 2.85 | 2.51 | 1.79 | 2.24 | |
| RF | Max | 98.75 | 96.88 | 98.54 | 95.21 | 94.79 |
| Min | 97.71 | 95.21 | 96.04 | 91.67 | 92.08 | |
| Mean | 98.38 | 95.92 | 97.35 | 93.71 | 93.48 | |
| STD | 0.31 | 0.54 | 0.80 | 1.11 | 1.04 | |
| DT | Max | 94.79 | 88.33 | 94.58 | 91.46 | 93.96 |
| Min | 92.08 | 83.13 | 90.63 | 87.92 | 84.79 | |
| Mean | 93.63 | 86.17 | 92.44 | 89.73 | 89.21 | |
| STD | 0.98 | 1.47 | 1.24 | 1.04 | 2.42 |
Handling Editor: Chenhui Liang
Declaration of conflicting interests
The author(s) declared no potential conflicts of interest with respect to the research, authorship, and/or publication of this article.
Funding
The author(s) received no financial support for the research, authorship, and/or publication of this article.