
Abstract
This paper proposes and tests a computerized approach for constructing a 3D model of blood vessels from angiogram images. The approach is divided into two steps, image features extraction and solid model formation. In the first step, image morphological operations and post-processing techniques are used for extracting geometrical entities from the angiogram image. These entities are the middle curve and outer edges of the blood vessel, which are then passed to a computer-aided graphical system for the second phase of processing. The system has embedded programming capabilities and pre-programmed libraries for automating a sequence of events that are exploited to create a solid model of the blood vessel. The gradient of the middle curve is adopted to steer the vessel’s direction, while the cross-sections of the blood vessel are formed as a sequence of circles lying in planes that are orthogonal to the gradients of the middle curves. The radii for the circles are estimated as a distance between the intersection points of the blood vessel edges with the orthogonal plane to the middle curve gradient. The system then uses these circles and the middle curve gradients to produce a solid volume that represents the 3D shape of the blood vessel. The method was tested and evaluated using different cases of angiogram images, and showed a reasonable agreement between the generated shapes and the tested images.
Introduction
Coronary angiograms are a common type of cardiac catheterization procedure, which are used to diagnose and treat blood vessel conditions. A dye is injected into the bloodstream to enable an X-ray machine to take a series of images of blood vessels of the human heart. In some cases, a cardiologist may decide to open a clogged heart artery during the angiogram. 1 Acquiring a 3D geometrical model of blood vessels from an angiogram helps ensure precise diagnoses and the correct treatments. In addition, this information is vital in blood vessel replacement, which is a surgical treatment for obstructed or damaged vessels.
The purpose of automated computer vision-based techniques in medical imaging is to assist healthcare professionals in analyzing medical images quickly and accurately. Medical images, such as X-rays, CT scans, and MRI scans, can provide valuable information about a patient’s condition. However, analyzing these images manually can be time-consuming and subject to human error. Automated computer vision-based techniques use algorithms to analyze medical images, identify patterns, and extract features that can be used to make diagnoses or assist with treatment planning. These techniques can also help identify areas of concern that might be missed by the human eye, allowing for earlier detection and treatment of diseases. Some examples of automated computer vision-based techniques used in medical imaging are identifying tumors or other abnormalities in medical images and assisting with surgical planning by creating 3D models of organs or tissues.2–5
Many works have been carried out to obtain the 3D reconstruction of the blood vessels from various image devices and the missing depth data of the captured images is then investigated in studies that focus on the vessels’ topology.6–8 New blood vessel segmentation algorithms are currently being developed since segmentation is an essential step in constructing the geometry of the blood vessel.2,9,10 Generating the blood vessel’s centerline and determining each bifurcation point along the vessel tree is challenging.9–12 Here, we propose solutions with the assistance of computer aided design. Below, we will illustrate the most relevant works.
In Guo et al., 13 the authors developed a process to reconstruct 3D images of brain blood vessels using angiograms. They used cerebral angiography to acquire a pair of images, and then pre and post processing techniques were implemented to extract the vessel tree. In Subramanian and Thubrikar, 14 a technique was introduced to reconstruct the geometry of 3D blood vessels from a series of 2D intravascular ultrasound images, in which the bovine artery was used as a case study. The researchers used a biplane fluoroscopy to image the catheter tip to capture the curvature of the vessel. Liao et al. 15 proposed an algorithm to reconstruct 3D blood vessels from stereoscopic magnetic resonance angiography. They assumed that the blood vessels have a circular cross section. Although this assumption is restrictive, it helps to estimate the 3D model quickly. In our study, we exploit this assumption since it provides an acceptable level of accuracy. In Wu et al., 6 authors have proposed a method for 3D reconstruction of coronary artery bifurcation by integrating coronary angiography (CA) and optical coherence tomography. This integration allows for the visualization of the bifurcation and vessel shape. However, two angiographic projections with different angle values were required for the 3D reconstruction of the bifurcation centerline. On the other hand, Solanki et al. 7 proposed to construct the coronary arteries in 3D using CA, in which paired images were used. In their approach to construct the arteries, the diameter of the vessel was evaluated utilizing automatic detection of the change in contrast and manually corrected when it needs. Two angiographic images at different angles were also used in Kim et al. 8 to construct 3D coronary artery. In this case, a manual approach was used to define the start and end points of the segment of interest and extract contours and centerlines. The reconstruction of the shape of blood vessels from multiple images obtained through computed tomography (CT) or (CA) imaging techniques can be computationally expensive, especially if a large number of images are used. 16
Tortuosities and angulations are important features in the coronary artery because they can influence blood flow and contribute to the development of stenoses. Stenoses occur when the lumen of the coronary artery narrows, which can impede blood flow and lead to a range of cardiovascular problems, including angina and heart attacks.17–19 To accurately simulate the impact of tortuosities and angulations on blood flow using finite element analysis or computational fluid dynamics (CFD), an accurate model of the coronary artery geometry is required. Constructing geometrical models of the bifurcation of the coronary artery can be a challenging task, particularly if it involves manual selection of features in images or manual construction of the models by the user.20–22 This is because the bifurcation of the coronary artery is a complex and highly variable structure, with significant variations in geometry and topology between individuals. To address this challenge, researchers have developed a range of automated and semi-automated techniques for constructing geometrical models of the bifurcation of the coronary artery. These techniques typically involve the use image processing and computer aided design software. 23
Approaches toward 3D reconstruction of retinal blood vessels from fundus images were presented in Refs.24–28 Many works followed the segmentation process presented in Martinez-Perez and Espinosa-Romero 26 in which they used skeletonization processes to obtain a fundus tree. In Sedeghian et al., 29 a new method was proposed for artery reconstruction using images obtained from computed tomography (CT) and magnetic resonance (MR). The authors integrated features from 64 images and then fed these features into Gambit software to get a string of circles and distinctive points on the vessel shape. These points are connected to construct the vessel geometry.
In this work, we propose an approach for 3D geometric modeling of blood vessels from an angiogram image. Our approach uses morphological image processing for extracting the middle curve and edges of the blood vessel. AutoCAD is then used to process these entities and build the final solid model using Lisp programing and AutoCAD solid modeling libraries. To the best to our knowledge, this approach has never been used before.
This paper is organized as follows. Methods section outlines our new methodology and we highlight how our image processing techniques acquire the locations of the outer wall boundaries and the middle curve of the vessel. In addition, feature extractions and solid modeling using AutoCAD are presented. The results are presented and discussed in the next sections where five locations of an angiogram of the coronary artery were selected to verify the proposed approach. Our conclusions are drawn in the final section.
Methods
Our approach is conducted in two steps. In the first step, we demonstrate the morphological operations on the region of interest in an angiogram image where geometrical information related to the blood vessel edges and the middle curve is obtained. In the second step we exploit our algorithm to construct the 3D shape of the blood vessel based on a CAD system.
Image acquisition and pre-processing
Angiography is a type of X-ray generated by a fluoroscopy device, which is a medical imaging system. The aim is to monitor and examine the circulatory system in various parts of the human body such as the heart, brain, and kidneys. 30 In coronary angiography, a catheter is inserted into an artery in the groin, and carefully moved up into the heart and coronary arteries. The fluoroscopy machine produces X-ray images that help the cardiologist to position the catheter. A contrast medium is then injected that enables the doctor to highlight any blockage or damage in the blood vessel.
The coronary angiography images were obtained anonymously from a case acquired in private clinical practice using the Innova 2000 system manufactured by GE Healthcare. The images were acquired at a standard resolution of 512 × 512 pixels, which is commonly used in medical imaging. The imaging rate of 15 frames per second is likely sufficient for most clinical purposes. The Innova 2000 system used for the imaging had a field of view of up to 25 cm and a spatial resolution of up to 100 μm, indicating that it is capable of producing high-quality images suitable for detailed analysis of the coronary arteries.
We selected a single frame to extract the geometrical information required to construct the 3D shape of a blood vessel segment. This segment is specified by the user by selecting a window that represents a region of interest. The acquired window needs to be enhanced to remove the existence of artifacts resulting from fluoroscopic imaging that effect the extraction of the vessel edges.1,31,32 A median filter is a widely used nonlinear filter which we adopted to remove the noise from the acquired image since it keeps the edges and removes the noise under certain conditions. The region of interest is then binarized using a threshold value which is chosen automatically according to the histogram of the selected window. Figure 1 shows block diagram of the proposed approach and illustrates the steps used to achieve the 3D model of the blood vessel. Morphological image processing is then implemented on the region of interest to extract coordinates of the vessel edges and the middle curve.

Block diagram of the proposed approach to construct 3D shape of blood for an angiography image. The pre-processing of the region of interest contains of four pre image processing techniques. The post-processing part consists of five steps that finally create the 3D model of blood vessel in AutoCAD environment.
Identifying vessel edges
Deformable models are used in many works since they accurately recover the shape in various medical imaging applications.33–36 We used an active contour model to obtain the edges. This model is deformable and surrounds the boundaries of the shape by minimizing the pooling of the weighted internal and external energies. The internal energy controls the deformation caused by the geometric shape, while the external energy is related to the image domain. Minimizing these energies produces internal and external forces in which internal forces are shape forces that keep the contour together and prevent excessive bending. On the other hand, external forces lead the contour in the direction of object boundaries. The parametric contour is then initialized in the image, and due to the effect of forces, it then bounds the object’s edges.
In mathematical terms, the active contour model can be described as a curve

where
Energies for active contour model are identified as below,

where the internal energy (


The first term in the internal energy
The complete contour can be obtained by integrating the energies,

By minimizing (5), we obtain a convergence criterion that should satisfy contour points38,39:

This approach is iterative: two points are chosen as hinge locations and in-between points, that are selected arbitrarily, move according to the convergence criterion. We used MATLAB to implement an active contour model on selected cases in an angiogram image.
Skeletonization of the blood vessel
We used a skeletonization algorithm to minimize the foreground regions in a binary image to a skeletal residue that keeps the extent and connectivity of the original region and removes the majority of the original foreground pixels. We also used a thinning algorithm to determine skeletal pixels using local operations. Next, a multi-iteration technique was exploited in which in the first iteration the contour points were removed. Then, a set of conditions according to Zhang and Suen 40 was followed to obtain a second iteration. The last sequence continues until the shape is fully thinned to a single-pixel width. Our thinning algorithm is based on 3 × 3 window mask to determine the skeletal pixels. This approach was used to determine the middle curve of the blood vessel, see Figure 2.

Shows the skeletonization process applied to a portion of the blood vessel: (a) a selected window from an angiogram image, (b) the window after binarization, and (c and d) the skeletonization and thinning process.
Entity extraction
In order to extract entities from the region of interest, we used an entity tracing and labeling method that works after the edge detection and skeletonization of the region of interest. This method can be implemented in parallel after each processing, where a moving mask consisting of 3 × 3 elements is used to search the selected area for any point that might be a part of a segment of the blood vessel edges or middle curve.
We used search and collect algorithms to extract the locations of entities, where the intensity value of the center point of the mask is checked to see whether it belongs to the background or object. When a point that belongs to an object is found, this point is then used as a possible starting point of an entity and its location is recorded in a specific array. It is labeled according to the processing phase to differentiate the entities that belong to the blood vessel edges from those which belong to the middle curve.
We then checked the eight neighbors of the center point to verify whether one of them belongs to the entity. If this point exists, its location is added to the array and is assigned as a new center point for the mask. This search and collect mechanism continues until the mask has searched the entire window.
After collecting all entities in the image, a segment connectivity test is carried out among the collected entities to find out if there are segments that need to be linked together. This test uses location gradients of the last and first two points of the segment, and compares them with the corresponding gradients of another segment. In addition to the segment’s location in the image, the gradients are used to decide if these segments are a single entity and to check for any bifurcation points. These bifurcation points are labeled and the branches are treated as separate entities for further processing in the CAD system.
Following Liao et al., 15 we used the cross section of the blood vessel as a circle with radius r. Although this assumption has limitations in real cases, it is still a feasible solution to demonstrate blood vessel. Our approach to calculate the radius is based on finding the minimum distance between each location on the middle curve and blood vessel edges in which the radius is perpendicular to the middle curve gradient at each location.
In terms of mathematics, let

assume that the normal vector is in the


Presents a schematic diagram for a sectional blood vessel. P n is arbitrary selected plane that contains the cross section of the blood vessel. Nn is normal vector on Pn.
Equation (8) can be generalized for all locations on the middle curve. A data file contains coordinates of the middle curve and the radii vector is generated. This file is used to generate the 3D model of the blood vessel using AutoCAD software.
Generation of 3D model
We created the solid model of the blood vessel via AutoLisp, an embedded programing system in AutoCAD, with which we wrote a programing script for processing the extracted entities and creating a solid model of the blood vessel. The script is based on list-processing, in addition, AutoCAD commands can be exploited repeatedly. Our script imports a data file that contains coordinates of the middle curve and radius value associated with each coordinate of the middle curve. The data file was prepared by Matlab to store the labeled entities as described in the previous sections.
Each of the x, y, z coordinates and corresponding radius (r) are stored in a separate list. Then, the script generates cross sections of the blood vessel along the middle curve, in which each cross section is presented as a circle with radius (r), see Figure 3. This step should be done first by changing the coordinate system to align z axis with the normal vector
A complete solid model of the blood vessel for the region of interest is thus generated, see Figure 3. If there are any bifurcation points, each branch is generated separately and then a joining volume to bridge the gap between the created branches is executed. This bridge volume is created using the loft command and then merged with other branches using the union command. Figure 4 shows a block diagram for our AutoLisp script to convert the extracted entities into a 3D model of a blood vessel.

Block diagram of creating 3D model using AutoCAD software. 3D processing phase utilize user coordinate system (UCS) which is set perpendicular to WCS and along the middle curve. A snippet of the developed AutoLisp program is presented at the right.
Results
To verify our method, we used an angiogram image of the coronary arteries in which five different regions of interest were selected. These regions were processed using MATLAB and AutoLisp according to the methodology presented in methods section. First, the Matlab program loads the image and allows the user to choose the region of interest. Then, a median filter is implemented on the selected area to improve the extraction of the entities. The area is then binarized to black and white using a threshold value chosen automatically according to the histogram that was acquired from the region of interest.
At this point, the region of interest is ready to be post processed to extract the edges and middle curve of the blood vessel, where the edges are detected via the active contour method as described in identifying vessel edges section.
Following the method outlined in entity extraction section, radii of circles that represent the cross sections of the blood vessel are calculated. The final part of the MATLAB program generates a data file that contains the locations of the middle curve and the corresponding radii of the blood vessel. In addition, the locations of the edges are also exported in a different file for subsequent error evaluation. As outlined in generation of 3D model, AutoLisp was used to generate a 3D shape of the blood vessel of the region of interest using the data file.
Figure 5 shows the implementation of our method using a case study of a descending section of the blood vessel from an angiogram image. First, the region of interest was selected and then processed by the morphological operations to extract information related to the blood vessel edges and the middle curve, see Figure 5(b) to (f). Feature extraction is implemented on the images in Figure 5(d) to (f) to extract the edges and middle curve. After obtaining the locations of the features, cross section radii are calculated as stated in entity extraction section. The data file contains middle curve locations and cross-section radii are created. This file passes into AutoCAD using our AutoLisp program. The program processes the data into the file and the 3D model of the region of interest is created. Figure 5(g) and (h) shows the first step in the generation of the 3D blood vessel, in which a series of circles that represent the cross-section of the blood vessel were generated. These circles were used to generate the solid volume using loft command, see Figure 5(i) and (j).

First case study: (a) the selected snapshot, (b) filtered window, (c) image binarization, (d) edges detection, (e and f) demonstrate the results from the two thinning algorithms used in this work, and (g–j) show the approach to construct 3D model of the blood vessel.
Figure 6 presents the various locations of the coronal artery, in which a narrow region can be seen on the right-hand side of the selected window. Image pre-processing was performed, see Figure 6(b) to (f), where several artifacts were detected in the original image due to variations in contrast. These pixels were removed using connectivity inspection in an entity extraction algorithm, where the number of pixels was used to exclude entities that consist of a few pixels. In addition, entity gradient was checked and those entities with approximately similar gradients were kept. AutoLisp was used to construct the 3D model for the region of interest, see Figure 6(g) to (i), in which the narrow region was constructed successfully.

Second case study: (a) the selected snapshot, (b) filtered window, (c) image binarization, (d) edges detection, (e and f) demonstrate the results from the two thinning algorithms used in this work, and (g–j) show the approach to construct 3D model of the blood vessel.
The left anterior descending (LAD) artery was considered as the third case study. The concave shape of the artery added a unique challenge for this case study, see Figure 7. The image filter was unable to remove an area which belongs to a different vessel projected on the LAD artery. Referring to the vessel edges image shown in Figure 7(d), the lower edge has a defect as a part of contour which would need to be removed in a real case scenario. This issue affected the creation of the middle curve where the skeletonization algorithm assumes it as a sub-branch of the main branch. When entity extraction module executed to the skeletonized image, the sub-branch was removed since it was considered as being a noise near the image boundaries. The 3D model was then generated as shown in Figure 7.

Third case study, left anterior descending artery: (a) the selected snapshot, (b) filtered window, (c) image binarization, (d) edges detection, (e and f) demonstrate the results from the two thinning algorithms used in this work, and (g–j) show the approach to construct 3D model of the blood vessel.
Detecting bifurcation and crossover points is a challenging task in the reconstruction of the 3D geometry of blood vessels. Considering these points is vital to ensure a convenient forming of the blood vessel branches. In this work, we investigated two cases that include such points, see Figures 8 and 9. The cases are the right coronary artery (RCA) and the left main coronary artery (LM). Figure 8(b) to (f) highlights that our algorithms managed to detect the middle curve and edges of the vessels. The entity extraction algorithm detected the bifurcation points and labeled their locations. These entities were then traced and their locations collected as distinct entities. The entities obtained were categorized relative to their gradients and locations in the selected window. Then, the 3D shape of the blood vessel was cut into three parts, see Figure 8(i). The first part begins from the starting point of the middle curve until the bifurcation point. The other two parts start from the bifurcation point until the end of each branch. To join these three parts, the loft command was used between the last circle of the main branch and the first circle of each branch. The union command was used to join all parts and create a single solid model as shown in Figure 8(i) and (j).
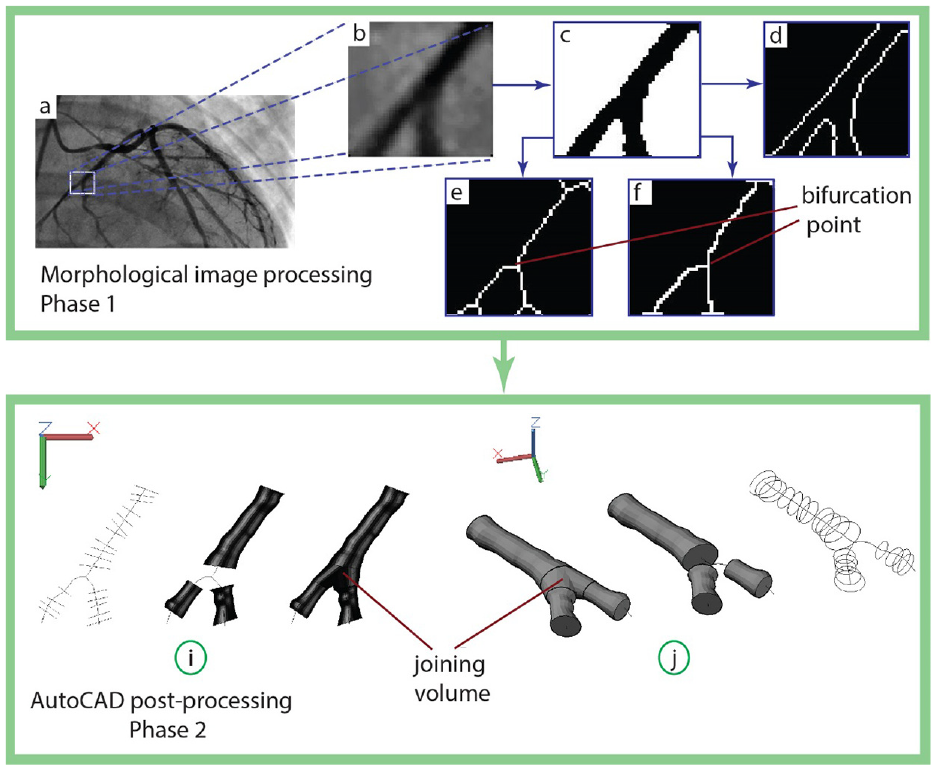
Fourth case study, right coronary artery: (a) the selected snapshot, (b) filtered window, (c) image binarization, (d) edges detection, (e and f) demonstrate the results from the two thinning algorithms used in this work, and (i and j) show the approach to construct 3D model of the blood vessel.

Fifth case study, left main coronary artery: (a) the selected snapshot, (b) filtered window, (c) image binarization, (d) edges detection, (e and f) demonstrate the results from the two thinning algorithms used in this work, and (i and j) show the approach to construct 3D model of the blood vessel.
In the crossover case shown in Figure 9, four branches were detected. As illustrated in the previous case, the four parts were created and combined into a single solid model as shown in Figure 9. Although the 3D model of the crossover case was obtained, the loft command did not create the unified parts correctly due to the selection order of the branch sequences. This issue needs further investigation to determine the right sequence for the joining parts.
To evaluate the accuracy of our approach, we calculated the error between the projected area of the generated solid model and the area bounded by the edges of the region of interest, see Figure 10. This error sheds light on the deviation of the solid model from the blood vessel edges. For the five cases that we adopted in this work, the errors were 5.5%, 5.3%, 5.7%, 6.5%, 7.2% respectively.

Illustration of the estimated error.
Discussion
We provide a new approach for 3D shape formation of blood vessels from angiogram with assisting of computer aided system. The approach is segregated into two phases, pre and post processing of the region of interest and 3D construction of the blood vessel.
Our results provide additional support for using active contour in detection edges of the medical images and it is more convenient than other edge detection methods such as Sobel – Prewitt, due to the dynamic nature of these images and the iterative property that enables the edges to be surrounded due to image forces. Obtaining accurate locations of the edges is a key to estimate precise diameters of the blood vessels. 2
The middle curve is obtained via the thinning algorithm where two methods are used. The first is based on medial axis transform, 41 while the second uses a Stentiford thinning algorithm. 40 According to our results, the methods show a successful extraction of the middle curve, and the Stentiford thinning algorithm shows a better detection near the boundaries. However, this advantage comes with a time cost due to the iteration behavior of the Stentiford algorithm.
The thinning algorithm plays a key role in enabling the feature extraction phase to work smoothly, see Figure 5(e) and (f). Redundant branches at the lower end of the middle curve have to be removed, otherwise the extraction algorithm may deviate the direction of the middle curve. Such a deviation would affect the path of the 3D model of the blood vessel.
Due to the cusp in the one of the entity’s edges, Figure 7(f), the blood vessel diameter had been enlarged. However, this issue could be avoided if this area was excluded by implementing a local filter on the cusp region.
Using CAD systems simplifies the process of obtaining a variety of properties for the solid model, which can be used for dynamic computation of the blood circulation in the vessel. In addition, CAD can be used to obtain the actual physical size of the vessel in order to create a 3D replica using a 3D printer that can be used for medical training.
Our approach is different from the approaches presented in Refs.11,15,26,42 in which these approaches used multi images to reconstruct the 3D shape of the blood vessel while our approach proposes using a single frame. In addition, implementing the proposed algorithm using computer aided systems can reduce the cost and time of the processing because the resilience of these systems.
In general, the amount of error is reasonable for the first three cases since we considered several locations along the middle curve to generate the cross section of the blood vessels. These values could be reduced if additional locations were considered. A noticeable increase in the error was detected in cases 4 and 5, where union volumes were used to join the branches in both cases. These volumes were the main source of error augmentation because they were generated first between two branches and then unified with the solid model. This process may compromise the accuracy of our approach. Further work needs to be done to reduce the error caused by the joining volumes.
Conclusion
We have presented a new approach for 3D geometric modeling of blood vessels with the assistance of AutoCAD. This approach extracts blood vessel edges and the middle curve from a spatial window of an angiogram image. Image morphological techniques, including image filtering, edge detection, and skeletonization, were used to extract the middle curve and calculate the cross-section radii. The extracted data were passed into AutoCAD via our AutoLisp program. The program used AutoCAD libraries to create a set of cross sections along the middle curve that are used to generate the 3D shape of the blood vessel of the region of interest.
Five challenging cases were used to verify our approach. We were able to form the 3D models of the selected cases in which satisfactory results demonstrate the practicality of the approach. We found that obtaining an accurate middle curve of the blood vessel can considerably enhance the reconstruction of the 3D model. Using the active contour method to obtain the edges can return accurate edges which create, in turn, a precise 3D model.
Using AutoCAD libraries provides a resilient, reliable, and fast method to generate solid models of the blood vessels. Bifurcation and crossover blood vessels are still challenging and the generation of the 3D models relies on how precisely the middle curve is segmented. Moreover, a criterion for selecting a suitable sequence to create joining volume among the elements should be further investigated.
Our approach requires further investigation to overcome some noise issues due to artifacts in the images and research into solving this problem is underway. Further work needs to be performed to obtain a 3D model of the dynamic projection mapping of blood vessels, in which more than one image frame should be considered.
Footnotes
Handling Editor: Chenhui Liang
Declaration of conflicting interests
The author declared no potential conflicts of interest with respect to the research, authorship, and/or publication of this article.
Funding
The author disclosed receipt of the following financial support for the research, authorship, and/or publication of this article: This work has been approved by the scientific committee of the biomedical engineering department/University of Baghdad.