
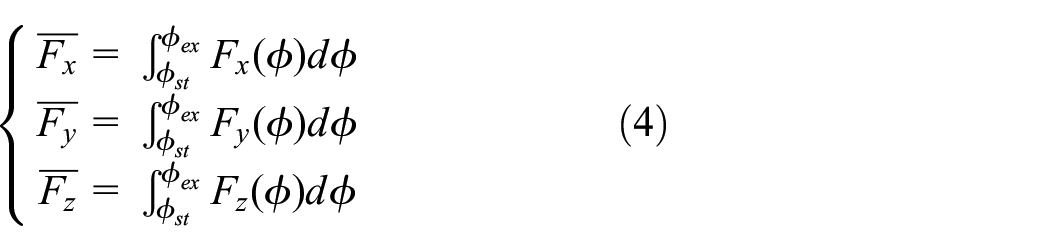
Abstract
Difficult machining characteristics of titanium alloy materials and low rigidity characteristics of thin-walled component make Titanium Alloy Thin-Walled Component (TATWC) prone to chatter during machining, resulting in poor surface quality and other defects, which restricts the expansion and application of TATWC in the special industrial field. The appearance of Ultrasonic Vibration Assisted (UVA) milling method provides a new technology to overcome the processing problems of the TATWC. To analyze the stability of the TATWC processed by UVA milling method, first, by introducing a characterization function, a cutting force model of UVA milling method is established; The coefficients of cutting force between milling cutters and TATWC are solved through experiments. The model is verified by comparing the experimental and predicted values of cutting force; Secondly, the stability prediction model of UVA milling method based on full discrete method is established, and the effect of various process parameters on the stability of UVA milling method is researched. Finally, based on theoretical analysis, the modal characteristics of TATWC are measured through modal experiments. The feasibility of the stability prediction model of UVA milling method is verified by cutting TATWC with variable cutting depth.
Introduction
High strength and corrosion resistance, excellent low-temperature performance, low density, and thermal conductivity make titanium alloys generally applied in special industrial fields such as aerospace industry.1–3 To meet the needs of these industries, titanium alloy materials are often processed into TATWC such as cooling fan shells. 4 However, the characteristics of TATWC greatly increase the probability of chattering during machining, which has a great negative impact on the quality and processing cost of processed workpieces.5,6 The appearance and application of UVA milling method provides a new technology to overcome the processing problems of the TATWC. 7
Accurate dynamic model is the basis for studying the stability of UVA. Considering the regeneration effect, the dynamic system of milling is reduced to a delay differential formula. In the process of modeling, the modeling of regeneration time delay and cutting thickness is the key of milling dynamics. At present, the most widely used model is to approximate the time-lag to the period of cutter tooth, and approximate the cutter tooth path with an arc to derive the cutting thickness model. Altintas 8 developed a cutting force model that can predict the cutting forces in end milling of inclined surfaces by considering the effects of tool inclination angle and tool helix angle. Yuan et al. 9 presented a model for predicting cutting forces in micro-end-milling operations using the finite element method. Özel et al. 10 proposed a mechanistic model that takes into account the effects of various parameters on cutting forces in mil ling.
For the stability prediction of milling system, the stability limit map method plays a very important role, which is also a commonly method in the current cutting stability discrimination and limit value prediction analysis methods. This method was proposed by Tobias,11,12 and has been extended to many different application methods based on its theory and method. E. Solis et al. 13 et al. gave a method to draw the stability diagram of a two degree-of-freedom system with different dynamic characteristics in the feed and its vertical direction by directly using the measured experimental data. ND. Sims et al. 14 and others, based on the modal synthesis analysis method and frequency response function characteristics, directly identify the cutting stability limit (slope) diagram of milling tools using the data collected by piezoelectric sensors and actuators. Schmitz et al. 15 presented a Bayesian machine learning approach that uses physics-based models, milling test results, and user risk tolerance to rapidly converge on optimized milling parameters for maximum metal removal rate.
In addition to the stability limit map method, the numerical method is also a commonly used method in the stability prediction of milling system, which can directly determine the prediction accuracy and calculation efficiency. Among the numerical methods, the frequency method proposed by Fanrahani, 16 the semi-discrete method proposed by Insperger 17 and the fully discrete method proposed by Ding Ye 18 have a great influence and have been studied. Representative research such as Jun et al. 19 used the zero-order frequency method to solve the stability analysis of UVA system; The full discrete method is also used by Yuemin et al. 20 to analyze the stability of the UVA system in the feed direction, vertical feed direction and elliptical vibration direction.
In the processing of TATWC, Ratchev et al21,22.and Ning et al. 23 established a finite element analysis model for titanium alloy materials and obtained the deformation patterns of TATWC under different aspect ratios, load sizes, and different force heights. Vetan et al. 24 conducted finite element simulation analysis on the variation pattern of machining deformation of TATWC with weak rigid and complex structures under the influence of cutting forces. Jitender 25 established finite element simulation analysis models for the milling force, milling heat distribution during the milling process, thin-walled deformation, and residual stress after processing of TATWC, and proposed effective deformation prevention and optimization strategies.
Previous studies have conducted some research on the cutting force and stability of UVA milling processes and processing characteristics of TATWC with traditional milling methods, but few scholars have conducted detailed research on the UVA milling process of TATWC. In particular, there is a lack of stability research for UVA milling method of TATWC. Therefore, this paper studies the stability of TATWC based on UVA milling method. Firstly, the cutting force models of longitudinal and torsional UVA milling are studied, and the correctness of the models is verified by slot milling experiments. Secondly, two stability models for UVA milling of thin-walled parts are established, and the effect of cutting parameters on milling stability is studied through numerical calculations. Finally, the correctness of the stability models for UVA milling is verified through experiments, providing reference significance for the process research of UVA machining.
Model of cutting force with UVA milling
When the dynamic characteristics of the cutting system are not considered and the tool motion path is assumed to be an arc path, the feed per tooth is set as

Based on the cutting force simulation parameters in Table 1, the cutting force of ordinary milling is simulated with MATLAB. The simulation results are shown in the Figure 1:
Simulation parameters of cutting force.
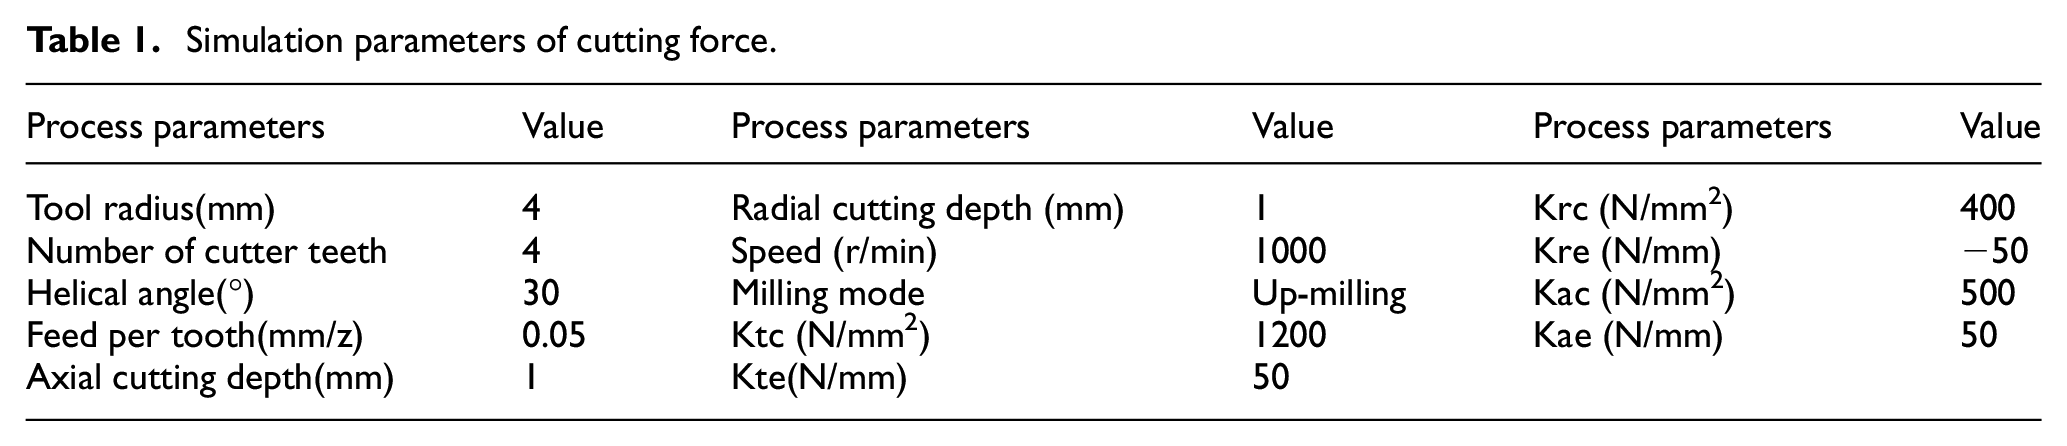
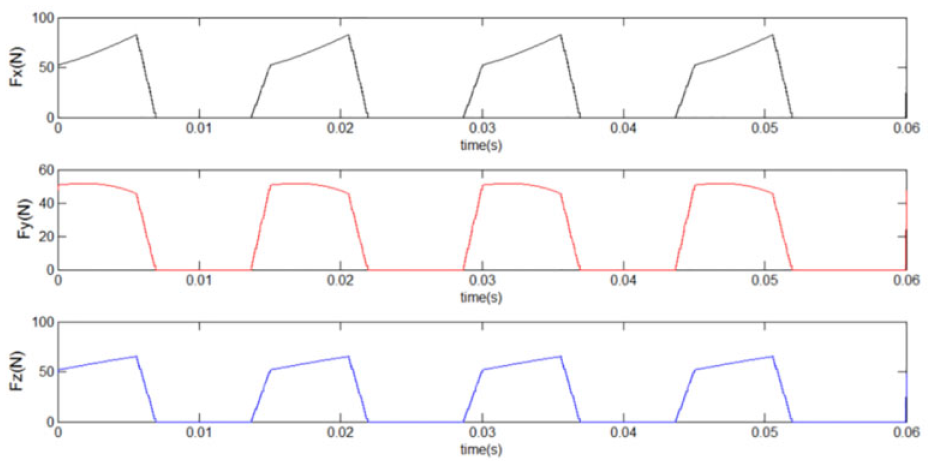
Simulation of the conventional milling force.
These two processing methods have little influence on the static cutting thickness based on the tip motion trajectory of the longitudinal and torsional UVA milling tool, so the influence of these two processing methods on the static cutting thickness is ignored. Therefore, these two cutting methods only change the cutting state, that is, under certain cutting parameters, the cutting edge and chip have high-frequency periodic contact separation. This will lead to changes in the original cutting mode, that is, multiply the original cutting force model by a state function

where
Take the longitudinal UVA system as an example for analysis. Figure 2 shows the time domain graph of the
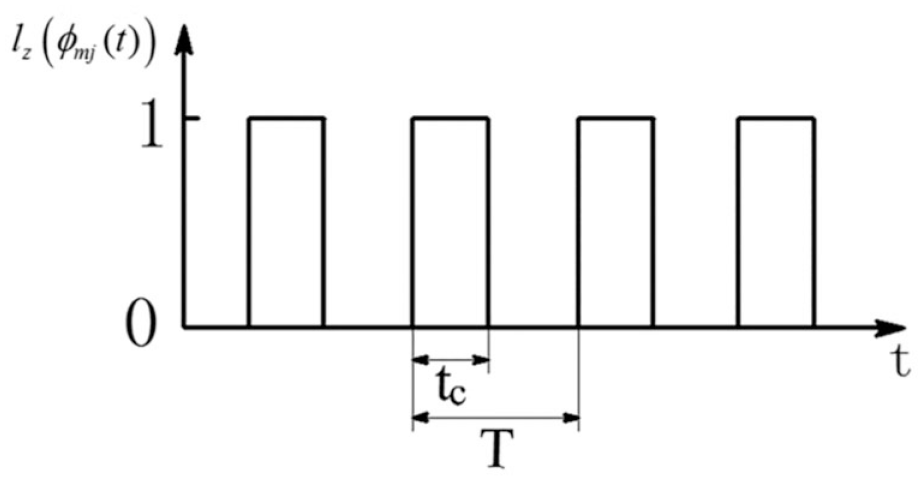
Time domain graph of the
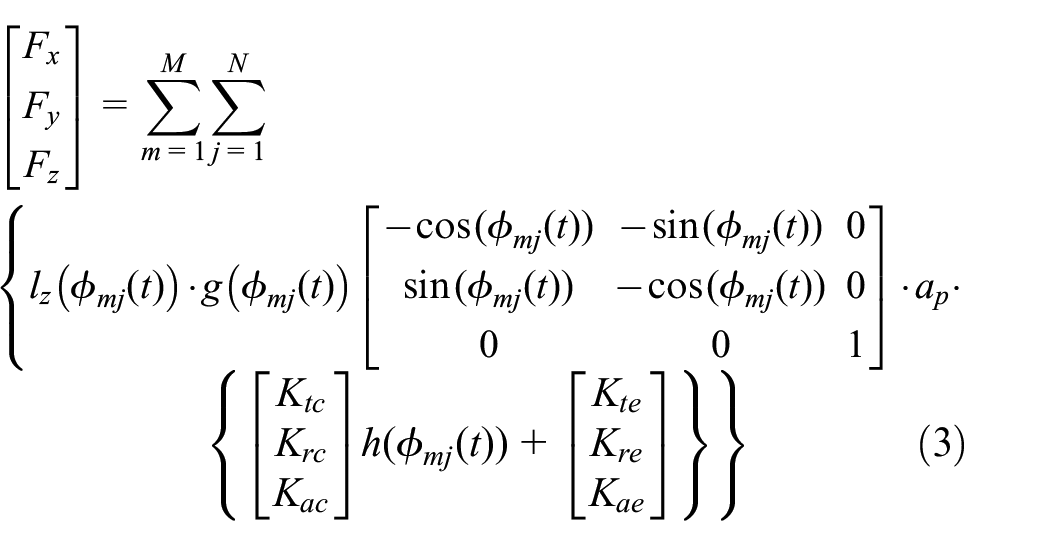
Therefore, the cutting force model of UVA milling method can be obtained from formula (2) and written in matrix form, as shown in the following formula (3):
Based on the cutting simulation parameters in Table 1, the longitudinal ultrasonic vibration is added(frequency is 30 kHz and the amplitude is 0.008 mm), and the cutting force is simulated by MATLAB.
From Figures 3 and 4, the cutting force return to zero at high frequency during longitudinal UVA milling. This is the cutting force state under the condition that the whole cutting system is rigid. However, the machine tool, tool handle and workpiece are elastic to a certain extent, and it is impossible to be completely rigid. In addition, the chip itself is very elastic, so the ultrasonic vibration milling force cannot appear such a uniform return to zero phenomenon. In Figure 4, the cutting force has three times of return to zero and three times of wave peaks in time from

Simulation of longitudinal UVA milling force.

Local magnification of a points in simulation of cutting force.
The period of cutting force in a ultrasonic vibration cutting is
The characterization functions of torsional UVA milling can be expressed by formula (2), and the processing method is consistent in the representation of the characterization functions. Similarly, the cutting force of torsional UVA milling can also be modeled by formula (3). The cutting force has a similar effect as that of longitudinal UVA milling, that is, the high-frequency cutting force return to zero.
The coefficient of cutting force
The coefficient of cutting force is related to cutting parameters, work-piece-tool material matching, tool geometry, machining system parameters and other factors. The identification experiment is to measure the three-dimensional cutting force under the given parameters. According to the experiment results, the model can be identified and the coefficient of cutting force can be calculated.
Solution
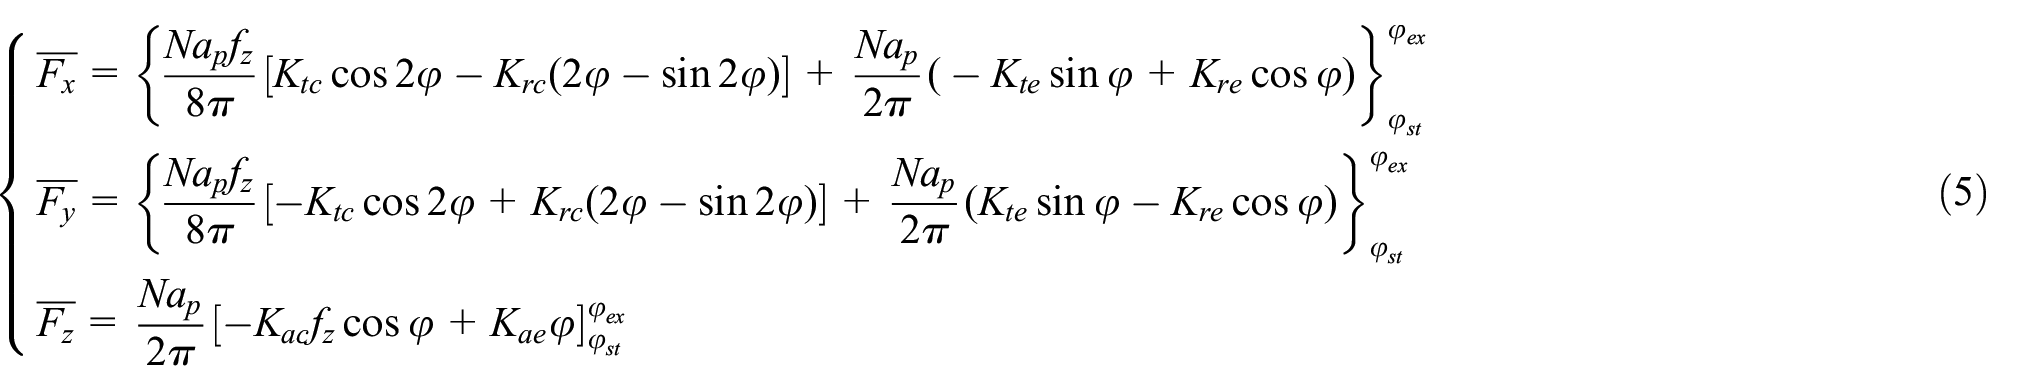
The coefficient of cutting force is obtained by the mechanical model method of ordinary milling as shown in formula (4):
The average cutting force of each cutting edge can be obtained by integrating the immersion angle
In order to facilitate calculation, slot milling is adopted in the experiment, that is, the cut in angle

By measuring the average milling force under different feed rate

Where,

The correlation coefficient of linear regression is:

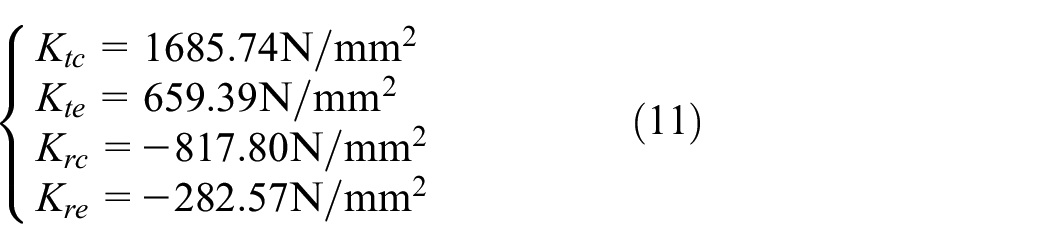
The cutting force coefficients are:

Experiment
Experimental equipment are given in Table 2 and Figure 5.
Experimental equipment.


The UVA milling device.
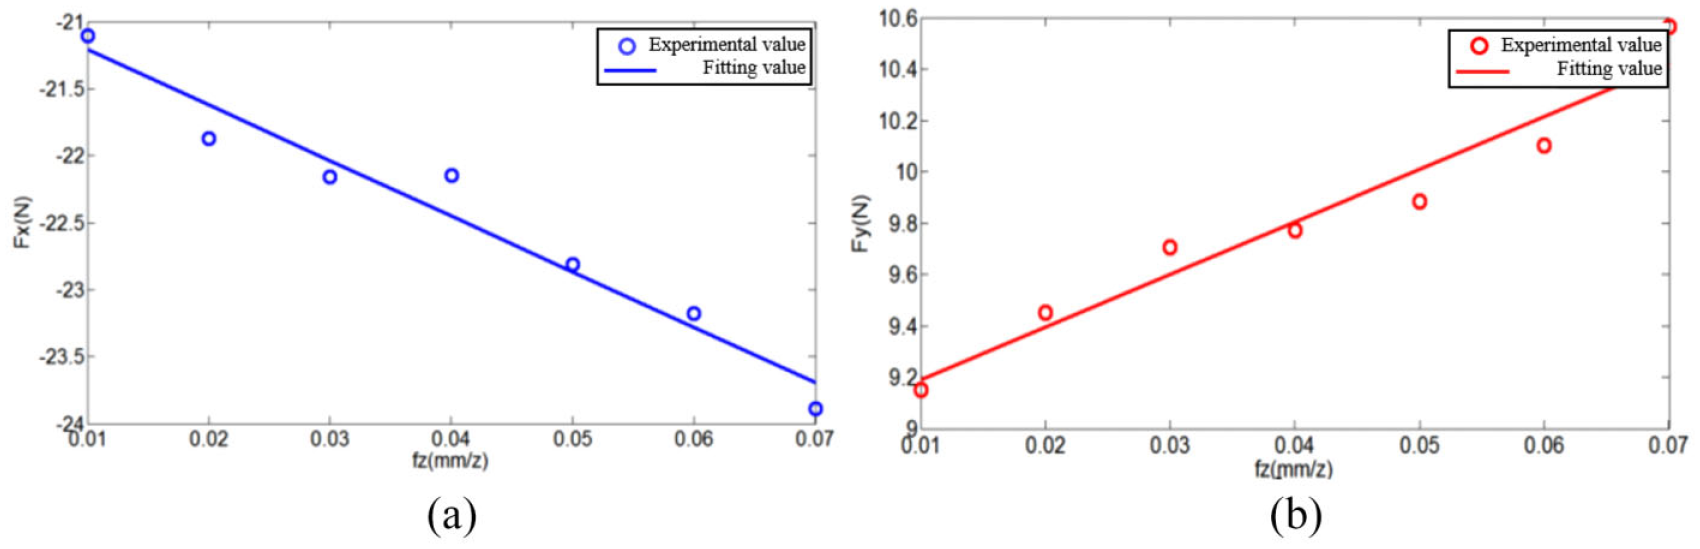
The experiment of cutting force with two-edge milling cutter (torsional UVA milling)
The experiment results are given in Table 3. The relationship between the average cutting force and the feed rate of per tooth is obtained by linear regression, as shown in Figure 6(a) and (b). According to formula (9), the correlation coefficient between the fitting value of cutting force and the measured value is
Experiment results.

Experimental cutting force and its linear fit: (a) linear fitting of Fx and (b) linear fitting of Fy.
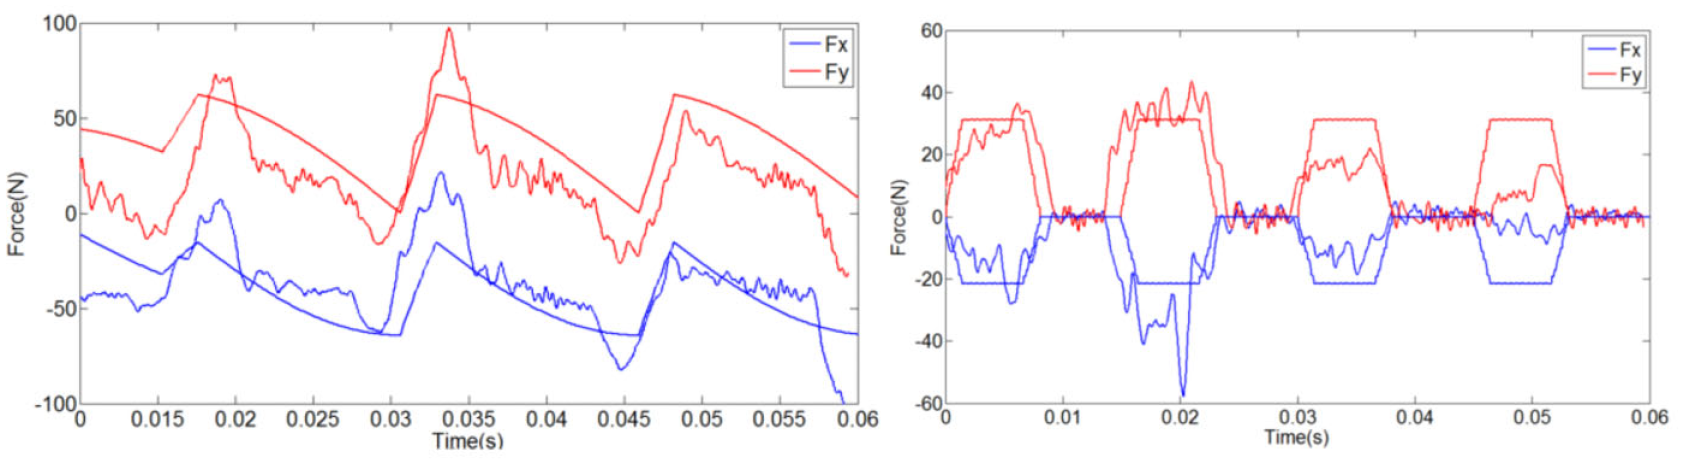
Substitute the identified cutting coefficient into the formula (10). The comparison results(predicted with the experimental value) are shown in Figure 7. It can be seen from the Figure 7 that the predicted values is relatively accurate, and the value is basically consistent with the experimental value.
Comparison between experimental and predicted values: (a) end milling and (b) side milling.
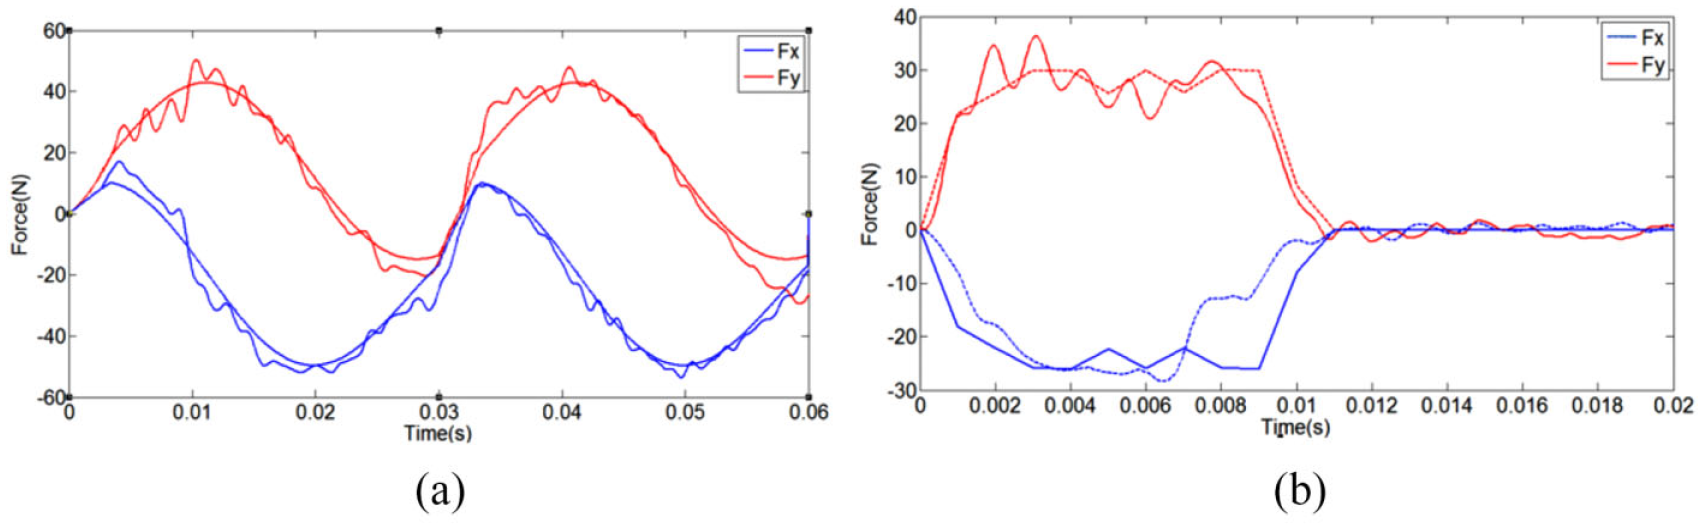
Experiment again after adding torsional ultrasonic vibration to the milling cutter. Experiment parameters are as follow: two-tooth end milling cutter, back draft: 0.05 mm, axial cutting depth: 5mm, feed rate: 0.01 mm/z per tooth, ultrasonic frequency: 33.31 kHz, current: 0.31 A, torsional amplitude: 0.0055 rad. The experiment and predicted values are shown in Figure 8. Due to the rigidity of the machine tool and the milling cutter, the fluctuates of cutting force waveform greatly during the experiment, which is difficult to fully match the predicted values. The reason for this problem is that the frequency of the acquisition card of the dynamometer is lower than the ultrasonic vibration frequency. But from the Figure 8 that the time interval between the two peaks or valleys from the experiment is similar to simulation, so the model can approximately describe the cutting force obtained from the torsional UVA milling.

Comparison between experimental and predicted values with torsional UVA milling: (a) linear fitting of Fx and (b) linear fitting of Fy.
The experiment of cutting force with four-edge end milling cutter (longitudinal UVA milling)
The experiment results are given in Table 4. The relationship between the average cutting force and the feed rate of per tooth is obtained by linear regression, as shown in Figure 9(a) and (b). According to formula (9), the correlation coefficient between the fitting value of cutting force and the measured value is

Experiment results.


Experimental cutting force and its linear fit: (a) linear fitting of Fx and (b) linear fitting of Fy.
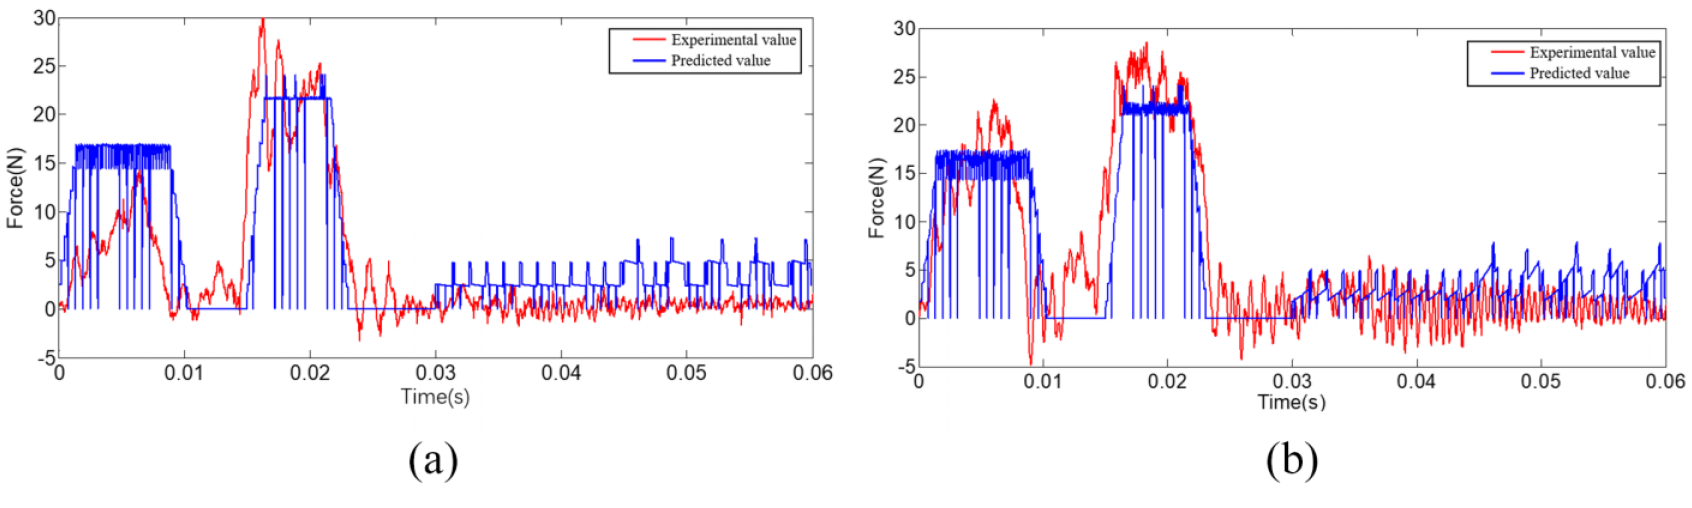
Substitute the identified cutting coefficient into the formula (10). The comparison results(predicted with the experimental value) are shown in Figure 10. It can be seen from the Figure 10 that the predicted value is consistent with the actual value in the overall trend, but there are some deviation near the peak value. This may be due to the sudden change of instantaneous cutting thickness caused by tool jumping during the process of cutting multiple cutting edges into the material at the same time, resulting in a large deviation near the cutting force peak. And when a tooth is cut out of the material, the sudden change of the force and the material relationship will cause a large fluctuation in the falling stage of the cutting force.
Comparison between experimental and predicted values.
Experiment again after adding longitudinal ultrasonic vibration to the milling cutter. Experiment parameters are as follow: rotating speed: 1000r/min, back feed: 0.05 mm, feed per tooth: 0.0375 mm/z, feed rate: 150mm/min, current: 0.3 A, ultrasonic vibration frequency: 33.41 kHz. The experiment results are shown in Figure 11. From the Figure 11 that in the cutting process, the tool has a large jump, resulting in different cutting forces of the four cutting edges. The cutting forces of the two cutting edges are zero during the longitudinal UVA milling process, that is, the two cutting teeth are not in contact with the workpiece. At the same time, the cutting force amplitude of the two cutting edges involved in cutting is also very small, and has a periodic tendency to zero. However, the experimental value shown in Figure 11 does not return to zero completely. This may be because the sampling frequency is close to the ultrasonic vibration frequency, so it is difficult to recover the zero point. However, from the comparison between the measured and the simulation value, there is a certain coincidence in the trend of returning to zero, which also verifies the feasibility of the ultrasonic vibration cutting force prediction model proposed in this paper.
Comparison between experimental and predicted values with longitudinal UVA milling: (a) Fx and (b) Fy.
Stability analysis of UVA milling
Stability prediction of UVA milling method
In the UVA milling process, when the cutting parameters reach a certain value, the tool and chip will be separated circularly. Because UVA has little effect on instantaneous cutting thickness and the state of instantaneous cutting thickness changes greatly, the research ignores the influence of UVA milling method on the instantaneous cutting thickness, and only considers the influence on the cutting state. The high-frequency machining mode of ultrasonic vibration only considers the effect of the net cutting time duty ratio in a single ultrasonic vibration period on the stability of the cutting system, without considering the interaction between the workpiece and the tool in each ultrasonic vibration period. The milling force model given in formula (13) is suitable for the workpieces studied in this paper (Table 5):


Meaning of the letters in formulas (13) and (14).


Where,

The definition of function


where
Based on formula (20) and (21), formula (13) can be converted into a dynamic formula in the form of state space as shown in formula (22):


Where:

The eigenvalues of the system transfer matrix are calculated by the full discrete method. The stability of the system is judged by the eigenvalue of the system transfer matrix. In order to obtain the predict lobe diagram under different milling methods, the following the system parameters are given in the Table 6:
System parameters.

The calculation parameter
Predict the lobe diagram under different modes.

As can be seen from Table 7, in the range of main shaft speed from 1000 to 3000 r/min, that is, in the range of working conditions where ultrasonic separation occurs, the stable lobe diagram of UVA milling is higher than that of ordinary milling. Especially in the low speed range (1000–1500 r/min), the stable lobe diagram of UVA milling is significantly higher than that of conventional milling. With the increase of rotating speed, the stable lobe diagram of UVA milling is gradually close to that of ordinary milling. Ultrasonic vibration has a greater impact on the stability at low speed. With the increase of speed, the impact on the stability will become smaller and smaller.
Process parameters
Proper process parameters are the key to improve the stability of UVA milling of TATWC. After verifying the validity of the model, the influence of process parameters on the stability of UVA milling method is analyzed by the model, to determine the best process parameters for machining TATWC under different processing methods.
Longitudinal UVA milling
This section uses the model established in the previous section to study the influence of longitudinal ultrasonic amplitude, ultrasonic frequency, radial immersion ratio and cutter tooth number on the stability of longitudinal UVA milling method. The system parameters are as follows: radial cutting coefficient
Figure 12 give the lobe diagram of longitudinal UVA milling method under different longitudinal ultrasonic amplitude. It can be seen from the Figure 12 that the stability of UVA milling method is higher than that of the ordinary milling system, the larger the longitudinal ultrasonic amplitude, the narrower the blade, and the higher the stability area of the milling system. When the
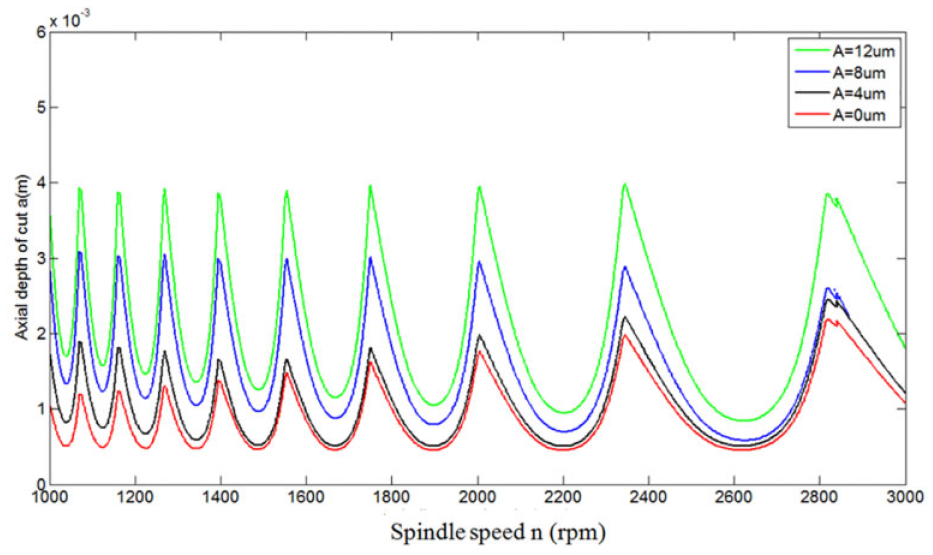
The lobe diagram of longitudinal UVA milling method under different longitudinal ultrasonic amplitude.
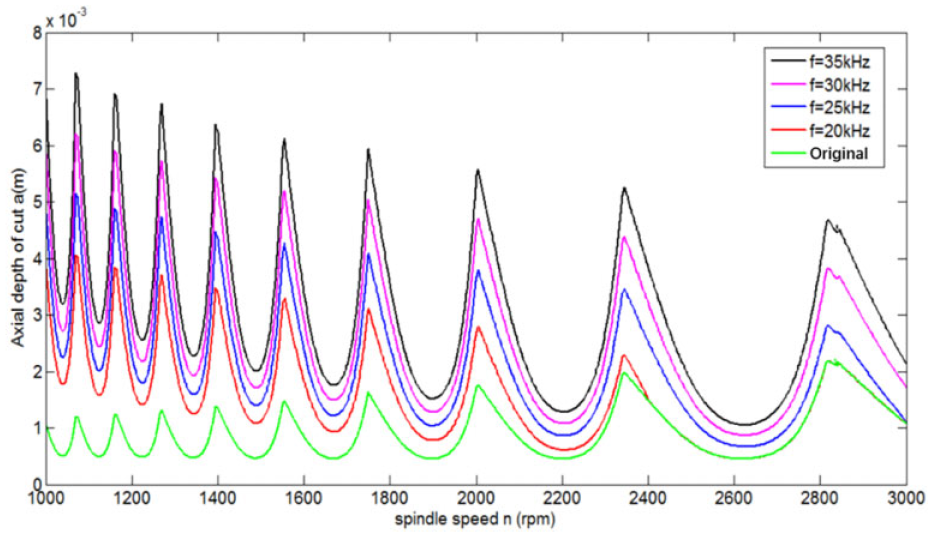
Figure 13 shows the lobe diagram of longitudinal UVA milling method under different longitudinal ultrasonic frequencies.

The lobe diagram of longitudinal UVA milling method under different longitudinal ultrasonic frequencies.
Figure 14 shows the influence of different radial immersion ratios on the stability of the longitudinal UVA milling method. The

The lobe diagram of longitudinal UVA milling method under different radius of immersion ratio.
Figure 15 shows the lobe diagram of longitudinal UVA milling method under different tool tooth number. The milling system adopts the previous process parameters,

The lobe diagram of longitudinal UVA milling method under different number of tool teeth.
Torsional UVA milling
This section uses the model established in the previous section to study the influence of ultrasonic torsional amplitude, ultrasonic torsional frequency, radial immersion ratio and tool tooth number on the stability of torsional UVA milling method. The system parameters are as follows: radial cutting coefficient
It can be seen from Figure 16 that the stability lobe diagram of the torsional UVA milling method is higher than that of the ordinary milling system, so the stability of the torsional UVA milling method is higher than that of the ordinary milling system. And it can be seen from Figure 16 that with the increase of torsional ultrasonic vibration amplitude, the higher the system stability lobe is. This is because with the increase of amplitude, the net cutting time of the cutter tooth participating in cutting decreases, so the greater the amplitude, the higher the stability. However, with the increase of rotating speed, the net cutting time of single ultrasonic vibration increases, so the blade diagram will become lower and lower until the net cutting time duty ratio is 100%. The stable blade of the torsional ultrasonic vibration auxiliary milling system coincides with the stable blade of the ordinary milling system, and the ultrasonic vibration effect that affects the stability of the milling system will disappear.

The lobe diagram of torsional UVA milling method under different torsional ultrasonic amplitude.
As can be seen from Figure 17, with the increase of the torsional ultrasonic frequency, the stability lobe diagram of the milling system will move upward, because with the increase of the frequency, the net cutting time duty ratio in the single ultrasonic vibration process will decrease. However, with the increase of rotating speed, the ultrasonic separation effect will weaken until the tool is no longer separated from the workpiece, and then the influence of ultrasonic vibration on stability will disappear.
The lobe diagram of torsional UVA milling method under different torsional ultrasonic frequencies.
As can be seen from Figure 18, with the decrease of radial entry ratio, the absolute stability region and relative stability region of the torsional UVA milling method will be greatly improved, and the bottom of the blade will gradually move backward and the top will tilt forward.

The lobe diagram of torsional UVA milling method under different radius of immersion ratio.
It can be seen from Figure 19 that the smaller the number of teeth, the better the stability of the corresponding milling system. From the Figure 19, it can be seen that the stability of the three-tooth and four-tooth milling systems is not much different, while the stability of the two-tooth milling system is significantly better than that of the three-tooth and four-tooth milling systems.

The lobe diagram of torsional UVA milling method under different number of tool teeth.
Experimental analysis of stability with UVA milling
Modal parameter identification experiment of TATWC
Identifying the structural parameters of the dynamic model and the cutting force coefficient in the cutting force model are the basis for accurately predicting the stability region of the UVA. Therefore, it is necessary to obtain the cutting force coefficient of titanium alloy two-tooth milling cutter through slot milling experiment and obtain the structural parameters of TATWC through the modal parameter identification experiment of TATWC.
The DASP vibration and noise identification system developed by the Oriental Research Institute is used to conduct modal identification experiments on TATWC. The main hardware equipment is shown in Table 8, and the actual modal experiment system is shown in Figure 20. The TATWC itself has infinite modes, but generally the first few natural frequencies concentrate most of the energy of vibration and have a great impact on the machining vibration. Therefore, the influence of the first order natural frequency on the machining stability is mainly studied.
Main equipment for modal experiment.

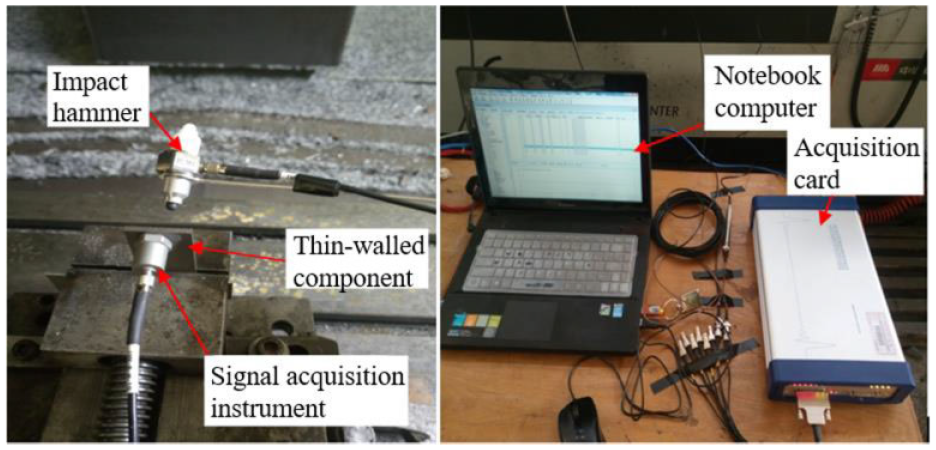
Actual experiment system.
The workpiece is 1 mm thick, 20 mm wide and 40 mm out of the vice. Fix the acceleration sensor on one side of the workpiece and hammer the point corresponding to the acceleration sensor on the other side of the workpiece. Use a force hammer to knock the workpiece several times, each time with even force, and there should be enough time between the two blows to make the workpiece release all kinetic energy and avoid repeated blows. The knock result is analyzed by the modal experiment software of DASP system, and the workpiece transfer function curve is obtained, as shown in Figure 21. The measured first-order modal parameters of TATWC are as follows: natural frequency 456 Hz, modal mass 3.96 g, damping ratio 0.014.

Curve of the transfer function of TATWC.
Stability experiment of longitudinal UVA milling
The instruments and equipment used in the experiment:
The VMC850E CNC machining center has a maximum torque of 35.8 Nm, a maximum spindle speed of 8000r/min, and a self-developed BT40 ultrasonic tool handle;
Dynamometer: Swiss Kistler 9257B three-way dynamometer.
The performance parameters of the workpiece and tool are given in Table 9. The experimental device is shown in Figure 22.
Characteristics of workpiece and tool.


Experimental device for ultrasonic vibration cutting.
The stepped horn is equipped on a four-edge end mill to obtain longitudinal ultrasonic vibration. The longitudinal UVA milling method is shown in Figure 23.

Device for the longitudinal UVA milling.
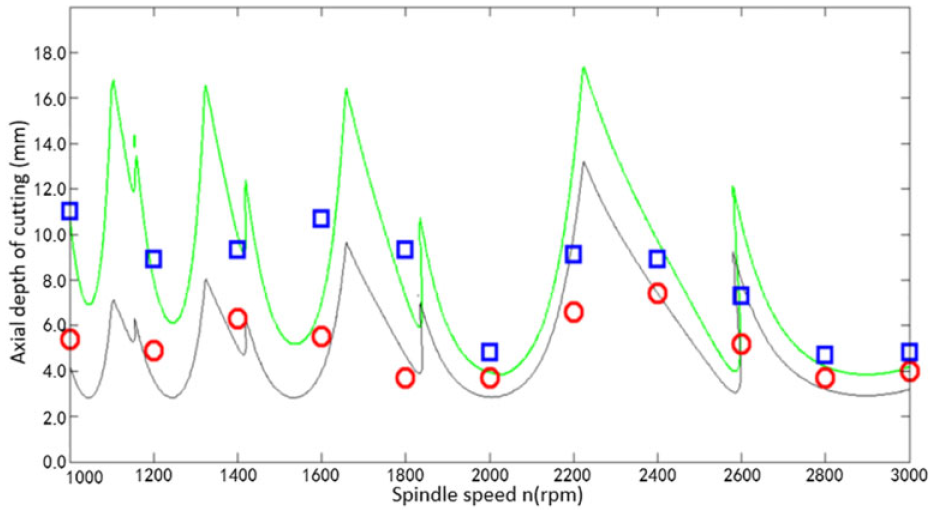
In the experiment, the workpiece is processed by oblique cutting, that is, the axial cutting depth is gradually increased during the cutting process, to verify the accuracy of the stability lobe diagram of the UVA milling method. The stability lobe diagram based on the coefficient of cutting force and modal parameters is shown in Figure 24. The black curve in Figure 24 is a stable blade diagram for general milling, and the green curve is a blade diagram for longitudinal UVA milling. The cutting parameters of the system are: radial cutting depth 0.05 mm, ultrasonic vibration frequency 33.93 kHz, ultrasonic current 0.4 A, and corresponding axial amplitude 4.7um. For the oblique cutting of the workpiece, the axial cutting depth increases continuously from 3 mm to 15 mm.
Stability leaf of the longitudinal UVA milling method.
Several representative groups of machined workpiece surface morphologies are shown in Figure 25. The limit cutting depth of stable cutting is obtained by measuring the axial cutting depth corresponding to the position where the vibration marks begin to appear on the workpiece surface. In addition to the axial cutting depth, the surface roughness data of the processed workpiece is also measured using a white light interferometer. The experiment results are shown in Table 10. In Figure 25(a) to (d) are the machined surface topography of ordinary milling workpiece, and (e) to (h) are the machined surface topography of longitudinal UVA milling. Through comparison, applying longitudinal ultrasonic vibration has greatly improved the limit cutting depth.

Surface morphology of workpieces by longitudinal UVA milling: (a) s1000 rpm, (b) s1800 rpm, (c) s2000 rpm, (d) s2400 rpm, (e)s1000 rpm (UVA), (f) s1800 rpm (UVA), (g) s2000 rpm (UVA), and (h)s2400 rpm (UVA).
Ultimate depth of cutting depth with two processing methods.

Mark the limit cutting depth in Table 10 to Figure 24, where the blue box is the limit cutting depth of longitudinal UVA milling obtained from the experiment, and the red circle is the limit cutting depth of ordinary milling obtained from the experiment. The green line lobe in Figure 24 is the limit cutting depth of longitudinal UVA milling stability, and the black line is the limit cutting depth of common milling stability. It can be seen from the figure that the limit cutting depth of longitudinal UVA milling is larger than that of ordinary milling. And with the increase of rotating speed, the limit cutting depth obtained from the experiment is closer and closer to the predicted value, but there is still a deviation. This may be because the ultrasonic amplitude cannot maintain a good stability during machining. When the tool cuts the workpiece, the ultrasonic current will decrease and fluctuate, but the overall trend is consistent with the predicted value.
From the surface roughness data shown in Table 10, it can be observed that the surface roughness of the workpiece processed using longitudinal UVA milling is significantly lower than that of the workpiece processed using general milling, indicating that longitudinal UVA milling can achieve better processing quality.
Stability experiment of torsional UVA milling
Figure 26 is a device for the torsional UVA milling method. The system is composed of a two-edge end milling cutter and a spiral grooved horn. The system parameters are: radial cutting depth 0.05 mm, ultrasonic vibration frequency 34.12 kHz, ultrasonic current 0.3 A, and corresponding torsional amplitude 4.8um. For the oblique cutting of the workpiece, the axial cutting depth is continuously increased from 3 mm to 15 mm.

Device for the torsional UVA milling.
The surface morphology of the workpiece after machining is shown in Figure 27(a) to (d) is the workpiece surface after ordinary milling, and (e) to (h) is the workpiece surface processed by torsional UVA milling. It can be seen from the Figure 27 that under the same processing parameters, the vibration lines on the surface of torsional UVA are less than those on the surface of ordinary milling. At low speed, this phenomenon is more obvious. The experiment results are shown in Table 11.

Surface morphology of workpieces by two processing methods: (a) s1200 rpm, (b) s1600 rpm, (c) s2200 rpm, (d) 2800 rpm, (e) s1200 rpm (UVA), (f) s1600 rpm (UVA), (g) s2200rpm (UVA), and (h) 2800rpm (UVA).
Ultimate depth of cutting depth with two processing methods.

The green line in Figure 28 shows the limit cutting depth of the torsional UVA milling, and the black line shows the limit cutting depth of ordinary milling; The blue box is the limit cutting depth of torsional UVA milling obtained from the experiment, and the red circle is the limit cutting depth of ordinary milling obtained from the experiment. From the Figure 28 that the limit cutting depth of torsional UVA milling is much larger than that of ordinary milling at low speed. With the increase of rotating speed, the limit cutting depth obtained from the experiment is closer to the predicted value, but there is still a deviation. This may be because the ultrasonic amplitude cannot maintain a good stability during machining. When the tool cuts the workpiece, the ultrasonic current will decrease and fluctuate, but the overall trend is consistent with the predicted value.

Stability leaf of the UVA system.
From the surface roughness data shown in Table 11, it can be observed that the surface roughness of the workpiece processed using torsional UVA milling is significantly lower than that of the workpiece processed using general milling, indicating that torsional UVA milling also can achieve better processing quality.
Conclusion
The paper studies the stability of TATWC with UVA milling method and draws the following conclusions:
By introducing a characterization function, a model of cutting force of UVA milling method is established; The coefficients of cutting force between four-edge and two-edge end milling cutters and titanium alloy are solved through experiments. The model is verified by comparing the experimental and predicted values of cutting force;
The stability prediction model of UVA milling method based on full discrete method is established, and the effect of various process parameters on the stability of UVA milling method is researched. Based on theoretical analysis, the modal characteristics of TATWC are measured through modal experiments. The feasibility of the stability prediction model of UVA milling method is verified by cutting TATWC with variable cutting depth.
There is still much to be explored about the stability of UVA milling method. For example, the impact of factors such as tool and machine tool vibration on tool tip path, instantaneous cutting thickness, high-frequency intermittent cutting process of ultrasonic vibration, etc. The corresponding research will continue in the future work.
Footnotes
Acknowledgements
Thanks to Professor Jiao Feng of Henan Polytechnic University, Dr. Yao Chenglin of Tianjin University for their contributions to this paper.
Handling Editor: Chenhui Liang
Declaration of conflicting interests
The author(s) declared no potential conflicts of interest with respect to the research, authorship, and/or publication of this article.
Funding
The author(s) disclosed receipt of the following financial support for the research, authorship, and/or publication of this article: This work was supported in part by the Natural Science Research Project of Anhui Universities in 2020(KJ2020A0785) and Intelligent robot research team (kytd202205), National level project 2013sjjdg01 Anhui Xinhua University-Datang Mobile Communication Equipment Co., Ltd. Engineering Practice Education Center, First Class Professional Construction Point-Communication Engineering-2019ylzy01.