
Abstract
A thermoelastohydrodynamic (TEHD) coupling model is developed to study the static performance of a heavy-duty tilting pad thrust bearing (TPTB) under the effect of axis misalignment. To ensure the validity in calculating thermoelastic deformation, the calculation accuracy of the mechanical and thermal deformations used in the TEHD model is verified by the finite element method (FEM). The influence of the TEHD model on the flow state prediction is determined using different axial loads, and the numerical analysis of turbulence model and centrifugal inertia term on the bearing pad temperature is conducted at various operating rotation speeds. Compared with the aligned bearing performance, the characteristic distribution of each bearing pad under different misaligned angles is obtained. The effect of misalignment will cause local overheating of the thrust-bearing pads, especially for the heavy-duty TPTD. The results of this study can help to improve the prediction accuracy of heavy-duty TPTB characteristics and avoid harmful misalignment effects. Therefore, it is necessary to consider the effects of misalignment, turbulence, and thermoelastic deformation in the design and analysis of thrust bearings.
Introduction
Turbine machinery, such as gas turbines, steam turbines, and centrifugal compressors, has gradually become large-scale and high-power. Consequently, matched thrust bearings inevitably face severe heavy-duty and high-speed operating conditions.1,2 Assuming that the axis misalignment occurs during machine operation, the working environment of the thrust bearing will worsen, and it can be easily damaged by uneven load distribution and pad burning. 3 For the TPTB, the thickness of the hydrodynamic lubrication film that carries the axial load of the heavy-duty thrust bearing can be skinny. 4 Therefore, even small misalignment levels can cause some thrust pads to be overloaded, resulting in the axial displacement failure of the bearing surface eccentric wear owing to the loss of load capacity. 5 Figure 1 depicts the high temperature carbon deposition caused by excessive axial force on the TPTB surface, and indicates that the babbitt location on the trailing edge of a pad is often the hottest. In the case of good alignment, the area of high temperature carbon deposition is the same, as shown in Figure 1(a). In the case of misalignment, uneven bearing capacity causes different coking and carbon deposition areas on the surface of each bearing pad, that is, the temperature of each bearing pad is different, as can be seen from Figure 1(b).

Axial displacement failure with high temperature carbon deposition: (a) alignment and (b) misalignment.
Thrust collar misalignment is a major cause of collapse in oil lubricated thrust bearings. Compared with the thrust bearing performance in the aligned condition, both the peak pressures and maximum temperature rise increased significantly in the misaligned state 6 ; the effect of misalignment on the bearing performance characteristics, such as friction and side flow, was not as significant as that on the load capacity. 7 As the misalignment angle increased, the thrust plate tilt caused a fluctuation of the bearing stiffness during the rotation period, which was exacerbated by an increase in the tilt angle. 8 For self-equalizing TPTBs, Gokaltun and DeCamillo 9 developed a finite element analysis (FEA) model to represent the interaction between the thrust bearing components under the influence of a misaligned rotor and suggested that the leveling mechanism worked more effectively at higher loads; Koosha and San Andrés 10 performed a comprehensive multiple-pad analysis to evaluate the performance of self-equalizing TPTBs accurately, and found that an ideal self-equalizing TPTB (without friction at the contacts) operated with larger minimum fluid film thickness and lower peak film pressure compared to those obtained in a non-equalizing bearing.
In theoretical research, there was an almost common practice to use thermohydrodynamics (THD)11,12 or thermoelastohydrodynamics (TEHD)13,14 in the performance analysis of TPTBs. The TEHD coupling model, considering the thermoelastic deformation of the bearing pads, was more acceptable and credible for predicting heavy-duty and high-speed thrust bearing performance. 15 In particular, the heat convection coefficient and oil thermal property could not be ignored, which significantly influenced the prediction results of the bearing parameters, especially when the thermal deformation of the thrust pads was dominant in the total deformation.16,17 Based on the two-way fluid-solid thermal interaction, transient TEHD analysis of the TPTB was carried out during the start-up and shutdown processes, 18 and a flow starvation model was integrated into an existing TEHD analysis tool to deliver load performance predictions for TPTBs operating at a reduced flow rate. 19
Turbulent flow20,21 affected the thrust bearing performance, such as bearing torque and load-carrying capacity.22,23 Initially, THD analysis was extended to the turbulent flow regime, and the dependence of oil viscosity on temperature was considered. 24 Mikula 25 measured pad temperatures in a TPTB operating under both laminar and turbulent flow conditions, found that babbitt temperatures also provide a convenient indicator of the transition from laminar to turbulent flow in the oil film. In further research, Brockett 26 deduced the generalized Reynolds equation by considering the turbulence and centrifugal inertia term based on the TEHD model of oil-lubricated bearings. Deng et al. 27 proposed a correction method for the turbulence parameters of water-lubricated thrust bearing to improve the accuracy of turbulent TEHD results. Koosha and San Andrés 28 found that the transition to turbulent flow at high speeds had an impact on the static load performance of the TPTB pads. Lin et al. 29 pointed out that the turbulent effect on the dynamic characteristics of high-speed water-lubricated spiral groove thrust bearing was much stronger than the cavitating effect.
This paper derives equations to solve the TPTB performance with mechanical and thermal deformations. To save calculation time and ensure accuracy, the generalized Reynolds equation and energy equation are solved by the finite difference method (FDM), while the finite element method (FEM) is used to solve the pad deformation caused by the oil film pressure and bearing pad temperature. The turbulent flow model and centrifugal inertia term of the lubricant are considered in the TEHD model. Based on the accuracy verification of the pad thermoelastic deformation calculated by a domestic finite element (FE) program, the influences of the turbulence model and misaligned conditions on the static thrust bearing performance are analyzed. Therefore, the present study combines misalignment and thermoelastic analyses in turbulent-operated TPTB.
Analysis and calculation theory of TPTB performance
Program calculation flowchart
A flowchart of the iterative algorithm for bearing pressure, temperature, and thermoelastic deformation is shown in Figure 2. In the analysis, the pressure solution of the generalized Reynolds equation is the innermost loop in the iterative loop nest, with the solution of the oil film thickness in the misaligned state. The Reynolds number is calculated to evaluate the flow status and determine the change in viscosity owing to turbulence. The Newton-Raphson method is used to adjust the pad inclination angle and oil film thickness at the support pivot, and the Reynolds equation is solved iteratively to ensure that the moment center is located at the pad center and the pressure integral is equal to the axial load.

Program calculation flowchart.
The middle loop outside the Reynolds equation cycle is a solution to the oil film temperature. The oil film energy equation is based on the flow predicted from the pressure solution and the changes in thermal conductivity and viscosity due to turbulence. The solid energy equation is calculated from the heat flux at the film-solid coupling interface and the oil sump temperature. The film-solid interface temperature resulting from the solid temperature is then used to ensure a fixed temperature for the oil film temperature solution. After the bearing solid temperature is updated, the oil film temperature is allowed to converge.
The outermost iterative loop corresponds to the elastic deformation of the pad. The oil film pressure distribution from the Reynolds equation (innermost loop) and the pad temperature distribution from the energy equation (middle loop) are used to determine the thermoelastic deformation. The deformation affects the pressure distribution on the oil film obtained using the generalized Reynolds equation.
In short, the flow status and oil viscosity results of innermost loop are used for the temperature calculation in middle loop, the results of innermost loop and middle loop are used for the deformation calculation in outermost loop, and the calculation results of outermost loop are used for the next iteration of innermost loop. It is worth noting that in the iterative search for the oil film thickness on each pad, the TEHD problem with thermoelastic deformation is solved in each iteration. When the root mean square (RMS) error for these various iterations becomes
Oil film thickness equation with misalignment effect
In the innermost loop of program calculation flowchart, a film thickness expression

where
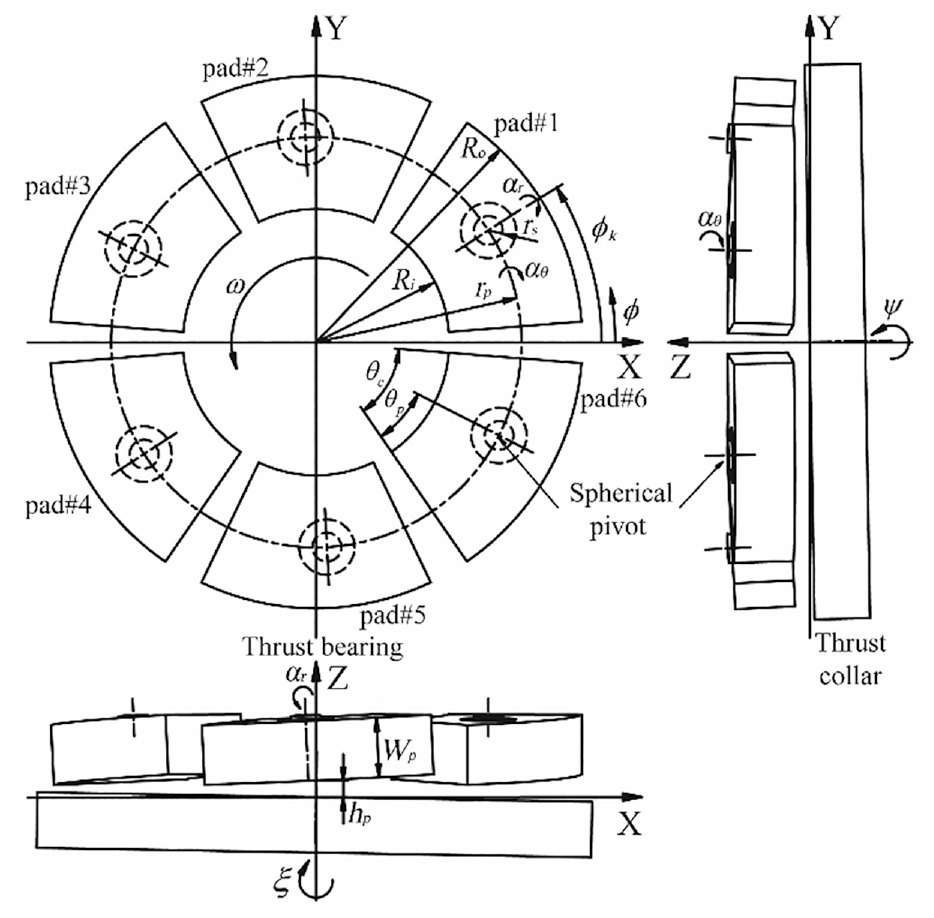
Geometric sketch diagram of TPTB with misalignment effect.
The misalignment can be specified in angles

where
Generalized Reynolds equation
After adding the centrifugal inertia term, the generalized Reynolds equation in innermost loop with the viscous centrifugal inertia term considering turbulence is derived in equation (3), in which the viscosity changes along with the oil film thickness. 30

where
Energy equation
The derivations of the oil film and pad temperature equations are detailed in Wang et al.,
31
in which the calculation accuracy of the thrust bearing program in this study is also verified. The difference is that this study focuses on the influence of the turbulence model and axis misalignment on thrust bearing performance in middle loop. The oil dynamic viscosity
The oil film energy equation, which considers turbulent viscosity and turbulent thermal conductivity, consists of the thermal convection term, thermal conduction term, and shear term. The thermal conduction term can be divided into three directions: radial, circumferential, and axial.

where
The solid energy equation used to solve for the heat transfer of the bearing pad is shown below.
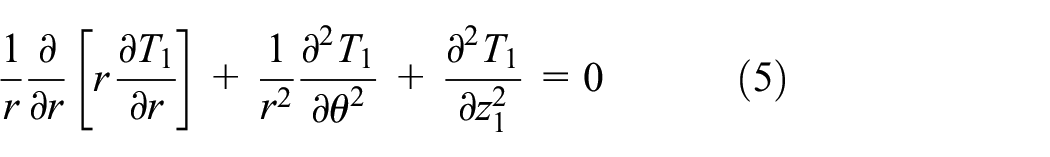
where
Turbulence model
Currently, an increasing number of turbomachinery TPTBs are operating in the turbulent flow regime. The Reynolds number is calculated as

Turbulence mainly affects the oil viscosity and thermal conductivity coefficient, which can be expressed by building a turbulence model in the following form26,28:


where,
The eddy-diffusivity multiplying factor
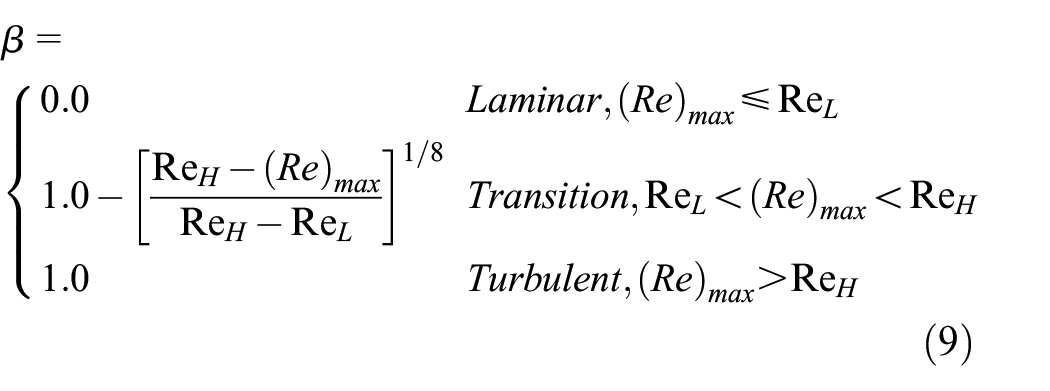
in which the lower critical Reynolds number
Elastic deformation equation
The equation governing the pad deformation is known as the elastic deformation equation. Based on the principle of virtual work, the thermoelastic deformation of the thrust pad is calculated by a domestic FE program in outermost loop, in which the finite element is a hexahedron element transformed by an isoparametric element. The virtual work principle combines the equilibrium equation, linear strain-displacement relationship, and boundary conditions in the global energy form, which is more suitable for obtaining solution results.26,32 The displacement form of the virtual displacement principle can be written as:

where
Program verification
Thrust bearing structure and lubrication parameters
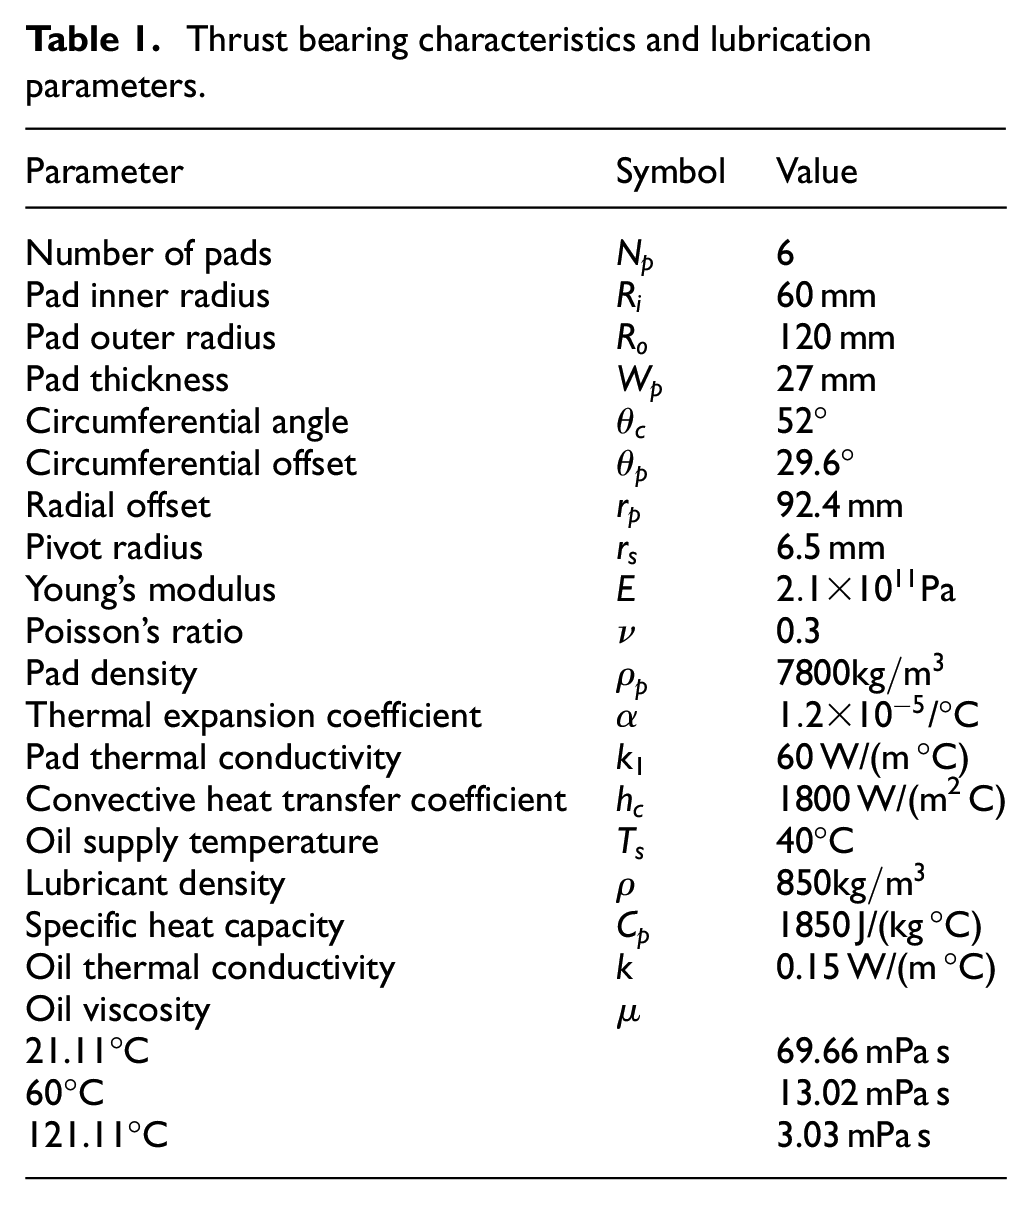
See Table 1 for details on the thrust bearing characteristics and lubrication parameters, including the pad thickness, Young’s modulus, Poisson’s ratio for thermoelastic deformation, and oil viscosity for the viscosity-temperature model. The thrust bearing originates from a centrifugal compressor unit with maximum axial load of 20,000 N and full rotation speed of 10,000 rpm. The material types of bearing pad and lubricating oil are 35CrMoA and ISO-VG32, respectively.
Thrust bearing characteristics and lubrication parameters.
Accuracy verification of pad thermoelastic deformation
In this study, the previous work is extended using the numerical solution of the thermoelastic equation, which consists of thermal and mechanical deformations caused by temperature and pressure gradients. To ensure the calculation accuracy of the thermoelastic deformation, the pad deformation results calculated using the domestic FE program are compared with those calculated using the commercial ANSYS software, as shown in Figure 4 to 6. The calculation region is divided into 27 × 25 × 17 grid nodes, and the center position of the constraint nodes is (15, 14, 17). Because only one node is constrained, the stress concentration will be too large; thus, the nodes within the radius of the spherical pivot are also constrained.

Comparison and verification of mechanical deformation: (a) FE program calculation result and (b) commercial software calculation result.

Comparison and verification of thermal deformation: (a) FE program calculation result and (b) commercial software calculation result.

Comparison and verification under the common action of the mechanical and thermal deformation: (a) FE program calculation result and (b) commercial software calculation result.
The following three cases are compared and verified. In the first case, a node force of 5 N is uniformly distributed on the upper pad surface to confirm whether the solution of the mechanical deformation is correct, as shown in Figure 4. In the second case, the entire pad is uniformly distributed at an isothermal temperature of 100°C, and the reference temperature of the FE model is 20°C. Figure 5 illustrates a comparison of the thermal deformation between the FE program and the commercial software. When the mechanical deformation and the thermal deformation occur together, the third case is that the uniform node force of 5 N and the isothermal temperature of 100°C are superposed on the bearing pad to verify the accuracy of the FE program, as shown in Figure 6.
The comparison and deviation of deformation between FEM program and ANSYS software are listed in Table 2, under the combined action of mechanical deformation and thermal deformation, the maximum deviation between the FE program and commercial software is −1.44 μm. Regardless of the maximum or minimum deformation, the deviation is within 2 μm, which shows that the domestic FE program has a high precision and meets the calculation requirements.
Bearing deformation comparison between FEM analysis and ANSYS result.

Results and discussion
Influence of TEHD coupling model on flow state prediction of oil film
This section focuses on the influence of thermoelastic deformation on the prediction of oil film flow state. An oil film grid of 27 × 25 × 21 and bearing pad grid of 27 × 25 × 17 are used for the numerical integration of the solution equation. When the axial load is 20,000 N and the rotation speed is from 3000 to 10,000 rpm with an interval of 1000 rpm, the influences of the mechanical deformation, thermal deformation, TEHD model, and THD model on the maximum Reynolds number are simulated by the domestic calculation program, as shown in Figure 7.

Influence of the TEHD model and THD model on maximum Reynolds number.
Throughout the simulation, the bearing operates with a Reynolds number ranging from 238.80 to 1419.08, thus covering the laminar, transition, and turbulent regimes. With an increase in rotation speed, the Reynolds number increased. The Reynolds number calculated by the TEHD model is higher than that calculated by the THD model, and the maximum difference is 122.71 at a rotation speed of 10,000 rpm, which accounts for 8.65% of the estimated value of the Reynolds number after considering the thermoelastic deformation. The Reynolds number calculation result that only considers mechanical deformation or thermal deformation is between the results calculated by the TEHD model and THD model, while the Reynolds number calculated only considering thermal deformation is greater than that calculated only considering mechanical deformation. The calculation result of the Reynolds number considering the mechanical deformation is slightly larger than that of the THD model. In comparison, the calculation result of the Reynolds number considering thermal deformation is marginally smaller than that of the TEHD model. The above results indicate that thermal deformation is critical for evaluating the thrust bearing response and transition from laminar to turbulent flow.
Considering the thermoelastic deformation, it is predicted that the oil flow is laminar when the rotation speed is less than 5000 rpm. For rotation speeds ranging from 5000 to 7000 rpm, the oil flow is in the transition state. The oil flow transitions to complete turbulence when the rotation speed exceeds 7000 rpm. If the thermoelastic deformation is not considered, the Reynolds number is relatively small, and the occurrence of turbulent flow may not be predicted at low speed. Combined with the theoretical analysis, it is found that the thermoelastic deformation affects the prediction of the turbulence model, especially the solution of the Reynolds number.
As shown in Figure 8, when the axial load reaches 20,000 N and the rotation speed reaches 5000 rpm, the maximum Reynolds number occurs at the outer diameter location of the oil film leading edge near the thrust collar, where the fluid velocity is the highest, while the maximum Reynolds number calculated by the THD model and TEHD model is 451.49 and 501.83, respectively, which shows that the flow is actually in transition flow rather than laminar flow. The Reynolds number is also zero at the point where the surface velocity is zero. The Reynolds number gradually increases from pad surface to thrust collar, while the Reynolds number decreases from leading edge to trailing edge. It is worth noting that the oil film thickness is magnified

Reynolds number comparison considering thermoelastic deformation or not: (a) THD model calculation result and (b) TEHD model calculation result.
Influence of turbulence model on TPTB performance parameters
The sheared fluid film produces a mechanical power loss that converts to thermal energy and raises the lubricant temperature. When turbulence occurs, the shear effect of fluid is weakened and the thermal mixing effect is enhanced, resulting in the reduction of oil film temperature. Figure 9 shows the influence of the turbulence model on the temperature calculation under the aligned condition, in which the oil film flow is turbulent at a rotation speed of 10,000 rpm and an axial load of 20,000 N. The maximum oil film temperature and bearing pad temperature are 86.73°C and 81.94°C, respectively, occurring at the outer diameter location of the oil film trailing edge near the pad surface. If the flow is assumed to be laminar, the calculated maximum oil film temperature and bearing pad temperature are 90.01°C and 85.32°C, respectively, as shown in Figure 10, which are 3°C–4°C higher than the results calculated by the turbulence model. This indicates that the calculation of laminar flow overestimates the oil film temperature in the turbulent state, that is, turbulent flow can reduce the oil film temperature. The greater the turbulence, the more significant the difference between the calculation results using the laminar model and the turbulence model.

Influence of the turbulence model on bearing performance parameters: (a) influence on oil film temperature contour and (b) influence on pad temperature contour.

Influence of the laminar model on bearing performance parameters: (a) influence on oil film temperature contour and (b) influence on pad temperature contour.
Figure 11 illustrates the comparison curves of the turbulence model and laminar model for the maximum bearing temperature and maximum oil film pressure when the axial load is 20,000 N and the rotation speed is from 3000 to 10,000 rpm in 1000 rpm increments. Owing to the convective heat transfer between the bearing pad and oil film, the bearing pad temperature is approximately 5°C lower than the oil film temperature. Under the laminar flow assumption, the maximum pad temperature, oil film temperature, and pressure increase with the rotation speed. In Figure 11(a), the difference between the turbulence model and laminar model is large within the rotation speed range of 8000–10,000 rpm, and the maximum pad temperature difference is 4.77°C, which accounts for 6.26% of the maximum pad temperature after considering the turbulence model due to an enhanced thermal mixing of the flow. In Figure 11(b), the oil film pressure is more sensitive to non-laminar flow. After considering the turbulence model, the maximum oil film pressure is slightly reduced in the transition state. When the flow becomes turbulent, the maximum oil film pressure drops significantly by 2.14% and increases again; however, it is still less than the maximum oil film pressure under the laminar flow assumption. Figure 11 shows that the occurrence of turbulence affects the oil viscosity and thermal conductivity coefficient, and further affects the temperature calculation; the maximum bearing temperature and pressure become low in this speed range with a high degree of turbulence.

Influence comparison of the turbulence model and laminar flow on the maximum bearing temperature and pressure: (a) influence on bearing temperature versus rotation speed and (b) influence on oil film pressure versus rotation speed.
Influence of centrifugal inertia term on TPTB characteristics
Viscous force plays a dominant role when the flow state is laminar with a low Reynolds number. When the flow state is turbulent with a large Reynolds number, the effect of hydrostatic pressure is weakened, and the hydrodynamic pressure and inertial force proportional to the speed that dominate the leading position. As it can already be seen in Figure 11(b), the turbulent oil film pressure considering the centrifugal inertia term is much larger than that without the centrifugal inertia term, and the maximum difference can reach 0.02 MPa. In Figure 12, the influence of the centrifugal inertia term on Reynolds number and bearing pad temperature is analyzed at an axial load of 20,000 N and rotation speeds from 5000 to 10,000 rpm with an interval of 1000 rpm. When the centrifugal inertia term is considered, the Reynolds number is smaller than when the centrifugal inertia term is not considered, as shown in Figure 12(a). Meanwhile, as shown in Figure 12(b), the pad temperature with the centrifugal inertia term is higher than that without the centrifugal inertia term. With an increase in the rotation speed, the difference gradually increases. When the rotation speed is 10,000 rpm, the maximum Reynolds number decrement is 89.46. The pad temperature increment is 3.92°C, which accounts for 4.78% of the highest pad temperature, considering the centrifugal inertia term. This reveals that the centrifugal inertia term is essential for predicting of the thrust bearing performance.

Influence of the centrifugal inertia item on maximum Reynolds number and maximum pad temperature: (a) maximum Reynolds number and (b) maximum pad temperature.
Effect of misalignment on TPTB performance
The thrust bearing during operation is affected by a certain degree of misalignment. Under the misaligned condition, the pads are inclined around the support pivot to bear the uneven load sharing in the TPTB. In Figure 13, the effects of misalignment on the maximum pad temperature under a light loading of 10,000 N and heavy loading of 20,000 N are analyzed at a rotation speed of 10,000 rpm. Each of the two loading cases is divided into three working conditions. The first condition is the aligned condition. The second one is to tilt 0.005° around the X axis and 0.005° around the Y axis, which is defined as the misaligned condition (

Influence of the misalignment on maximum pad temperature: (a) light loading of 10,000 N and (b) heavy loading of 20,000 N.
For the light loaded cases, as can be seen in Figure 13(a), the maximum temperature difference between the misaligned condition (
Figure 14 shows the change curve of the maximum bearing pad temperature with the tilting angle. Due to the self-balancing effect of TPTB pad, when the axial load is 10,000 N, the axis misalignment has a small impact on the pad temperature, but when the axial load is 20,000 N, the maximum bearing pad temperature has a significant increase with the increase of the tilting angle.

Maximum pad temperature versus tilting angles.
Figure 15 illustrates the temperature distribution on each pad for the misaligned condition (

Bearing pad temperature contour for the misaligned condition (
To analyze the misalignment effect on the bearing lubrication performance under a heavy duty of 20,000 N, bar charts of the minimum oil film thickness, maximum oil film pressure, and maximum oil film temperature of each pad under the misaligned condition (

Bar charts for bearing lubrication performance: (a) minimum oil film thickness, (b) maximum oil film pressure, and (c) maximum oil film temperature.
The oil film pressure contour for the misaligned condition (

Misaligned oil film pressure contour.

Misaligned oil film temperature contour.
Conclusions
By comparing the THD and TEHD solutions, it is observed that the calculation of the Reynolds number is related to the thermoelastic deformation of the bearing pad. Thermal deformation is more critical than mechanical deformation when evaluating the thrust bearing response and the transition from laminar flow to turbulent flow. If thermoelastic deformation is not considered, the Reynolds number will be too small to predict the occurrence of a nonlaminar flow over time.
Turbulent flow is beneficial for the thrust bearing operations. When turbulent flow occurs, the predicted oil film temperature is overestimated using the laminar model. The more serious the turbulence, the more significant the difference between the laminar model and turbulence model in predicting the thrust bearing performance, as turbulence affects the oil viscosity and thermal conductivity coefficient. In addition, centrifugal inertia increases the maximum oil film pressure, thereby affecting the Reynolds number and thrust bearing temperature.
The misalignment effect has an important influence on the static performance characteristics of the thrust bearing, and the TPTB can effectively deal with the misalignment. The resulting maximum pad temperature of the misaligned condition is greater than that of the aligned condition, especially for the heavy-duty TPTB. The misalignment effect reduces the oil film thickness and increases the oil film pressure and temperature on the pad at the most severely misaligned position.
The results of this paper are helpful to improve the prediction accuracy of the heavy-duty tilting pad thrust bearing performance and avoid the harmful misalignment effect. In the next step, the dynamic behavior equation of thrust bearing-rotor coupling system with multi degrees of freedom will be established based on dynamic performance characteristics of the thrust bearing, and the mechanism of coupling effect between thrust bearing and rotor bending on rotor vibration need be analyzed.
Footnotes
Handling Editor: Chenhui Liang
Declaration of conflicting interests
The author(s) declared no potential conflicts of interest with respect to the research, authorship, and/or publication of this article.
Funding
The author(s) disclosed receipt of the following financial support for the research, authorship, and/or publication of this article: This work is supported by the National Science and Technology Major Project (J2019-II-0016-0037) and the National Natural Science Foundation of China (No. 11902319).