
Abstract
The determination of Initial Track Tension (ITT) is an important issue for the moving performance of tracked vehicle under soft ground. At the present time, however, the selection of ITT only according to a moving performance or an operating condition under hard ground. Focus on this, a novel approach for determination of ITT without changing the basic vehicle parameters is proposed in this paper, which can improve the moving performance under soft ground comprehensively. Analytical models for predicting ground pressure under tracked vehicle on soft ground including ITT were used based on the track-soil coupling relationship, movement characteristics and turning characteristics of an articulated track vehicle, which applied to the straight driving condition, steering-driving condition and climbing condition. The intrinsic mechanisms between the ITT and the Mean Maximum Pressure (MMP) under roadwheels were revealed. The stresses produced by the action of track and sprocket, roadwheels, idle wheel, soil respectively were studied in consideration of the vehicle-soil mechanics theory and strength theory. The stress state and changes for an element of the track were investigated. What’s more, the relationship between the ITT and fatigue life of the track was explained in detail based on the Miner’s rule. On this basis, an optimal study for the ITT was performed taking advantage of NSGAII, which used the MMP under roadwheels and fatigue life of track as optimization objectives. And then, the determination principles of the ITT were presented, and it was identified by an articulated track vehicle. The results are significant to the prediction and control of the moving performance of track vehicle under soft ground.
Keywords
Introduction
The ITT is essential to the tracked vehicle mobility on soft ground. On the one hand, when the ITT is too small, the ground pressure under the track will increase and the vehicle passability will decrease even to chain off. On the other hand, when the ITT is too large, the fatigue life of the track will decrease. A series of investigation was carried out about the ITT.
It is widely accepted that the ground pressure under the track is influenced by the ITT under straight driving condition. Garber and Wong1,2 established a simulation model of ground pressure under track based on original Bekker pressure-sinkage equation and differentiation. It was observed that the maximum ground pressure under track was significantly influenced by the ITT. Wong et al. 3 demonstrated a static model of ground pressure under flexible track with the vehicle parameters and soil parameters, and it was noted that the ITT had obvious effect on the distribution of ground pressure. Based on this, Wong and Huang4–6 analyzed the influence of ITT on the ground pressure under roadwheels on snow. Wong et al. 7 performed the ground pressure under metal track based on Bekker pressure-sinkage equation. Furthermore, it has been shown that the ground pressure under metal track was related to the ITT.
A number of studies show that the ITT affected the traction performance through affecting the ground pressure. Wong et al.8–11 built simulation models for high-speed track and low-speed track respectively. The models were used to discuss the relationship between ITT and traction efficiency, and it was presented that the traction efficiency firstly increased then tended to be stable as the ITT increasing. Yang et al. 12 obtained the shear rate of soil using finite element analysis with the aim of modeling the ground pressure under metal track. What’s more, the traction model including the ITT was constructed, and the mechanism of slip rate and traction efficiency at different ITT was observed. Wills 13 obtained the relationship between the ITT and pull with the assumption that the distribution of ground pressure under metal track was sine. Bodin 14 examined the influence of vehicle parameters to traction performance, and found that the ITT was essential to the traction performance.
In addition, it was widely accepted that the ITT was closely related to the track tension. Huh and Hong 15 proposed an alternative approach in order to simulate the track tension around the idler wheel, and pointed out that the distribution of track tension was determined by the ITT. Rabbani et al. 16 studied the vertical loads acting on the roadwheels, and obtained the distribution of track tension around idler wheel through experiments. Huang et al.17–19 investigated the simulation of track tension including the ITT, and ensured that peak value of the track tension appeared under roadwheels.
From the above, the study of ITT mainly refers to the ground pressure, traction efficiency and track tension under straight driving condition. However, the ITT is also vital to the fatigue life of track. 20 The determination of the ITT is usually based on experience, that is, 10% vehicle weight. But, that doesn’t consider the moving performance of tracked vehicle comprehensively, especially under soft ground. Therefore, a novel approach was proposed in this paper. The influence regularity and mechanism of the ITT for the ground pressure and fatigue life of track on multiple operating conditions under soft ground were explained in detail, which, in turn, a multi-objective optimization of the ITT was explored, taking into account the multiple operating conditions of tracked vehicle under soft ground. After this, the design principles of ITT were presented here. It provides an important theoretical basis for exploring the tracked vehicle.
ITT-ground pressure models on multiple operating conditions
ITT-ground pressure model on straight driving condition
The literature 21 classified the track into flexible elements and rigid elements with the aim of constructing coupling relationship of track-soil based on the Bekker pressure-sinkage, Mohr-Coulomb theory, Rankine formula and so on. Further to that the ground pressure on straight driving condition was established considering some factors: ITT, track parameters, soil parameters. Then, the distribution of ground pressure was obtained taking the articulated tracked vehicle as an example, in the case that the ITT took a value of 10% vehicle weight. The specific model and parameters for prediction the ground pressure on straight driving condition were shown in equation (1) and Table 1.

Parameters for the analytical model.

Where T is the tension at the departure angle of the track system; T0 is the tension at the approach angle of the track system; ri is the radius for an arbitrary element of track; αi and βi represent the entry and exit angles of the ith roadwheel, respectively; p(l) is the ground pressure under the length of the track segment dl; Tβi, j and Tβi, j+1 represent the tensions of the jth and j+1th elements in the ith segment, respectively; βi, j represents the angle between the rigid grouser and horizontal direction; Δβi, j represents the angle between the rigid grouser and flexible track element; F1i, j is the normal force under the rigid grouser; F2i, j is the tangential force under the rigid grouser; F3i, j is the normal force under the jth flexible track element; F4i, j is the tangential force under the jth flexible track element; F5i, j is the force acting on the vertical surface of the rigid grouser; Kpy, Kpq, and Kpc are coefficients related to soil strength, and other parameters could be found in Table 1.
The resulting distribution of ground pressure on straight driving condition was shown in Figure 1. It can be seen that the ground pressure reaches peak under roadwheels and approaches zero under track only contacted with soil. Based on the above results, the trafficability of tracked vehicle was characterized by the MMP under roadwheels in this paper. The maintenance of the MMP under roadwheels against variation of ITT on straight driving condition was able to obtain based on the above model.

Distribution of ground pressure on sraight driving condition: (a) track of front carriage and (b) track of rear carriage.
ITT-ground pressure model on steering- driving condition
The literature22,23 elaborated the steering models of an articulated tracked vehicle. Then, the equations with velocity and acceleration of the articulated mechanism were expressed based on the principle of motion. Finally, the dynamic and kinematic models with centrifugal force were constructed. The vertical forces of each track system for front and rear carriages at different steering radius could be calculated by equation (2).

Where Fz1, Fz2, Fz3, Fz4 are the vertical forces of each track system for front and rear carriages respectively; v1, v2 are the velocity for front and rear carriages respectively; R is the steering radius; θ1 is the angle of sideslip between the front and rear carriages; h5, h6 are the distance from the pressure center to ground for front and rear carriages respectively; B is the width of tracked vehicle.
Based on the above models, this paper obtained the vertical forces of each track system for front and rear carriages. Then the results were set as the input variables for the ground pressure model in literature. 21 Thus, the distribution of ground pressure on steering-driving condition was obtained. The travel speed was set at 20 km/h and the steering radius was set at 45 m with the ITT taking a value of 10% vehicle weight, and the selected soil parameters were presented in Table 1. All other parameters and settings were described in literature.21–23 The resulting distribution of ground pressure on steering-driving was shown in Figure 2.

Distribution of ground pressure on steering-driving condition: (a) medial track of front carriage, (b) lateral track of front carriage, (c) medial track of rear carriage, and (d) lateral track of rear carriage.
The conclusions that can be drawn for the study, the ground pressure still reaches peak under roadwheels and approaches zero under track only contacted with soil on steering-driving condition. But there was a significant gap between each side of the track. The maximum ground pressure under roadwheels were 34.98, 147.26, and 95.27 kPa respectively for the medial track of the front carriage. The maximum ground pressure under roadwheels were 114.20, 154.37, and 167.81 kPa respectively for the lateral track of the front carriage. The maximum ground pressure under roadwheels were 150.28, 167.35, 170.98, and 147.84 kPa respectively for the medial track of the rear carriage, and the maximum ground pressure under roadwheels were 91.25, 124.31, 118.26, and 17.99 kPa respectively for the lateral track of the rear carriage. It was also evident that the offset of center-of-pressure occurred due to the centrifugal force. For the front carriage, the ground pressure under the first roadwheel of the medial track decreased very intensively due to the longitudinal offset of center-of-pressure, and it increased for the last roadwheel of the lateral track. So there was a trend toward outward laterality. For the rear carriage, in contrast, it had a trend toward inward laterality. Finally, the maintenance of the MMP under roadwheels against variation of ITT on steering-driving condition was able to obtain based on the above model.
ITT-ground pressure model on climbing condition
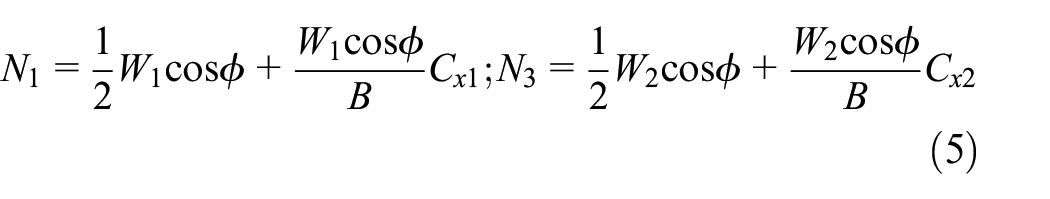
The uphill and downhill are common conditions for the tracked vehicle. As the load forms of those were mostly similar, only climbing condition were presented here. The travel speed was set in uniform speed, and the slope angle φ, were shown in Figure 3. The loads in tangential direction (N1, N3, N2, and N4) acting on the track systems were shown in equations (3) and (4).


Force situation of tracked vehicle on climbing condition.
Where W1, W2 are the vehicle weight of front and rear carriages respectively; Cx1, Cx2 are the lateral offsets between centroid location and geometric center for front and rear carriages respectively; FPy is the component in the normal direction of the hydraulic cylinder thrust.
In equations (3) and (4), FPy is the component in the normal direction of the hydraulic cylinder thrust, then:

Where FPmax is the maximum value of the hydraulic cylinder thrust; p is the maximum value of the hydraulic cylinder pressure, 16 MPa; D is the diameter of the piston rod, 50 mm.
The angle between the piston rod and ground was 8°, then:

It was evident that FPymax is typically small compared to the portion of gravity (W1 or W2) perpendicular to the ground. So FPy was small and sometimes can be neglected, and the equation (3) and (4) can be reduced to the formulas below.

The distribution of ground pressure on climbing condition was available with the revised model. 21 The travel speed was set at 20 km/h and the slope angle was set at 30° with the ITT taking a value of 10% vehicle weight, and the selected soil parameters were presented in Table 1. For this condition, the calculated ground pressure was shown in Figure 4. The maximum ground pressure under roadwheels were 132.29, 130.50, and 129.07 kPa respectively for the front carriage, and the maximum ground pressure under roadwheels were 141.57, 120.82, 110.14, and 109.36 kPa respectively for the rear carriage. The track tension of the posterior track increased due to the portion of forces acting on the roadwheels parallel to the ground. In turn, the loading capacity of track only contacted with soil was enhanced. At this time, the maximum ground pressure under roadwheels decreased gradually from anterior to posterior and the ground pressure under track only contacted with soil increased compared with other conditions. Finally, the maintenance of the MMP under roadwheels against variation of ITT was able to obtain based on the above model.

Distribution of ground pressure on climbing condition: (a) front carriage and (b) rear carriage.
The conclusion that the ground pressure reaches peak under roadwheels and approaches zero under track only contacted with soil is applied to the above there conditions. It is therefore reasonable that the MMP under roadwheels are selected as characterizing the trafficability of tracked vehicle in this paper. The maintenances of the MMP under roadwheels against variation of ITT for front and rear carriages were shown in Figure 5. Moreover, a series of simulation demonstrated that chaining off would occur when the ITT was less than 5% vehicle weight, and the ITT had little impact on the MMP under roadwheels when the ITT was greater than 50% vehicle weight. Based on the above analysis, the ITT was limited to 5% vehicle weight to 50% vehicle weight. This study made several conclusions as follows:
(1) The MMP under roadwheels reduce gradually as ITT increases in a range of 5% to 50% vehicle weight. This is because the loading capacity of track only contacted with soil is enhanced as the ITT increases, which in turn the ground pressure under roadwheels decreases. Additionally, the ITT, as explained above, has minor effects at the ground pressure, when it is greater than 50% vehicle weight.
(2) In terms of changing trends, it shows that the rate of MMP change for front carriage is greater than rear carriage. This result from the fact that the front carriage has three roadwheels and rear carriage has four roadwheels. Results from many studies shows that the more roadwheels has, the more uniform ground pressure becomes, and the loading capacity of track only contacted with soil is enhanced. So the magnitude of impact on front carriage is higher than rear carriage.
(3) It is obvious that there is a major difference in the ground pressure between the steering-driving condition and other conditions due to the offset of centrifugal force. However, the MMP for both side track systems is used to measure the trafficability, so the changing trends of MMP under roadwheels are similar to the straight driving condition.
(4) For the climbing condition, the MMP under roadwheels will change in a minor range or approach to a stable value when the ITT reaches 35% vehicle weight for front carriage and 31% vehicle weight for rear carriage. This is attributed to the fact that the track tension for climbing condition is greater than other conditions at equal ITT due to the portion of forces acting on the roadwheels parallel to the ground. Here slope angle 30° is applied as an example, so the portion of gravity parallel to the ground is 50% vehicle weight. It is possible to see that the larger the slope angle, the fast stable value will reach. However, related studies show that the ITT affects not only the MMP under roadwheels but also the climbing capability for the articulated tracked vehicle.

ITT-MMP under roadwheels.
ITT-fatigue life models on multiple operating conditions
The literature 20 established a coupled mechanics model including the ITT with the aim of resulting the stresses produced by the action of track and sprocket, roadwheels, idle wheel, soil respectively. Then, the fatigue life of track on hard ground was simulated based on Miner’s rule.
For the stress distribution of track on soft ground and hard ground, the primary difference between those were the ground pressure, shear stress and bending stress of track contacted with soil. For the any element i of track on soft ground, the ground pressure p(xi) and shear stressτ(xi) can be calculated using the ground pressure model. 21 Next, the sinkage z(xi) can be obtained according to equation (7). Based on the assumption that the adjacent elements i, i+1,i+2 of track contacted with soil was in a circle, the bending radius of track can be simulated, and the bending radius contacted with the roadwheels was still equal to the radius of roadwheels. In the concurrent phase, the ground pressure model (Part 2) can also simulate the track tension F(xi) for any element of track contacted with soil. The bending stress σ bi , tensile stress σ pi and centrifugal tensile stress were able to calculate based on the literature. 20 Additionally, the frictional resistance per unit area for the any element i of track on soft ground was shown in equation (8).
Based on the above research, the stress state of any element for track contacted with soil was biaxial stress state, and others were simple stress state as in Figure 6. From literature, 20 it is clear that the ground pressure p(xi) and shear stressτ(xi) are orders of magnitude lower compared to the bending stress σ bi , tensile stress σ pi . Since that, p(xi),τ(xi) and the frictional resistance per unit area could be neglected. Then, the stress state of track was all simplified as simple stress state.


Stress state of track: (a) track contacted with soil and (b) the other segments.
Where p(xi) is ground pressure; b is the width of track; z(xi) is sinkage; kc is the soil cohesive modulus; kφ is the soil frictional modulus; n is the sinkage exponent.

Where dFi is the frictional resistance per unit area; μ is the friction coefficient.
For the steering-driving condition, similarly, the frictional resistance could be neglected because of the same reason. Moreover, the subsidence of track on soft ground can lead to resistance acting on a side of track, as shown in Figure 7. The equation used to calculate the resistance acting on a side of track FT was shown in equation (9).

Then:

Where FR is the action on the soil scraped up; c is the soil cohesion; GR is the unit weight of soil scraped up; ψ is the angle of disrupted plane for soil; ζ is the friction angle of plate wall; φ is the soil internal friction angle; γs is the weight of soil per unit.
From the above analysis, the maximum ground pressure p1max = 167.81 kPa for front carriage, and the maximum ground pressure p2max = 167.35 kPa for rear carriage on steering driving condition. From equation (7), the maximum sinkage z1max and z2max can be acquired. Substituting all the parameters to equation (10), the specific expression of FTmax and ψ can be scored, and the relationship was illustrated in Figure 8. As can be seen from Figure 8, FT1max ≈ 16.8 Pa and FT2max ≈ 16.2 Pa. It was orders of magnitude lower compared to the bending stress σ bi and tensile stress σ pi . Since that, FT per unit area could be neglected. It is possible to see that the stress state of any element for track contacted with soil was three dimensional state, and others were simple stress state for steering-driving condition. Then, the stress state of track was all simple stress state after simplification.

Resistance acting on a side of track.

Relationship between FTmax andψ.
The stress state of track for climbing condition was the same as the straight driving condition describe above. In summary, the common models describing the stress of track for multiple operating conditions were built in equation (11).

Where Ω is the cross-section of track; E is the elastic modulus of track; q is the mass per unit length of track; v is the velocity of track; δ is the width of track; dk is the diameter of the kth roadwheel; Wj is the vehicle of the jth carriage; Cxj is the lateral offset of the jth carriage; T is the driving torque; dn is the diameter of sprocket; dm is the diameter of idler wheel; α n is the wrap angle of sprocket; α m is the wrap angle of idler wheel; α i is the wrap angle of any element; φ is the slope angle, taking the value 0 if the straight driving condition and steering-driving cond0ition. The resulting distribution of stresses produced by the action of track and sprocket, roadwheels, idle wheel, soil respectively was shown in Figure 9.
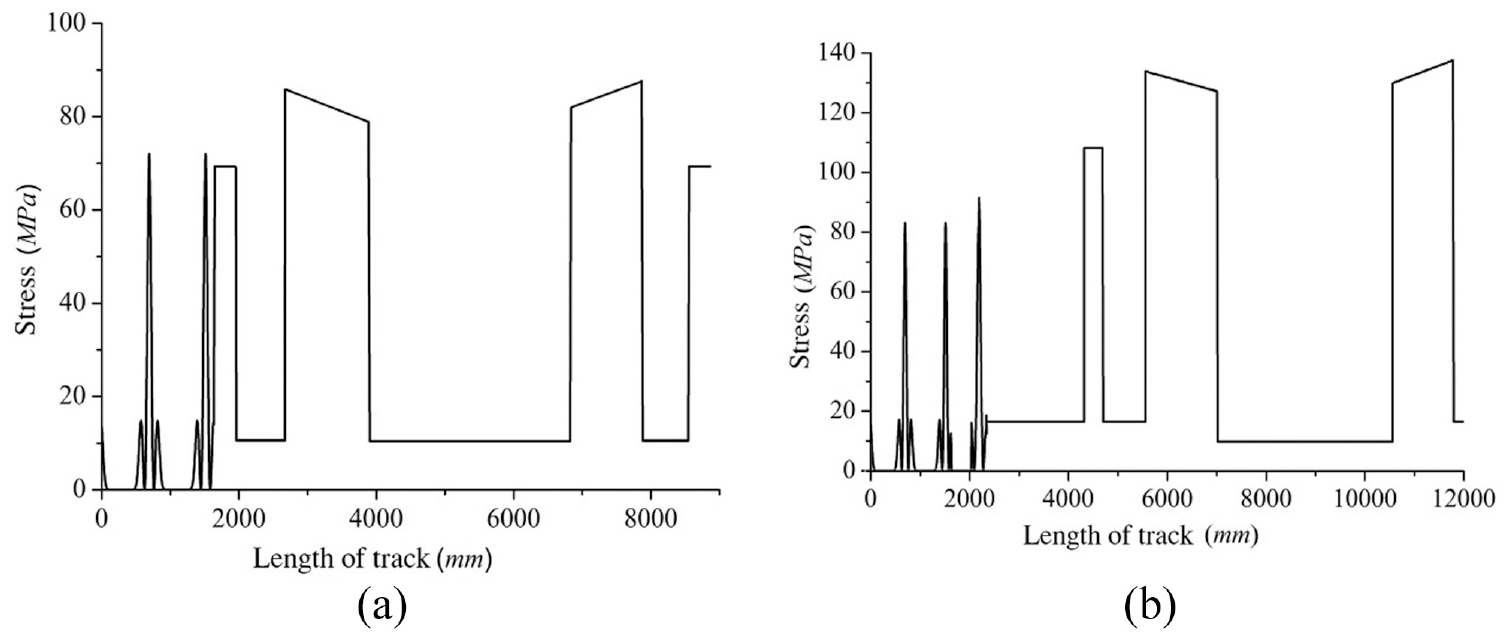
The stress of track for a cycle: (a) front carriage and (b) rear carriage.
Taking the dumbbell specimens of track with gauge length of 25 mm as test object, four bending fatigue experiments were carried out. The maximum stress of symmetric circulating variable stress were 300 MPa, 200 MPa, 150 MPa, and 100 MPa respectively. The numbers of stress cycle N were obtained under different maximum stresses above, which were provided by the manufacturers, as shown in Figure 10. Then the S-N fatigue properties curvilinear equation of test object was obtained by fitting, as shown in equation (12). The corrected S-N fatigue properties curvilinear equation of track was built in equation (14) according to the equation (13). The parameters for correction were shown in Table 2.


S-N fatigue properties curvilinear equation.
Parameters for correction.

Where σ-1 is the limit stress of symmetric circulating variable stress for test object; σ-1e is the limit stress of symmetric circulating variable stress for track; kσ is the effective stress concentration factor for track; qσασ is the theoretical stress concentration factor for track; εσ is the size and section shape factor for track; βσ is the surface quality coefficient for track; βq is the enhancement coefficient for track.

The track was performed at a cyclic stress, which was evident from equation (11). The GOODMAN model was used to account for the influence of average stress on fatigue life, as shown in equation (15). As the high cycle fatigue the Miner’s rule was used to calculate the fatigue life of track on soft ground, as shown in equation (16).

Where σ a is the amplitude of stress; σ M is the mean of stress; σ U is the ultimate strength of the material; σa (r =-1) is the transformed stress level when r = −1°

Where D is the rate of injury caused by cyclic stress, and the fatigue occurs when D is equal to 1; ni is applied numbers of cycles corresponding to σ i ; Ni is applied numbers of stress cycles leading to fatigue failures at stress ranges σ i .
For the track of front carriage and straight driving condition, the fatigue life value of N = 1.15 × 10⁷was computed from equations (14)–(16) with the ITT = 10% vehicle weight as an example. All other parameters and settings were described in literature. 20 The working time of 641 days was calculated according the length of track (8870 mm), travel speed (20 km/h) and 8 h daily. In the same way, the fatigue life of track was 602 days for rear carriage.
The fatigue life of track has an important relationship with the ITT. On the one hand, the ITT affects the tensile stress of track. On the other hand, the ITT affects the ground pressure and bending stress of track. Similarly, the ITT was limited to 5% vehicle weight to 50% vehicle weight. The minimum fatigue life of track for both side track systems is used to measure the fatigue life of track. The maintenances of the fatigue life against variation of ITT for front and rear carriages were shown in Figure 11, and this study made several conclusions as follows:
(1) As the ITT increases the fatigue life of track first increases and then decreases. This happens, because when ITT is smaller, the loading capacity of track only contacted with soil is smaller, and hence the bending deformation and bending stress of track are greater. As a result, the fatigue life of track is smaller. Next, as the ITT increases the loading capacity of track only contacted with soil enhances, hence the bending deformation, bending stress of track decreases and fatigue life of track increases. But after a certain value, the effect of ITT on the bending stress reduces. On the contrary, the effect of tensile stress on fatigue life enhances, which in turn leads to the fatigue life of track decreases.
(2) The fatigue life of track on climbing condition firstly reaches the maximum as the ITT increases. This is because of the portion of forces parallel to the ground on climbing condition, which makes the bending deformation and bending stress smallest at the same value of ITT.
(3) The fatigue life of track for rear carriage firstly reaches the maximum compared to the front carriage for the same condition. It is known from the above analysis that the ground pressure of rear carriage is more uniform than front carriage at the same value of ITT as a consequence of the number of roadwheels. Therefore, the track of rear carriage shows a smaller deformation than the front carriage.
(4) As found from equation (11), the equivalent stress of track contacted with roadwheels is the maximum stress and the equivalent stress of track from idler wheel to roadwheel is the minimum stress. Therefore, the stress amplitude decreases at first and then increases with the ITT increasing. In turn, this leads to the fatigue strength of track increases first and then decreases.
(5) It is known from the above analysis that the MMP under lateral track of front carriage is greater than the medial track for steering-driving condition, so the fatigue life of track for front carriage is measured by the medial track. Conversely, the fatigue life of track for rear carriage is measured by the lateral track.

ITT-fatigue life of track.
Optimization study of the ITT
It is evident that the ITT is important in ground pressure and fatigue life of track. Generally, the determination of ITT usually based on experience, that is, 10% vehicle weight. But, according to Figures 5 and 11, neither ground pressure nor fatigue life of track were not optimal. Therefore, a novel approach was proposed in this paper. Based on the above ITT-ground pressure models on multiple operating conditions and ITT-fatigue life models on multiple operating conditions, the ITT was defined as design variable x, the MMP under roadwheels average(p(x)) and fatigue life of track D(x) were defined as objective functions. Multi-objective optimizations of the ITT were explored based on NSGA–II. The design variable ITT was limited to 5% vehicle weight to 50% vehicle weight. In addition, constraints were performed that the maximum ground pressure under each roadwheel after optimization proadwheel(x) were all less than or equal to the maximum ground pressure under relevant roadwheel proadwheel(x) 10% , which could obtain from the Figures 1, 2, and 4. The multi-objective optimization model followed equation (17).
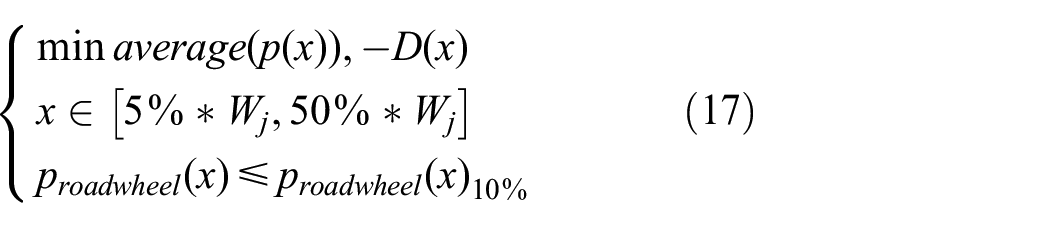
Where proadwheel(x) is the maximum ground pressure under each roadwheel after optimization; proadwheel(x) 10% is the maximum ground pressure under relevant roadwheel when the ITT = 10% vehicle weight.
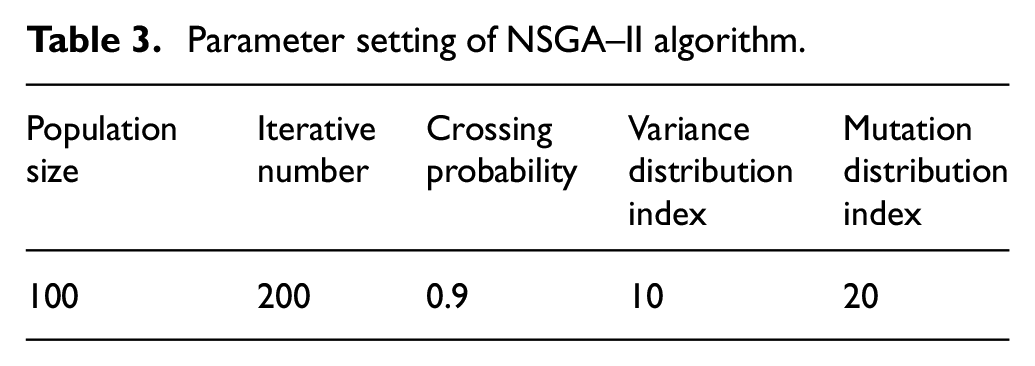
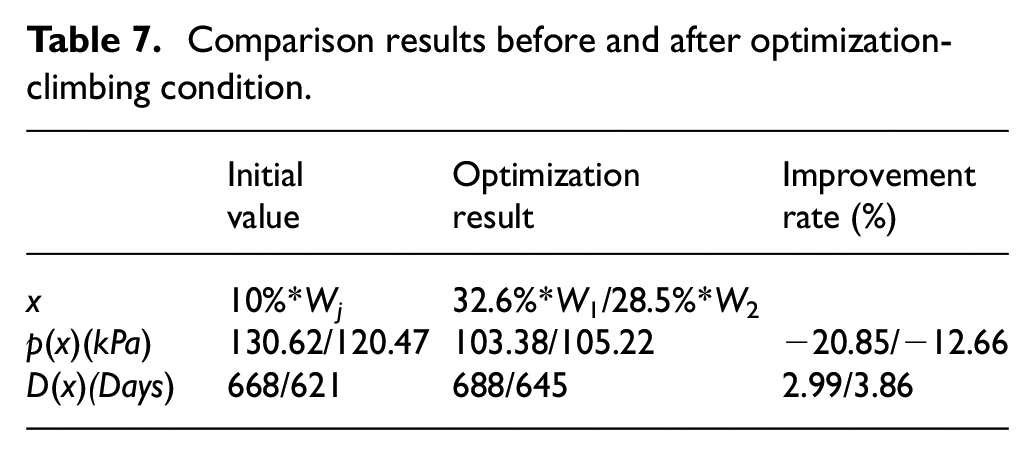
The parameter setting of NSGA–II algorithm was shown in Table 3. 24 The population size mainly referred to the real application situation, and the representative setting was selected. The iterative number, crossing probability, variance distribution index and mutation distribution index were selected the setting with good optimization ability according to the operation in practice. The Pareto fronts of multiple operating conditions calculated by NSGA–II were shown in Figures 12 to 14. The empirical approach of the ITT, that is, 10% vehicle weight was not included in the Pareto fronts. Moreover, for convenient applications, the values of ITT/vehicle weight (x/Wj) ratio were retained to one decimal place. The co-solution sets of multiple operating conditions were given in Table 4. For the front carriage and rear carriage, in the case of x/Wj ratio 32.6% and 28.5% respectively, the optimized results were listed in Tables 5 to 7. It can be seen that the maximum reduction rates of MMP were 27.11% and 12.66% respectively. Meanwhile, the maximum improvement rates of fatigue life were 10.14% and 13.29% respectively. This indicated that the approach can improve the moving performance under soft ground comprehensively without changing the basic vehicle parameters.
Parameter setting of NSGA–II algorithm.

Pareto front of straight driving condition: (a) front carriage and (b) rear carriage.

Pareto front of steering-driving condition: (a) front carriage and (b) rear carriage.

Pareto front of climbing condition: (a) front carriage and (b) rear carriage.
Co-solution sets on multiple operating conditions.

Comparison results before and after optimization-straight driving condition.

Comparison results before and after optimization-steering-driving condition.

Comparison results before and after optimization-climbing condition.
Determination principles of the ITT
The researches above were investigated for the optimization of ITT on multiple operating conditions, and the optimization results were obtained. But, in terms of the actual demands, the ITT was selected from the Pareto fronts comprehensively.
(1) Soil types
For the determination of ITT, the soil type is considered first, particularly the soft ground, so the major soil type is the primary factor for selecting the ITT.
(2) Operating conditions
The determination of ITT not only considers soil types but also considers the operating conditions. The ITT preferentially selects the co-solution if there is solution in common for the multiple operating conditions, which can juggle multiple conditions. From the above results, the MMP under roadwheels will change in a minor range or approach a stable value as the ITT increases for climbing condition (see Figure 5), setting the ITT as xtable at this moment. However, after a certain value, the fatigue life of track decreases as the ITT increases (see Figure 11). So the ITT preferentially selects the solution less than the xstable when the use frequency of climbing condition is high.
(3) Determination of the ITT for the case of an articulated tracked vehicle
This articulated tracked vehicle mainly uses in Western region of China, whose soil parameters are close to the soil in Table 1. The values of ITT were 32.6% vehicle weight and 28.5% vehicle weight respectively for front and rear carriages according the operating conditions and actual needs. It indicates that there are considerable improvements seen in both the ground pressure and fatigue life of track. The articulated tracked vehicle, whose working period includes the operating conditions above and four driving speeds, has continuously operated for more than 700 days. Fatigue of track does not develop in both front and rear carriages, which verifies the fatigue life of track and optimization of the ITT models to some extent.
Conclusion
The simulations of ground pressure on multiple operating conditions under soft ground were successfully performed. The influence regularity and mechanism of the ITT for the ground pressure were explained in detail. Generally, the MMP under roadwheels reduce gradually as ITT increases in a range of 5% to 50% vehicle weight, and the more the number of roadwheels is, the smaller the rate of MMP change. The MMP under roadwheels firstly reaches the stable value on climbing condition.
The stresses produced by the action of track and sprocket, roadwheels, idle wheel, soil respectively were studied, and the intrinsic relationship between the ITT and fatigue life of the track was discussed in detail based on the Miner’s rule. As the ITT increases, the fatigue life of track first increases and then decreases. Moreover, the fatigue life of track on climbing condition firstly reaches the maximum as the ITT increases.
An optimal study for the ITT was performed taking advantage of NSGAII, which can improve the moving performance under soft ground comprehensively without changing the basic vehicle parameters. And then, the determination principles of the ITT were presented. Based on this, for the front carriage and rear carriage, in the case of x/Wj ratio 32.6% and 28.5%, respectively, it can be seen that the maximum reduction rates of MMP were 27.11% and 12.66%, respectively. Meanwhile, the maximum improvement rates of fatigue life were 10.14% and 13.29%, respectively. Thus, the studies above play a role in the design and optimization of tracked vehicle.
Footnotes
Handling Editor: Chenhui Liang
Declaration of conflicting interests
The author(s) declared no potential conflicts of interest with respect to the research, authorship, and/or publication of this article.
Funding
The author(s) disclosed receipt of the following financial support for the research, authorship, and/or publication of this article: The research was financially supported by the Natural Science Foundation of Jilin province (NO. YDZJ202301ZYTS275) and the National Key Research and Development Program of China (NO.2016YFC0802703).