
Abstract
Foldover is a common, yet complex, transient boundary condition in several ‘metal forming processes’ including the barrelling compression test (BCT). The onset of foldover during BCT is comparable to that of necking in the tensile test. However, its role in flow curve identification has been ignored in the current literature. Methods to detect and measure its onset and growth during the processes are also not available. We propose three methods to identify the onset of foldover and measure its progress with deformation. These are conducted together with case studies of BCT to have a fundamental understanding of the onset and growth of foldover in the test and more general cases. Experimental and numerical methods are developed to accomplish this based on (1) direct measurement using tracing points, (2) energy-based and (3) geometry-based indirect measurements. These outline the required supplementary data and allow proper detection of the onset. In the first method, the migration of tracing points from the free surface to the platen-sample interface, simulated numerically, is monitored and measured visually. The second method employs the load-stroke data to calculate the total power input to the deforming system. In the third method, a criterion has been derived to detect the onset of foldover by monitoring the geometry of the sample profile during the test and comparing it to a reference quadratic profile. The observations and outputs of each method are compared and discussed.
Introduction
The barrelling compression test (BCT), also known as upsetting, uniaxial or axisymmetric compression, is a basic bench-scale metal forming process and it is extensively used to design the large scale and applied metal forming processes. The test is essential to indirectly study and measure the stress-strain behaviour, for example, to study dynamic recrystallisation.1,2 However, only a few indirect measurement methods exist with serious limitations.3,4 The erroneous BCT based flow curves have been perceived in numerous published works as measured values rather than computed values. To find more reliable and detailed solutions to the test, much more theoretical-analytical developments on the unwanted effects, for example, foldover and friction, are needed. The test’s complex boundary condition will be studied here.
As the BCT sample deforms, its boundary condition changes via partial migration of the sample’s free surface to the platen-material contact area, that is, foldover. Several unwanted effects, such as friction induced barrelling, 5 heterogeneous deformation and foldover, drive the test into a multiaxial mode. These effects complicate the interpretation and transformation of the test results to the real forming processes and thus eventually invalidate the physical simulation. Practically, the test cannot be performed in a uniaxial mode to simulate high strains over a wide range of test conditions 3 ; thus, it becomes impossible to avoid unwanted effects. Foldover increases with friction and deformation and is practically inevitable in many forming scenarios. One notes that the onset of BCT’s foldover and the tensile test’s necking are similar as they cause triaxiality and significant complexity in the calculation of flow stress from the measured data. Therefore, it is essential to partition the test data into those of pre and post foldover by detecting the onset of foldover.
To the authors’ best knowledge, there is no work on the identification of foldover’s onset or a criterion to measure its progress post-onset. Early works include those of Avitzur and Kohser 6 and Kohser and Avitzur 7 which did not propose a method to detect the onset of foldover. It is a common assumption in many earlier studies of the compression test that the foldover starts immediately along with the onset of deformation and that its final measured value grows homogeneously during the test. Consequently, in the existing literature, foldover has been only measured at the final stage of the test. This is an inevitable consequence of correlating the foldover inversely to an overall barrelled profile’s radius. As such, a finite radius and its corresponding estimated foldover form immediately when the test starts and the radius’ reduction with the test’s progress, increases the foldover. Other works include Ettouney and Stelson, 8 Tan, 9 Hou and Ståhlberg, 10 Akata and Çetinarslan 11 and Fan and Dong. 12 Ettouney and Stelson 8 model was established on two unjustified assumptions: (1) to assume a fixed total sum of free and contact surfaces of the sample, and (2) to trace the profile points on the sample using a superposition principle to estimate the foldover. A simplistic geometrical study on foldover was presented by Sivaprasad and Davies, 13 Altinbalik and Çan 14 and Lin and Lin 15 presented two analyses of the test which comprised the effect without detecting its onset or quantifying it. Akata and Çetinarslan 11 employed similar assumptions in their work.
A numerical-analytical model was developed by Yao and Mei. 2 Although Fan et al. 12 included foldover in their study, they did not consider the influence of this phenomenon on the test data or results.
Due to the close correlation between foldover and friction, a closer examination of the migration phenomena (foldover) and a summary of the available works on both are given here. Friction between the platens and the workpiece during metal forming can be indirectly measured during the test to simulate industrial processes. Tan 16 proposed a dynamic friction model in which the friction depends on both strain rate and normal pressure and employed the model to predict contact stresses in disc-upsetting. The model, however, does not account for barrelling and assumes a cylindrical profile which limits its applicability to real tests and processes. The barrelling was included in a frictional model developed by Avitzur. 17 The model was extended first by Ebrahimi and Najafizadeh. 18 They proposed the first ‘geometry based indirect measurement of friction during the test’. Numerical studies by Solhjoo 19 revealed that the method was unable to calculate the friction factor correctly. The work was reinvented by Solhjoo and Khoddam 20 focusing on indirect measurement of the barrelling during the test to improve the accuracy of the method by introducing more suitable barrelling parameters. Khoddam et al. 21 proposed an energy-based approach to evaluate closed-form solutions of the test. Khoddam et al. 5 utilised a proposed kinematic solution 22 in an energy conservation framework and developed a closed-form solution for friction factor during the test. They found that their identified friction factor is valid before the onset of foldover.
Friction and deformation both promote the onset of foldover. 23 Friction between the specimen and platens restricts the expansion of the contact area, causes the free surfaces to come convex and results in barrelling. If the reduction in height of the sample reaches a certain magnitude, the convex free surfaces fold over and come into contact with the platens. The friction factor can be identified with reasonable accuracy before foldover based on the barrelled profile 5 but it changes during the deformation and foldover which adds to the problem’s complexity.
The current work aims to propose and explore different methods to detect the onset of the foldover and its quantification during the test. It proposes three methods considering (1) direct measurement using tracing points, (2) energy-based and (3) geometry-based indirect measurements to detect the onset of foldover and to quantify the event in an average sense.
Methodology
Virtual experimental setups for BCT
Further to the analytical limitations of the foldover models, the commercially available compression test machines collect very limited types of data which are inadequate to study foldover. For example, the instantaneous changes of the sample’s free surface, the barrelled profile, are not recorded by commonly available test machines. To avoid the outlined analytical and experimental limitations, a virtual reality experiment is utilised in this work. It includes a finite element (FE) model of the test and some in-house post-processing computer codes. The FE model was developed, solved and post-processed using Deform™ 3D software by Scientific Forming Technologies Corporation (SFTC). Details of the model will be presented later in section “FE simulation strategy” of this article. Also, in-house post-processing computer codes were developed to read the output of the FE solutions and to utilise them to detect and measure the foldover. Contrary to the available oversimplified closed-form solutions of the test, the employed FE model provides details on the instantaneous profile of the sample during the test. The virtual setup enables the acquisition of the pseudo data including the sample’s discretised geometry (mesh), key nodal computations at the nodes and key elemental computations at each element centroid. Also, the heterogeneous distribution of effective strain, strain rate and stress within the sample, computed by the numerical solution, is used as the input for the methods which are proposed in this work to calculate foldover.
Alternatively, in a real experimental setup, one has to measure the sample’s deforming profile using a high precision visual data acquisition and processing system and measure the sample geometry instantaneously to build an accurate FE model. The measured and calculated data should then be augmented in a real-time fashion. The augmented reality setup enables indirect measurement of friction (see Khoddam et al. 5 for details).
Indirect measurement of foldover based on data from the virtual setup is presented in this work.
An experimentally verified virtual setup
The FE solution, employed in the virtual setup, is typically considered a reference solution in many complex problems including friction during compression tests and foldover in the current study. However, it is essential to experimentally verify ‘the finite element-based setup’ or ‘the virtual setup’ outlined in section “Virtual experimental setup for BCT” to minimise the risk of employing a numerical solution that does not fully represent the experimental conditions.
We will be utilising the BCT’s experimental data in a special way here. While the typically available experimental load-displacement data are not adequate for foldover and barrelling studies, the data can be used to verify a detailed virtual FE model which can eliminate the limitations of the available test solutions. The verification also confirms that the FE model is constructed correctly and therefore fulfils a prerequisite to having a valid and representative solution. Before describing the experiments and verifying the virtual setup, which will be presented in section “Results”, let’s introduce some new terms for a better understanding of our methodology.
Foldover terminology
It is critical to note the resemblance of necking and foldover during the tensile and compression tests and that both events do not start immediately with deformation. Foldover occurs after increasing the sample profile’s barrelling when the sample’s fillet radius at the edge of its free and friction surfaces increases to a certain limit. One has to distinguish between the fillet radius and the overall profile (free surface) of the sample which might be represented with a much larger radius. Tracing points and the profile are introduced here to help with the above understandings. Foldover has to be understood qualitatively and quantitatively before it can be employed to model the material’s flow around a tight corner, flash forming, or similar highly localised deformations. The test chosen in this work helps us to better understand the complex phenomenon and its findings are transferable to several forming scenarios in open and closed die forging
Tracing points and the profile
In the current literature, a BCT sample is machined with tiny groves at its top plane to allow an experimental tracing of its surface points and migration of the free surface points to the contact zone. In this work, we utilise a similar concept, called tracing points, for a numerical study of foldover. A tracing point is defined as a virtual material point that represents the location and motion of the material point; it is traced sequentially as the sample deforms.
Figure 1(a) to (c) illustrate a deformation scenario in which the foldover occurs (with foldover); three tracing points (

Three tracing points
The sample’s profile or simply profile is defined here as the loci of the tracing points which define the sample’s free surface. Points
Figure 1(a) to (c) show the onset, an intermediate development and completion of foldover, respectively. Deformation parameters associated with the onset are shown with subscript

The key inputs to finding the onset are
The foldover is a boundary condition change that has to be properly considered in a solution to the problem. This challenging task can be performed only once the onset has been detected. Before presenting the methods to detect and quantify the onset of foldover, the virtual setup, including its FE model, is briefly summarised next.
Experimental verification
To verify the proposed numerical virtual test setup, the compression tests were performed using a Servotest™ Thermo-Mechanical Treatment Simulator (TMTS) machine. An AISI 304 austenitic stainless-steel plate was hot rolled and its thickness was reduced to approximately 12 mm before machining the test samples. The chemical composition of the test sample was Fe–0.02C–1.6Mn–18.5Cr–8.4Ni–0.3Cu–0.4Si–0.1Mo (wt.%). Samples with nominal diameter and height of
Hot compression test samples, deformed at
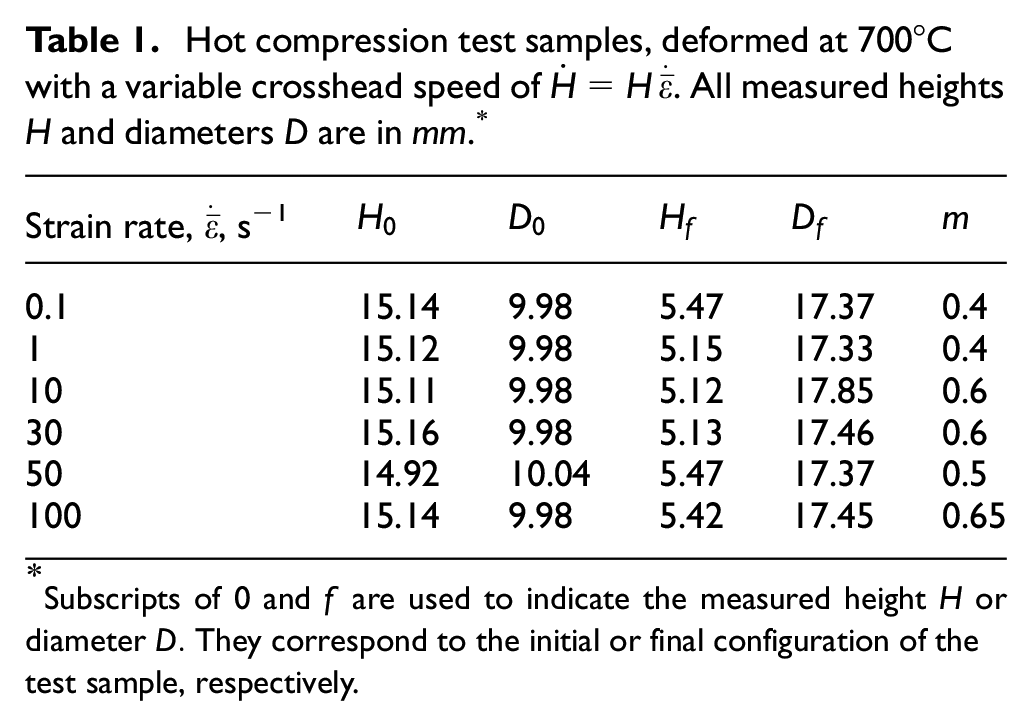
Subscripts of
FE simulation strategy
As explained in section “FE simulation strategy”, the software and its FE model of BCT serve as a virtual lab to produce pseudo data. To correlate friction and geometrical parameters of the deformed sample, FE models of BCT for a series of BCT case studies were constructed and solved using SFTC-DEFORM Premier software. While the software has been optimised for plasticity problems in metal forming (e.g. forging and upsetting), it also allows some adjustment in terms of mesh size, mesh updating. The mesh updating was employed in the virtual setup very carefully as it complicates the tracing of the tracing points explained in section “Tracing points and the profile”. Interested reader can find more details on the models (e.g. the time integration scheme and element formulation) elsewhere.3,5 A test scenario was considered with the initial sample diameter and height of
Axisymmetric iso-parametric quadrilateral elements with four nodes per element were utilised in the FE model with 384 nodes and 343 elements to discretise a quarter of the test sample as shown in Figure 1. For each simulation, a constant value of the friction factor (
In the second method of estimating the foldover, we monitor changes in the deformation energy before and after the folding to spot the foldover’s onset.
Method 1: Using tracing points to measure
This method relies on a FE solution of the problem and visual inspection of the tracing points migrating from the free surface to the platen-sample interface. The procedure employs the graphic post-processor of the FE solver. Further to the tracing points (shown as hollow dots in Figure 1), other graphical output can be used to detect the onset such as the velocity field at each node. Comparing the tracing points chosen on the sample’s upper and mid-planes in Figure 1, one can imagine that the velocity components in the mid-plane are less sensitive to the coordinates of the points than those at the top plane. A complex velocity field pattern is needed in the upper plane to represent the mixed boundary condition and the migration of the tracing points in the vicinity of a foldover zone.
Method 2: Deformation and traction power estimated by FE analysis
Indirect detection and measurement of foldover, presented in this method rely on the FE’s step solutions. To correlate the results, here we utilise three power terms used in the FE stiffness equations namely input power, deformation power and traction power. It is found that as the deformation and input powers grow with deformation, the onset of foldover can be detected by spotting the first abrupt slope change in the ‘deformation (and or input) power-stroke’ curve. These power terms, and their recovery based on the FE results, are outlined in some detail next.
A deforming BCT sample may be considered a non-conservative system within its two boundaries namely the tool-sample interface and the free surface of the sample. The energy change in the system is path-dependent due to the non-conservative nature of the process. The conservation of energy for the BCT system is mathematically stated as
The total energy transmitted to the sample by the variable and non-conservative load,

We note that both

where

where the first integral is the power consumed (changed) in the system due to the plastic deformation,
Elemental deformation power for the FE solutions
The total sample deformation power
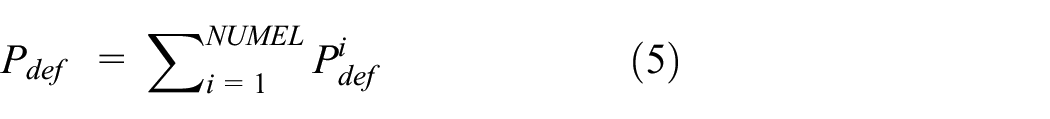
where

where the element’s volume is
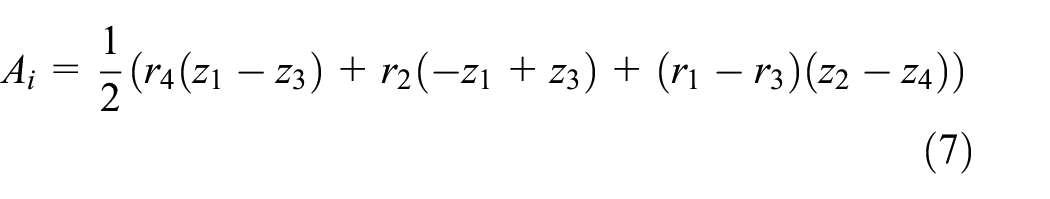

The node numbers (indices) in equations (7) and (8) are based on the ith quadrilateral element’s local coordinate system. One needs the element connectivity matrix of the solution to correlate these indices to the global coordinate nodal numbers. This is essential to post-process an FE solution and to reproduce any calculations similar to those presented by equations (7) and (8). The FE solutions are typically reported based on the global node numbers rather than the local node numbers (1, 2, 3 and 4 for a quadrilateral element). The results have to be translated to the local coordinate before post-processing can be performed. The total deformation power,
Calculation of friction traction
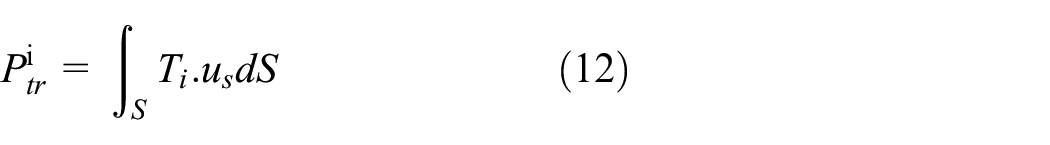
The total sample traction power

Assuming a von Mises yield behaviour for the sample, the traction power loss,

where

Changing the variable,
Simpson’s 3 points numerical integration was used to calculate the elemental traction power. A plot of the deformation and traction powers against
Method 3: Quadratic profile
This method is based on the comparison between the sample’s profile identified by the FE solution (virtually measured) and a reference quadratic profile. This imaginary quadratic profile was first suggested by Schey et al.
27
to simplify the foldover and later reinvented by Khoddam et al.
5
to model the barrelling. The third method suggests that foldover does not start automatically. It starts and grows only when the fillet radius at the top edge of the sample’s free surface blunts to a certain limit. This is when the identified sample profile (from FE analysis or experimentally measured) deviates locally from the imaginary quadratic profile most significantly at its top edge. The technique is illustrated in Figure 2 where the FE profile is shown using a solid black line and the quadratic profile with a dashed red line. Based on observations from many numerical solutions of the BCT, it was found that at the onset of the foldover, a small fillet is formed at the ‘top edge nodes’ which are shared by the free and interface surfaces. A sample top edge node is shown as

Profile tracing points,
Based on numerical studies of the results for the second method, a criterion has been developed to detect the onset which can be stated as:
The onset occurs when the error between the real profile and its quadratic representative in the vicinity of the sample’s upper edge (vicinity of the shared node
Virtual quadratic profile
The virtual quadratic profile, shown using a dashed red line in Figure 2, is a second-order curve that represents the variation of the sample’s radius as a function of

Incompressibility principle between the sample’s initial and current geometry can be used to correlate the barrelled sample’s mid-plane diameter

where
Quadratic profile error
Given the cylindrical coordinate shown in Figure 1, each point on the sample profile can be located based on its radius and height which are presented by

and

where
Results
We verify the FE models next by comparing the load-stroke results generated by the FE models with the experimental measurements described earlier in this work.
The results relevant to the proposed methods 1, 2 and 3 are presented in the upcoming sections. Also, to verify the numerically calculated foldover, the predicted foldover value by the second method is compared in this section with that measured experimentally by Ettouney and Stelson 8 and Tan. 9
Based on the virtual experimental setup explained earlier, most notably the FE models and the dedicated computer codes, and based on the three methods which were discussed and developed in this work, test scenarios were performed and their data was processed. The results on the virtual detection of foldover onset are obtained and presented here. These are based on the described computational conditions and the developed theories presented earlier in this article.
Verification of the FE models
The TMTS experimental setup, shown in Figure 3, was used in this work to obtain the load-stroke data,
28
similar to all commercially available compression machines known to the authors, is incapable of measuring barrelling data during the test. Therefore the estimated friction coefficients

The Servotest TMTS experimental setup. 28
Figure 4 compares the experimental and numerical load stroke data as explained in section “Virtual experimental setups for BCT”. Contrary to the flow stress data, the comparison of different load stroke data is not straightforward as they depend on the sample geometry. Since the sample geometries are slightly different, as can be seen from Table 1, the plots in Figure 4 are presented separately; not overlaid.

Comparison of experimental (solid lines) and virtual (dotted lines) load stroke data. (a) to (f) correspond to the data sets with an average effective strain rate of
Nevertheless, as will be shown in Figure 6, the deformation power is not greatly influenced by friction. Therefore, while the coefficient factor plays a significant role in data reduction, it has a minor role in the load stroke curve.
The compared sets are shown in Figure 4(a) to (f) with six average effective strains of
The difference between the virtual load-stroke (FE based) and the experimental load-stroke set in each case pools from several different sources. These include the oversimplified post-processing of the compression test data based on the existing methods which were extensively discussed in the ‘Introduction’. One notes that the flow data library in all commercially available finite element programs relies on the simplistic solutions of the test. 4 Given the limitations in the available data post-processing/reduction techniques, the sets comply reasonably well in all cases which justifies the use of the virtual setup as the best available method to benchmark the data conversion techniques.
Method 1; Tracing points and physical appearance
Figure 5(a) and its zoom view (shown as Figure 5(d)) show the BCT sample at its initial undeformed mesh (

Use of nine tracing points to identify the onset and progression of foldover with deformation (step numbers: 10 – undeformed, 2550 – intermediate and 3200 – final deformation step): the position of (a) tracking points on the initial undeformed mesh, (b) the tracking points on the fully deformed mesh, (c) the tracking points on an intermediate deformation step. (d) and (e) are the insets of (a) and (b), respectively.
Close observation of the FE model and measurement of
The onset of foldover,

The visually identified
Method 2: Monitoring deformation energy and load changes
The FE model described earlier, was solved for the chosen computational conditions. Also, in house computer codes were developed and utilised in this work to read the FE solutions and calculate the total power input
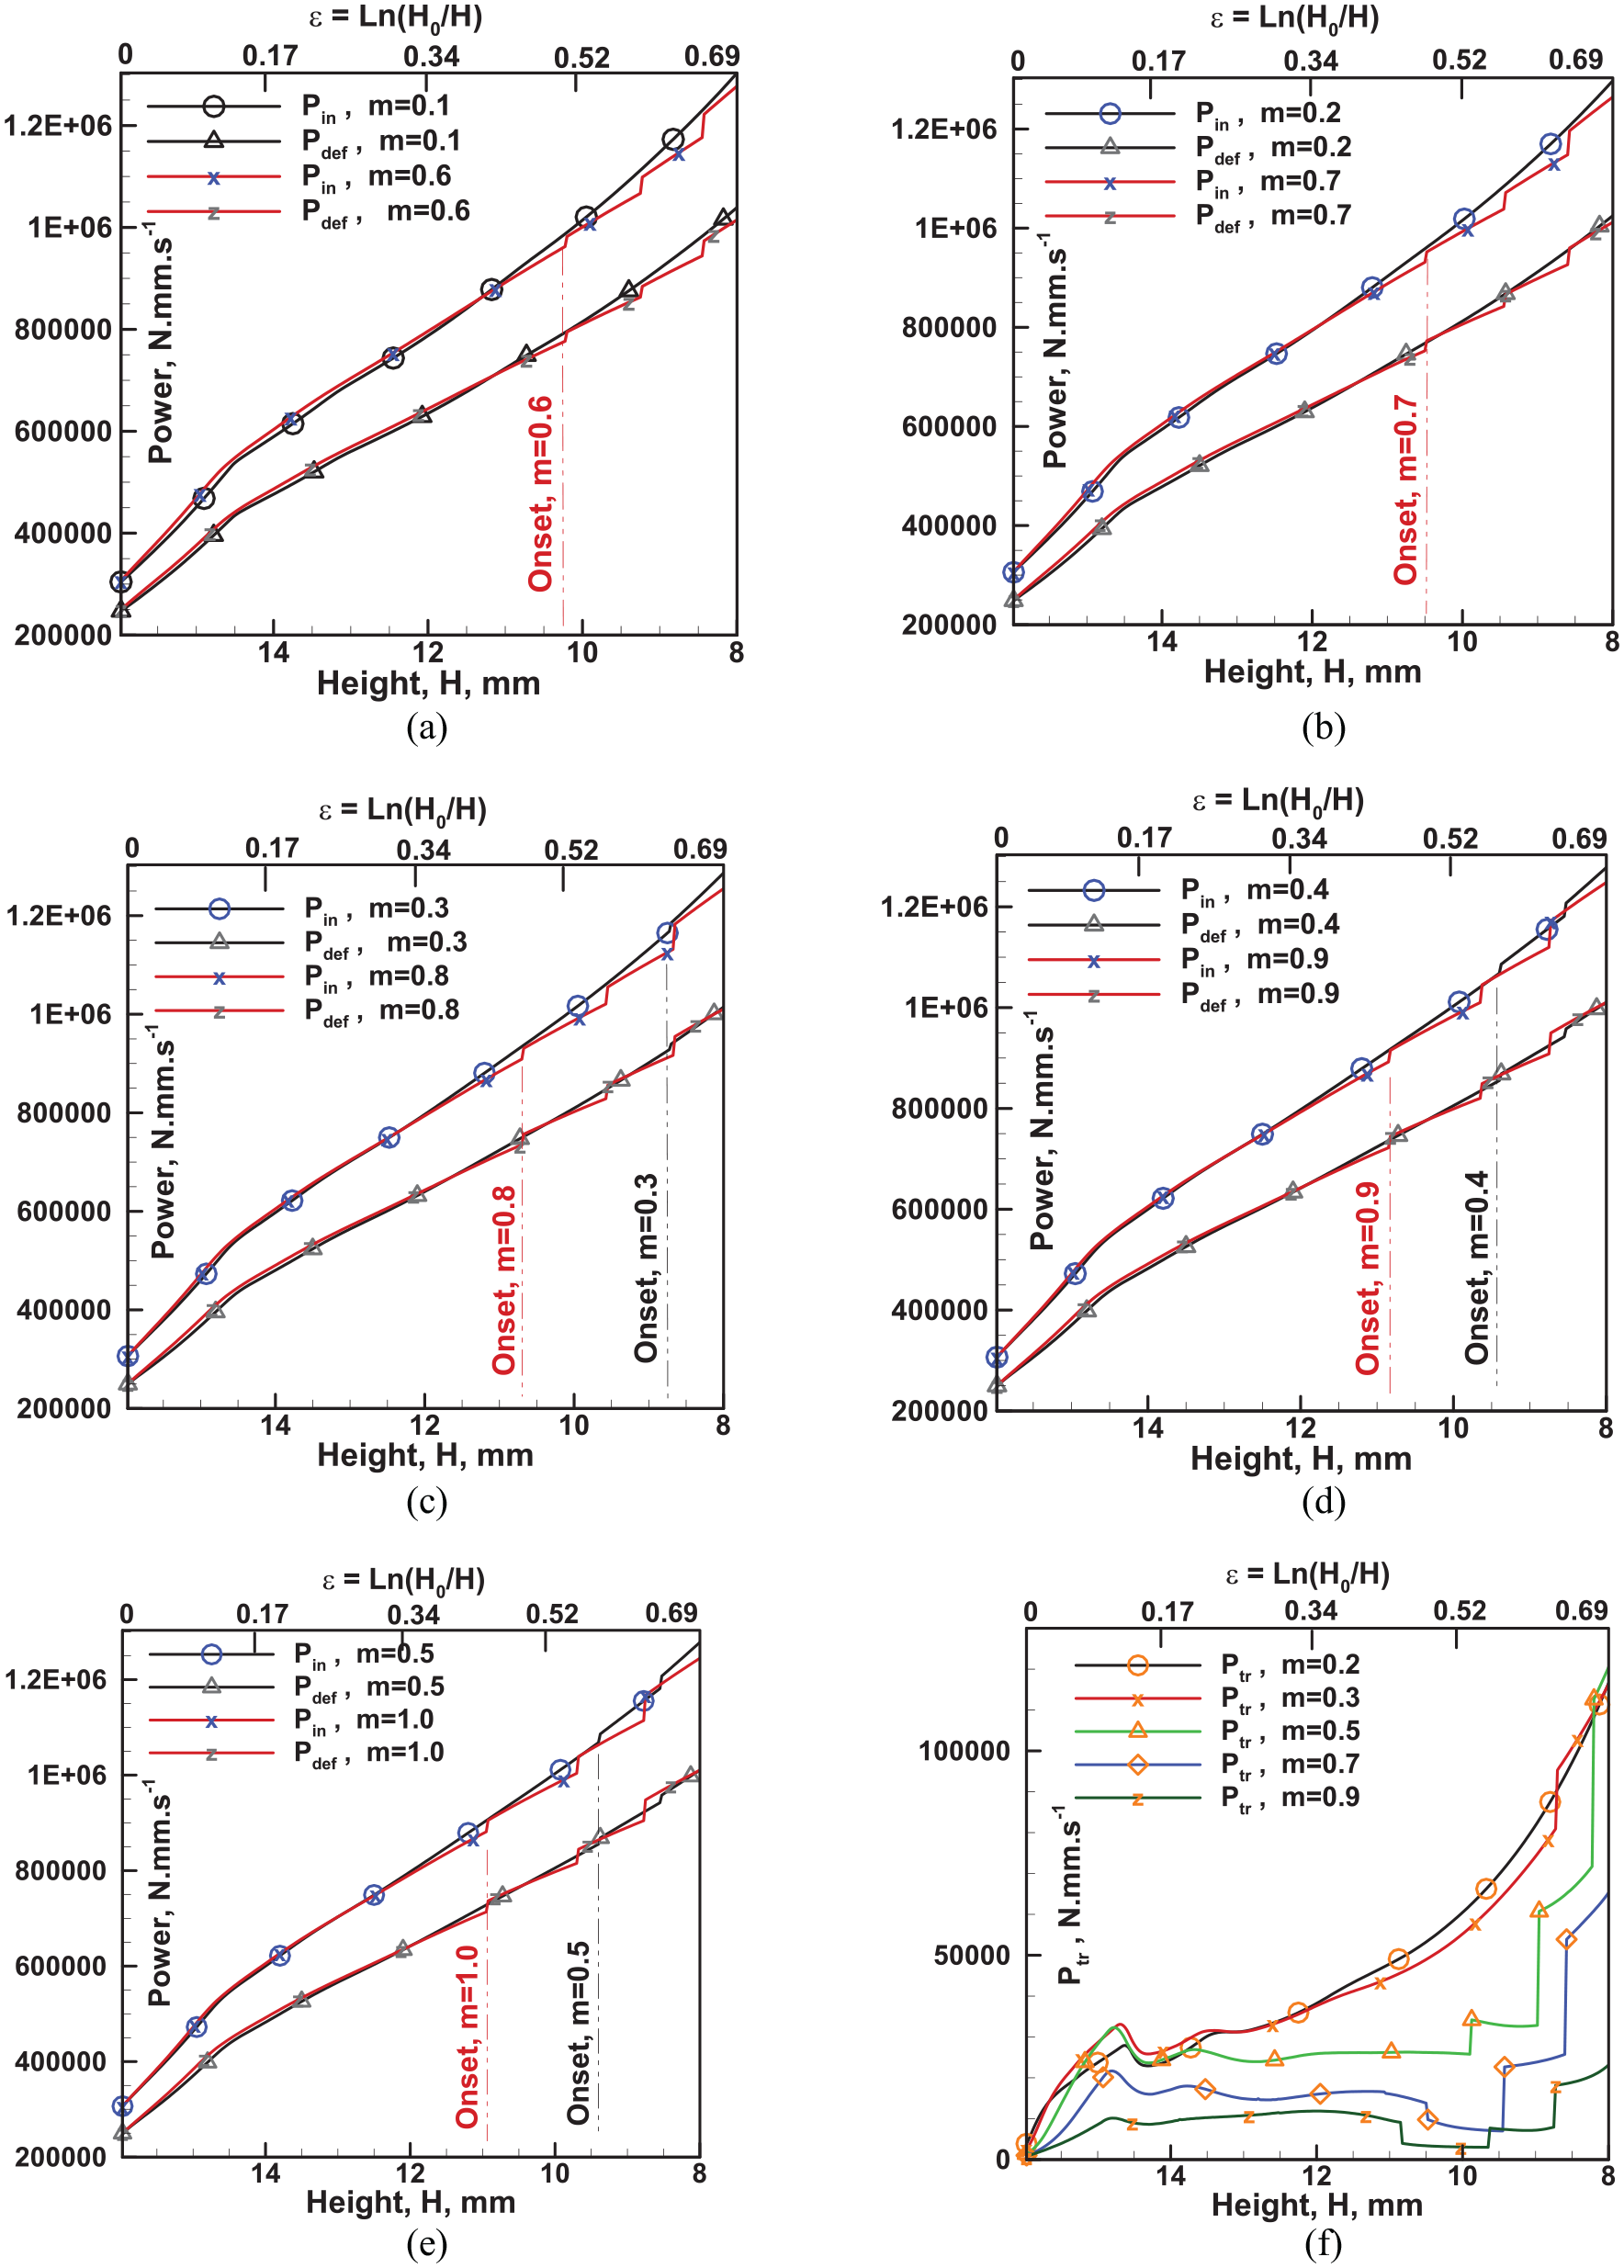
Variation of input power,
The first abrupt slope change of the calculated power with deformation is used in this method as the criterion to detect the onset. The change for each
To correlate the foldover and sample height, we note that


The top horizontal axis in Figure 6 is an average uniaxial strain
Figure 6(f) shows the traction power
Method 3: Deviation of the quadratic and actual profiles at the edge
The results obtained by the FE step solutions explained in section “FE simulation strategy” are used as the inputs for a dedicated computer code which was prepared in this work to implement the third method. The code generates the radial position of the tracing points on the FE profile and the quadratic profile and stores them in two separate arrays, respectively. The latter is generated using equations (13) and (14). Quadratic error
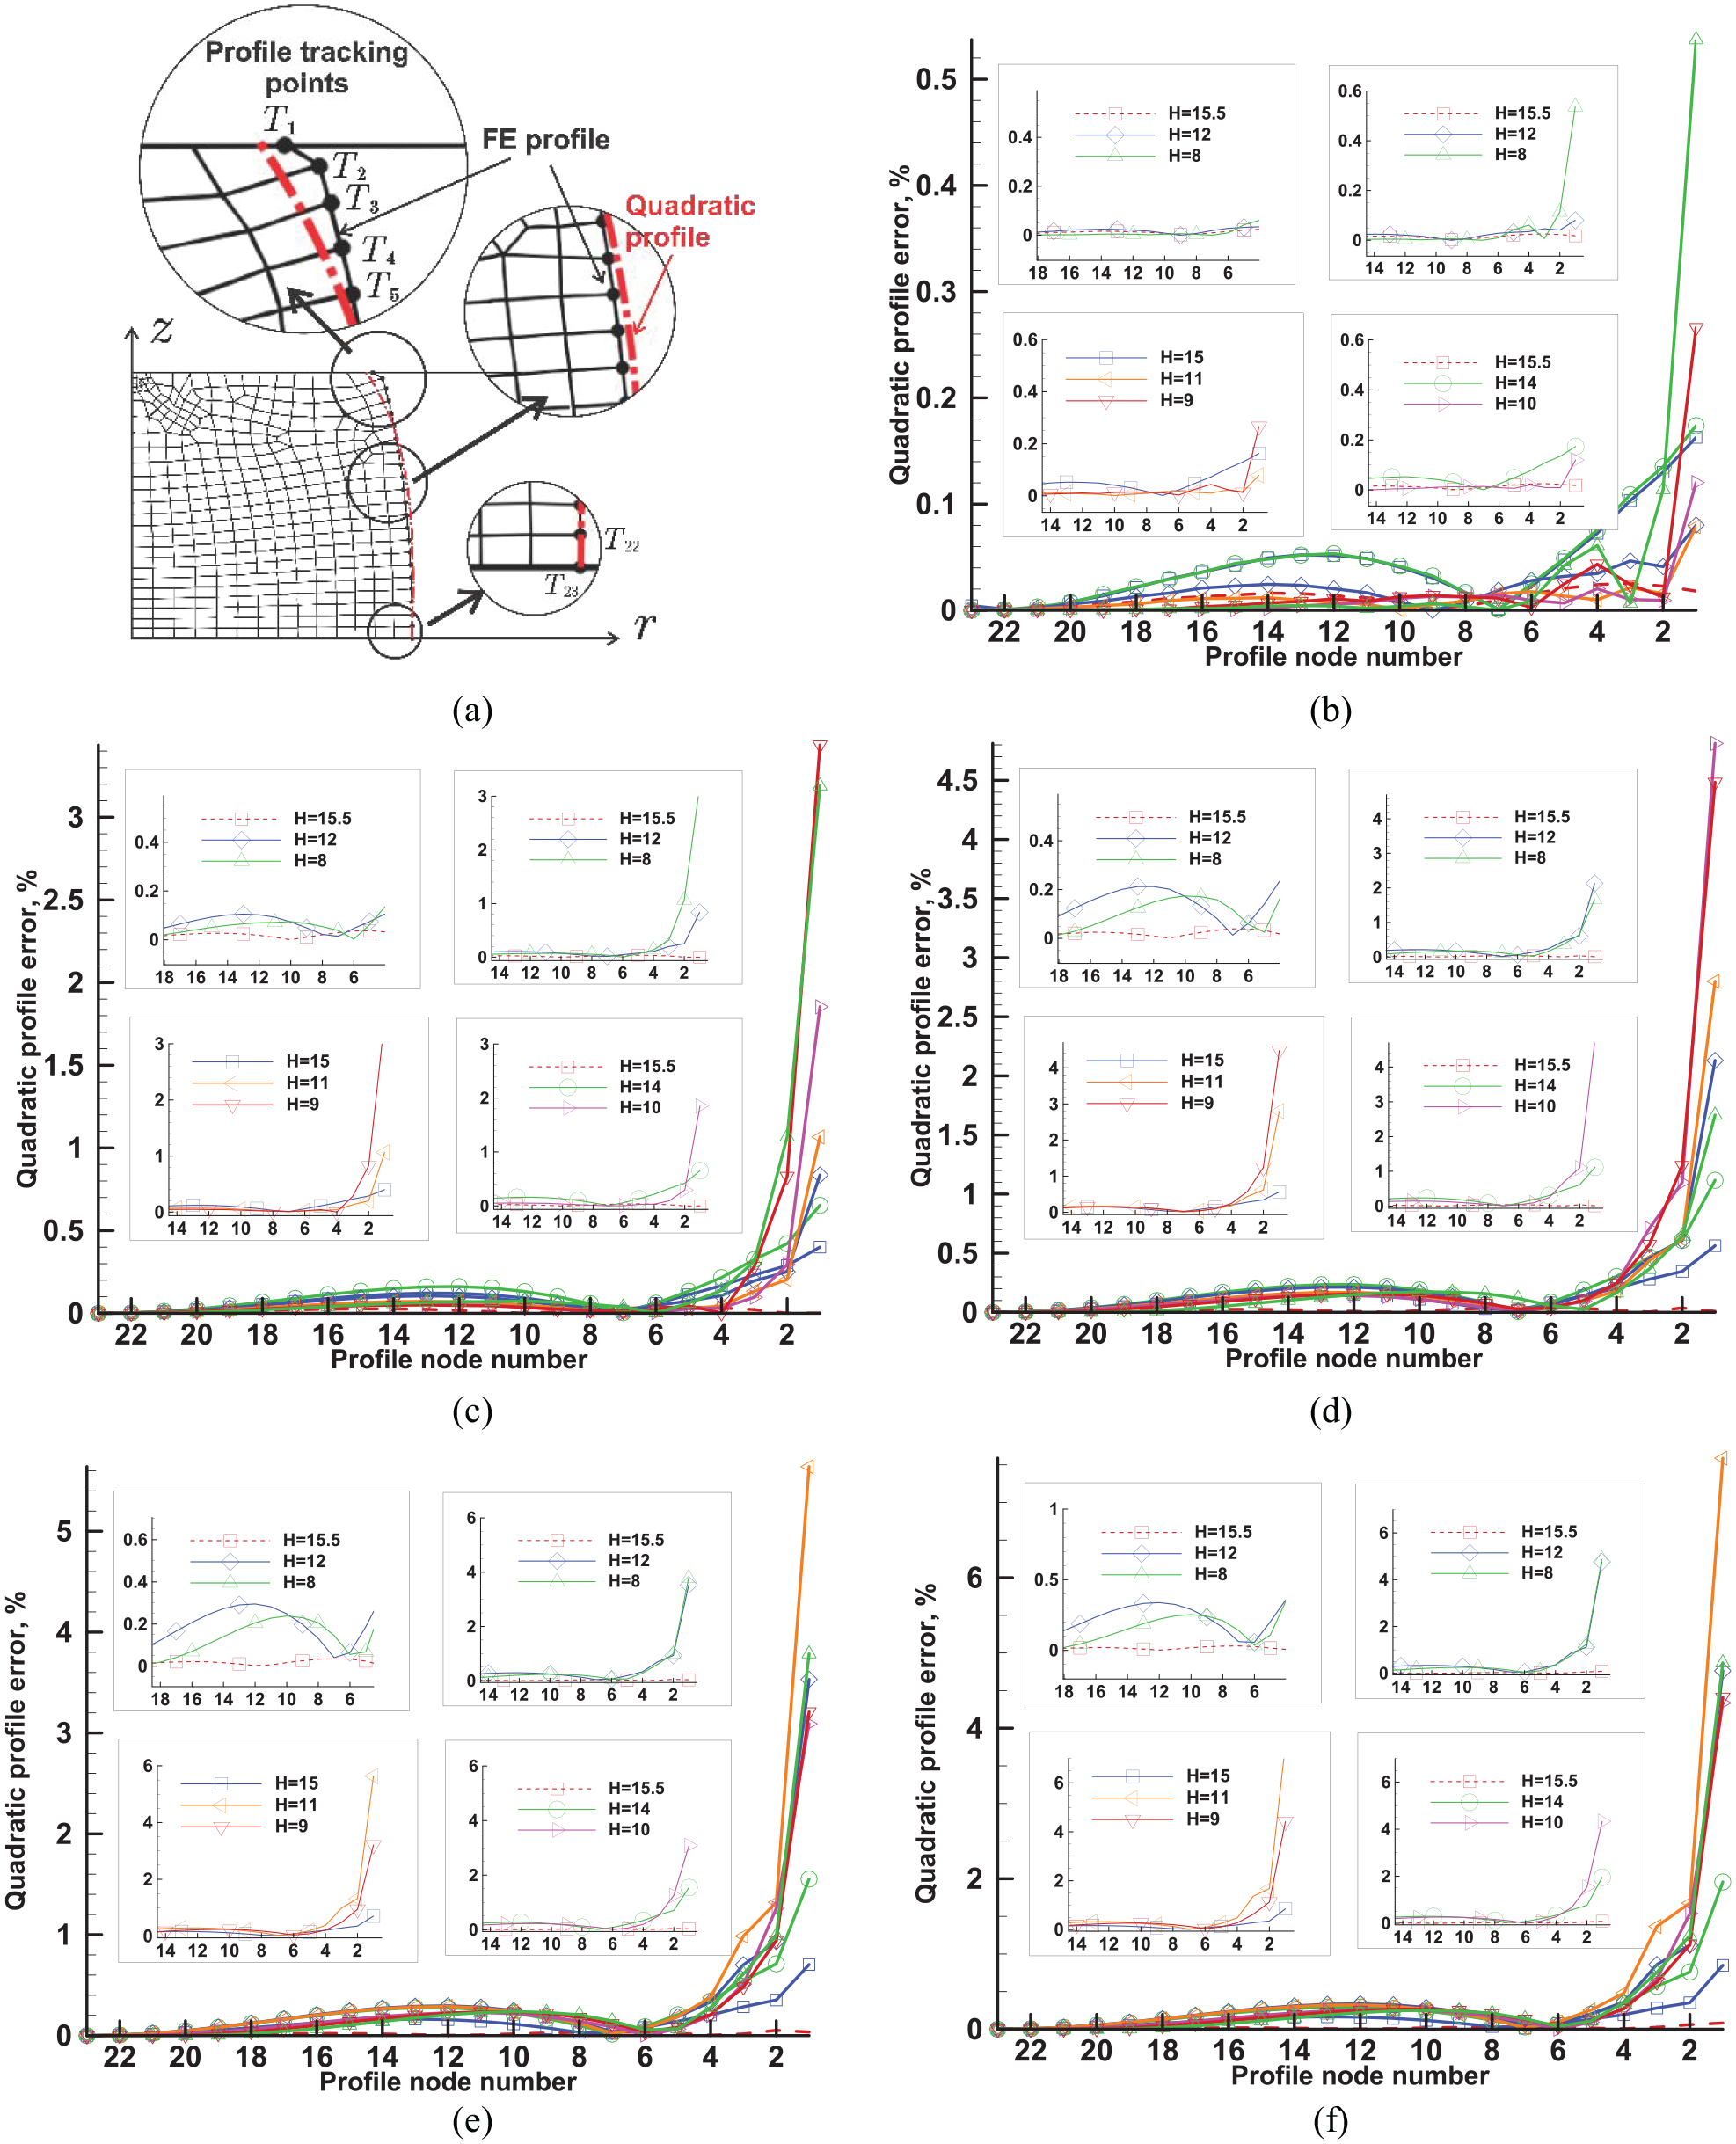
Quadratic profile error
An important conclusion from the presented analyses and results in this work is that the flow curve identified based on the current scenarios is only reliable for effective strains smaller than
The onset of foldover,

Comparing experimental and numerical foldover
Experimental measurement of foldover
Existing analytical and experimental studies of foldover rely on two simplifying assumptions:
The barrelled profile is homogenous; it can be represented fully with a circular profile.
The foldover starts immediately with deformation; even all available numerical simulations only consider the final foldover and assume that it starts from the beginning of deformation (see e.g. Ettouney and Stelson 8 )
Some of these studies exclude the friction coefficient specifically as a parameter in their models. However, depending on the forming parameters, including the friction coefficient, a deformation scenario may complete with zero foldover; for example, Figure 1(d) to (f), or the foldover may be postponed and only starts at a certain level of deformation (Figure 1(b)). Therefore, an inclusive/comprehensive model of foldover should accommodate all possibilities. A mathematical expression of foldover,
Our mathematical model, presented as the second method, is compared with the published experimental data available on foldover in Ettouney and Stelson
8
and Tan,
9
where the experimental data only provide
FE simulation of the experimental results
A dedicated numeric model corresponding to the experiment was constructed in this work to verify the validity of our numerical FE simulations and their predicted final foldover. The sample made of Al6061-T6 was deformed at 40

Equivalent to a friction coefficient of
Upon availability of a dedicated experimental setup in future works, more representative experimental data may be collected and compared with our proposed model. Therefore, in the current experimental verification, shown in Figure 8, only the measured

Comparison of experimental results from Ettouney and Stelson 8 and Tan 9 with FE simulations presented in Table 3 and that represented by equation (17).
Discussions and conclusions
The discrepancy between the verification data can be explained by noting that the flow curve employed in the FE model was included in the software library. However, the flow curves available in such libraries are typically constructed using the common flow curve identification methods which are very primitive at this stage; this is one of the key arguments in the current work. Having said that, the comparison is close enough for the verification purpose and indicates that the FE model is representative enough for benchmarking purposes and to generate the reference data to be used in the virtual setup.
While the first method is a convenient way to detect the onset and the growth of foldover, it is mainly a useful yet simple tool for visual inspection and verification for foldover studies. This method, however, depends on the mesh size. Refining the mesh enough, the detected onset,
The FE model developed in this study employs an adoptive meshing to ensure the convergence of its solution. As a result, the mesh is updated when needed; and at the larger deformation steps, some tracing points may not remain a ‘FE node’ while they still belong to the profile. An example of this is shown in Figure 5(c) in which, as a result of mesh updating, the tracing points
The second method relies on a detailed solution of the problem as its input to calculate the deformation power. However, as shown in Figure 6, both the deformation and input powers predict the same onset. Therefore, the calculated load-deformation can be considered a more convenient criterion to construct the detection curve and eventually the onset. One might correctly argue that by refining the mesh size, the abrupt slope change in
The proposed second technique requires some significant numerical calculations which are only achievable after running a numerical simulation of the test. One notes that the input power is proportional to the load. Therefore, the numerical results are also representative of the measured load. Based on the results shown in Figure 6, the difference between the measured load-stroke with and without foldover, demonstrated by a jump in each curve, is comparable to the load measuring errors (2%–7%). These make the second method, the least usable method among the proposed three methods here. The first two methods provide an identical set of predictions for the onset (see Table 1).
Provided the availability of the measured
A comparison of the predicted onset by the two first methods (Table 1) and that made by the third method (summarised in Table 2) shows a reasonably good agreement. However, the choice of the best method to detect the onset and implement it in the ‘test rigs of the future’ is also a matter of technology availability and how the sample’s profile changes can be measured during the test.
The experimental validation of the predicted foldover, presented in the results section, showed a very close agreement on the predicted and measured final foldover. 8 The measured foldovers before the onset, 8 are not comparable with the predictions in this work due to the poor assumptions in the experimental work explained earlier.
The following conclusions can be made from this work:
Contrary to the experimental and numerical observations, previous studies on foldover assume a homogeneous development of foldover throughout the test which does not recognise a foldover free stage during low friction/deformation tests; the studies correlated foldover to the barrelled profile radius and therefore predict an immediate onset of foldover with deformation. It was emphasised a need to develop methods to directly or indirectly detect foldover onset during the test and to measure its growth.
Three methods were introduced in this work to identify the foldover onset and to measure the phenomenon during the test. They demonstrate a critical need in the measurement of the sample’s profile, particularly at the top edge of the sample, to overcome the limitations of the existing compression test rigs.
It was shown that foldover can start even with a friction factor of
Experimental data on foldover were employed and compared with their corresponding numerical predictions based on the virtual setup proposed in this work.
To make a reliable interpretation of the compression test, it is essential to partition the test data into pre- and post-triaxiality sections. The usable data, before instability, can only be defined by employing the proposed methods or developing similar methods to monitor the formation of foldover. This involves more development on both experimental and theoretical fronts to make the profile data measurement possible and usable during the compression test.
Footnotes
Acknowledgements
The authors wish to thank Dr. Thaneshan Sapanathan for his useful comments on the final versions of this work.
Handling Editor: Chenhui Liang
Author contributions
Individual contributions to the paper using the relevant CRediT roles: conceptualisation: SK, MM, BM; data curation: SK, MM; formal analysis: SK, MM; funding acquisition: PH and SK; investigation: SK, BM, MM; methodology: SK, BM, MM; project administration: SK; resources, software: PH and SK; supervision: SK; validation: SK; visualisation: SK; sample preparation and performing compression test experiments and collecting raw data: AT and SK; roles/writing – original draft: SK, BM, MM; writing – review & editing: SK, PH, BM, MM.
Declaration of conflicting interests
The author(s) declared no potential conflicts of interest with respect to the research, authorship, and/or publication of this article.
Funding
The author(s) received no financial support for the research, authorship, and/or publication of this article.
Data availability
The raw/processed data required to reproduce these findings cannot be shared at this time as the data also forms part of an ongoing study.