
Abstract
Nowadays, the importance of renewable energy is rapidly increasing. It is considered as an alternative clean source of energy due to environmental reasons. Therefore, this research presents a data analysis model to predict the generated electrical power based on wind energy and the long short-term memory (LSTM) model. The work focused on the Spring and Autumn seasons where wind speed has high variation and the data was collected every 15 min in a wide, open space area located in southeast Palestine. To investigate and validate the correctness and robustness of the work, three different scenarios were performed for each season to predict wind speed and direction, and mechanical power. Also, different performance metrics were applied. The results were very promising with an average error of less than 3% and an R-Squared value of 0.95. Since the price of electricity in Palestine is relatively high, the results showed also the possibility to generate electricity with lowered price of about 40% and a reasonable payback period of 11 years. The work confirms that wind energy is cost-effective and a good alternative to reducing global warming.
Introduction
Due to the rapidly increasing demand for electrical energy, people are migrating to use cheap and clean energy sources to minimize pollution and climate change. Sun, water, and wind are cheap, clean, and enduring sources for generating electrical energy. Moreover, renewable energy has a vital role in economic growth to handle this increasing demand for energy, as well as the shortage in energy sources. The wind is considered one of the most promising renewable energy sources because wind turbines are directly affected by the natural environment such as landform and wind conditions, unlike other energy sources like gas, steam, and hydraulic power. 1 Consequently, the wind turbine generator should be running in variable speed variable frequency mode to achieve optimum wind energy. Such that, maintaining the tip speed ratio to the value that maximizes aerodynamic efficiency, permits the variation in sympathy with wind speed. 2
Thereafter, modern technologies are currently used in wind energy, such as power electronics converters and control systems. This makes the simulation tools highly needed to evaluate the design performance of control systems.3,4 Wind turbine energy generation relies on the wind to keep it working. However, due to the variations in wind speed and direction, the amount of energy produced may vary from one moment to another. But in fact, it is expected to be delivered and consumed on a real-time basis. Therefore, analysis and prediction of generated energy have high importance to assist the management team who manages the wind forms to make correct decisions about the generated power, and its consumption, and prepare the storage capacity in smart grids. 5
Therefore, there was an increasing demand for developing artificial neural networks and machine learning-based approaches for wind speed prediction which in turn, through modeling, generates predictive models for wind energy and mechanical power. 6 Actually, the neural network LSTM is designed to solve the vanishing gradient problem that occurs when recurrent neural networks (RNN) learns sequences with long-term dependence. 7 And according to Gangwar et al., 8 LSTM has better and enhanced utilization for wind speed forecasting.
In this research, our aim is to perform prior data analysis for a better understanding of wind speed, direction, and mechanical power. The contribution of this work is to design and develop an efficient deep learning model for long short-term time-series prediction based on the wind data for 48 h. In addition, the work focuses on the Spring and Autumn seasons due to the wind speed variation during these two seasons, while other studies used LSTM to perform wind forecast for few hours only. 9
The other main goal of this research is to engage wind energy with the existing energy sources, especially in developing countries that have isolated urban locations due to geographical, economical, or political constraints, Palestine for instance. Note that, the annual average wind velocity at different places in Palestine is 3 m/s which makes the utilization of wind energy converters surely unfeasible in such places. In other places, it is up to 5.5 m/s (Al-Mazra’a AlSharqiyah/Ramallah is an example) while in the selected place for this research (Shaab al Butum/Hebron) it was about 6.94 m/s. Therefore, this value is more feasible to be used to operate a wind turbine in a cost-effective manner.
In section II we present a literature review, in section III we present the methodology, the system design is presented in section IV, in section V experiments and results are discussed and section VI contains the conclusion.
Literature review
In literature, renewable energy attracted many researchers. For instance, modeling and simulation of wind energy got special interest from researchers due to its importance and since it has many parameters to be optimized by research. Therefore, different simulation approaches have been followed, such that some researchers followed existing modeling and simulation approaches while others created new modeling and simulation tools.
According to Wu et al., 10 LSTM is more effective than the conventional RNN because it is able to learn the dependencies between the complex system of time series. In Iov et al., 3 a toolbox was developed for wind energy applications to simulate and optimize the design of wind-based generators. In Liang et al. 1 and Yuvaraja and Ramya, 11 the authors focused on the modeling and simulation of the generator. Such that, the authors presented a new method that combines the mechanical part and electrical parts to model the generator. In Tan and Islam, 2 a prototype version of the control strategy of a 20-kW permanent management synchronous generator (PMSG) was proposed for maximum power tracking. as well as the results produced by previous strategies were compared with the results obtained from this prototype.
In Singh et al., 12 the development of generator and gearbox models was presented. As well as coupling these models to different programs of the national renewable energy laboratory. In Tapia et al., 13 the results for the simulation of a grid-connected wind-driven doubly fed induction machine were presented with some real machine performance results. Such that, the operating conditions above and below the synchronous speed were considered.
In Gagnon et al., 4 the authors developed a model to simulate electrometric transient in power systems. And they presented the real-time simulation and modeling of a doubly-fed wind-driven induction generator in large power systems. In Prajapati et al., 14 a hybrid energy system was proposed which combines both wind-based generators and solar panels. Moreover, a control technique was proposed to track the operating point at which the PV system and the wind-based generators produce the maximum power.
In Fernández et al., 15 two equivalent models for wind farms with fixed speed were proposed through aggregating wind turbines into an equivalent wind turbine. One of the models was developed for aggregated wind turbines with similar winds, and the other was for aggregated wind turbines under any incoming wind. Manyonge et al. 16 attempted to address general objectives of wind turbine modeling through the examination of power coefficient parameters. In addition, Bianchi et al. 17 described in detail the control of variable speed wind turbines, both variable-pitch and fixed, using gain scheduling techniques. Sitharthan et al. 18 discussed some major possibilities in India for exploration of wind power employment in electricity generation. Zhou et al. 19 investigated the management of a merchant wind energy farm co-located with a grid-level storage facility and connected to a market through a transmission line. Tazay et al. 20 provided detailed design, control strategy, and performance evaluation of a grid-connected large-scale PV/wind hybrid power system in the Gabel El-Zeit region located along the coast of the Red Sea, Egypt.
Actually, due to the uncertainty of wind speed, the wind turbine output current is a major challenge for any prediction model. Based on that, many researchers have proposed models to predict the output current. Marugán et al. 21 presented a review of artificial neural networks used in wind energy systems, identifying the most employed methods for different applications. Maldonado-Correa et al. 22 presented a literature review on the predictive models of wind energy, focusing to create the baseline for the development of a short-term wind energy prediction model that employs artificial intelligence tools to be applied in the Villonaco Wind Power Plant. Jaseena and Kovoor 23 proposed wind speed forecasting framework that combines the features of various data decomposition techniques and Bidirectional Long Short-Term Memory (BiDLSTM) networks. Vaitheeswaran and Ventrapragada 24 used an LSTM neural network model to predict and validate wind power using time series measurements of online available wind power measurements. Zhou et al. 25 proposed a K-Means-long short-term memory (K-Means-LSTM) network model for wind power spot prediction, and a nonparametric kernel density estimation (KDE) model with bandwidth optimization for wind power probabilistic interval prediction.
Shahid et al. 26 proposed, a genetic long short-term memory (GLSTM) framework comprising long short-term memory and a genetic algorithm (GA) to predict short-term wind power. Adedeji et al. 27 investigated the effect of clustering algorithm on the performance of a standalone Adaptive neuro-fuzzy inference system (ANFIS) and ANFIS optimized with particle swarm optimization (PSO) technique using a manufactured wind turbine power output data of a potential site in the Eastern Cape, South Africa. Shamshirband et al. 28 evaluated the performance of different types of Deep Learning (DL) algorithms applied in the field of solar and wind energy resources. Vargas et al. 29 presented an overview of the analysis methodologies of wind speed/energy over 30 years for decision-making processes. Lipu et al. 30 presented the recent advance of AI-enabled hybrid propositions for wind power forecasting accelerating classification, strength, structure, weakness, and performance analysis. Al-Janabi et al. 31 presented a model for generating electrical energy from the wind called multi-objective renewable energy-generation (MORE-G), also developed another model as a multi-layer neural network based on the linear combination and multi-objective functions. Delgado and Fahim 5 discussed a data analysis framework to visualize the collected data from the SCADA system and recurrent neural network-based variant LSTM based prediction. Woo et al. 32 proposed a machine learning approach to predict wind turbine returns by using the wind flow data as a direct input. Precisely by using Multi-Tasks Convolutional LSTM Network to simultaneously predict the energy output and structural load from the target wind turbine while modeling the Spatio-temporal structure of the input wind flow.
Yu et al. 33 proposed an improved Long Short-Term Memory-enhanced forget-gate network model, abbreviated as LSTM-EFG, used to forecast wind power. López and Arboleya 34 proposed a developed approach with the application of linear regression models as the baseline, and RNN, LSTM network, and Dynamic Neural Networks (DNN), Nonlinear Autoregressive Exogenous (NARX) network to perform accurate wind speed forecasting in complex terrain in the Ecuadorian Andes to identify feasible places for wind energy applications. Srivastava and Tripathi 35 predicted the power generated from wind energy using wind velocity via wind turbine, using RNN, LSTM, and GBM, to find out which is the better one based on the performance parameters values.
In Malakouti et al. 36 to predict wind turbine power, they proposed algorithmic approaches utilizing machine learning techniques. The Applied algorithms include light gradient boosting machine, ensemble methods, extremely randomized trees, and the CNN-LSTM method. And in Zhang et al. 37 besides the utilization of LSTM model for deep learning to predict wind power generation, an Auto Encoder was employed to reduce the data dimension, shorten the training time, and improve the generalization ability of the model.
Methodology
In this section, the procedure used in this research will be discussed. According to Palestinian Meteorology and weather conditions, Spring and Autumn seasons normally have big variations in wind speed and direction. The selection of these two seasons only is because Summer and Winter seasons have no significant variability in wind speed and direction and thus they cannot be used to validate the proposed models.
The proposed model
The first step was to find a suitable study location which is a wide space with a feasible wind speed. The location was south-east of the west bank (Shaab al Butum/Hebron). The average wind velocity in this location is about 6.94 m/s. Hence, it is also is isolated urban location. Then to predict the wind energy and mechanical power, a step-by-step procedure is followed.
Figure 1 shows the flowchart of the procedure used in this research, described as follows:

Used procedure flowchart.
Data collection and preprocessing
Dataset collection
The used wind dataset was collected every 15 min time window from the location of this study during Spring and Autumn 2021 seasons. As aforementioned, the data were collected by and taken from the Palestinian Meteorology and weather conditions. Hence, the data were taken from their local server. Figure 2 and Figure 3 show the speed and direction samples for 1 week in Spring 2021 and for 1 week in Autumn 2021. Also, Figure 4 and Figure 5 show the average daily wind speed and direction for Spring and Autumn seasons.

Wind data values during 1 week of Spring 2021.
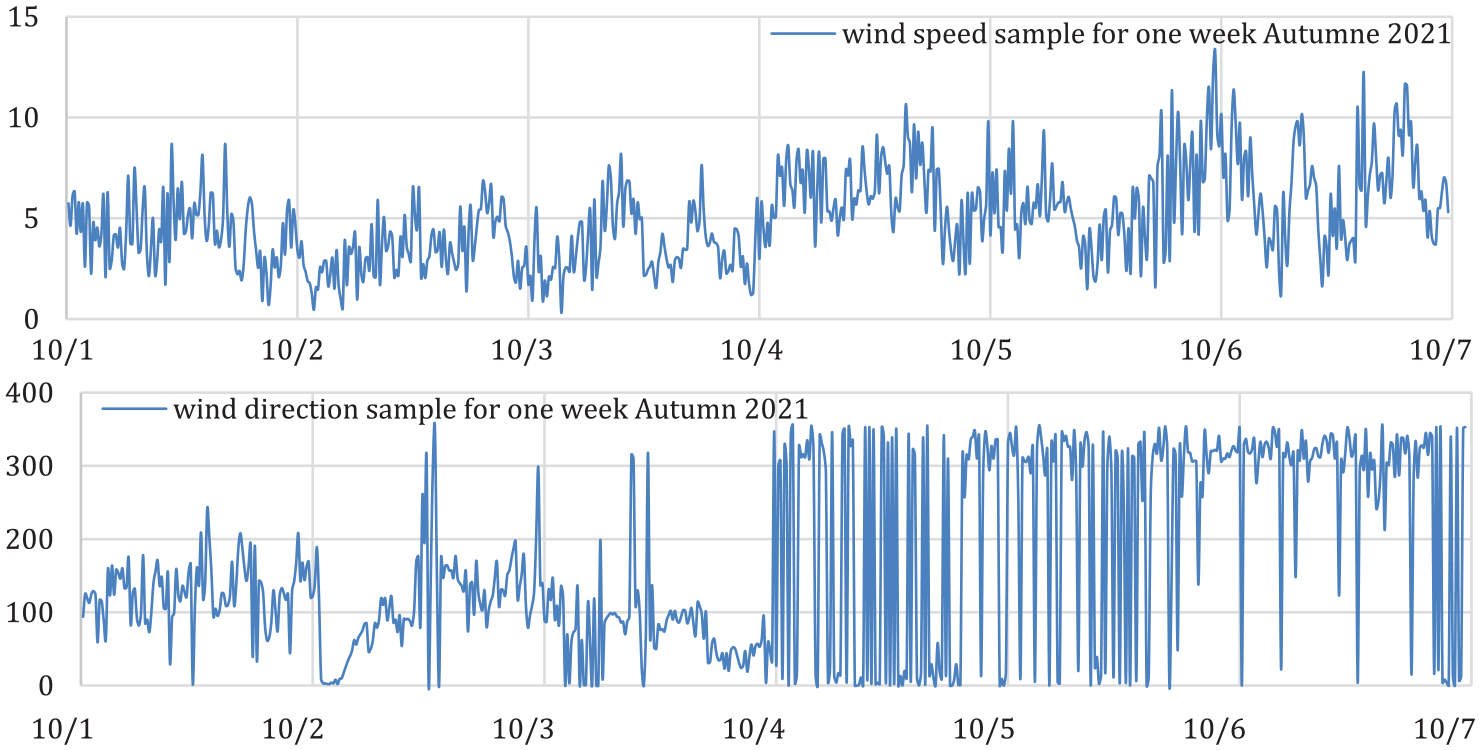
Wind data values during 1 week in Autumn 2021.

The average daily wind speed and direction during Spring 2021.
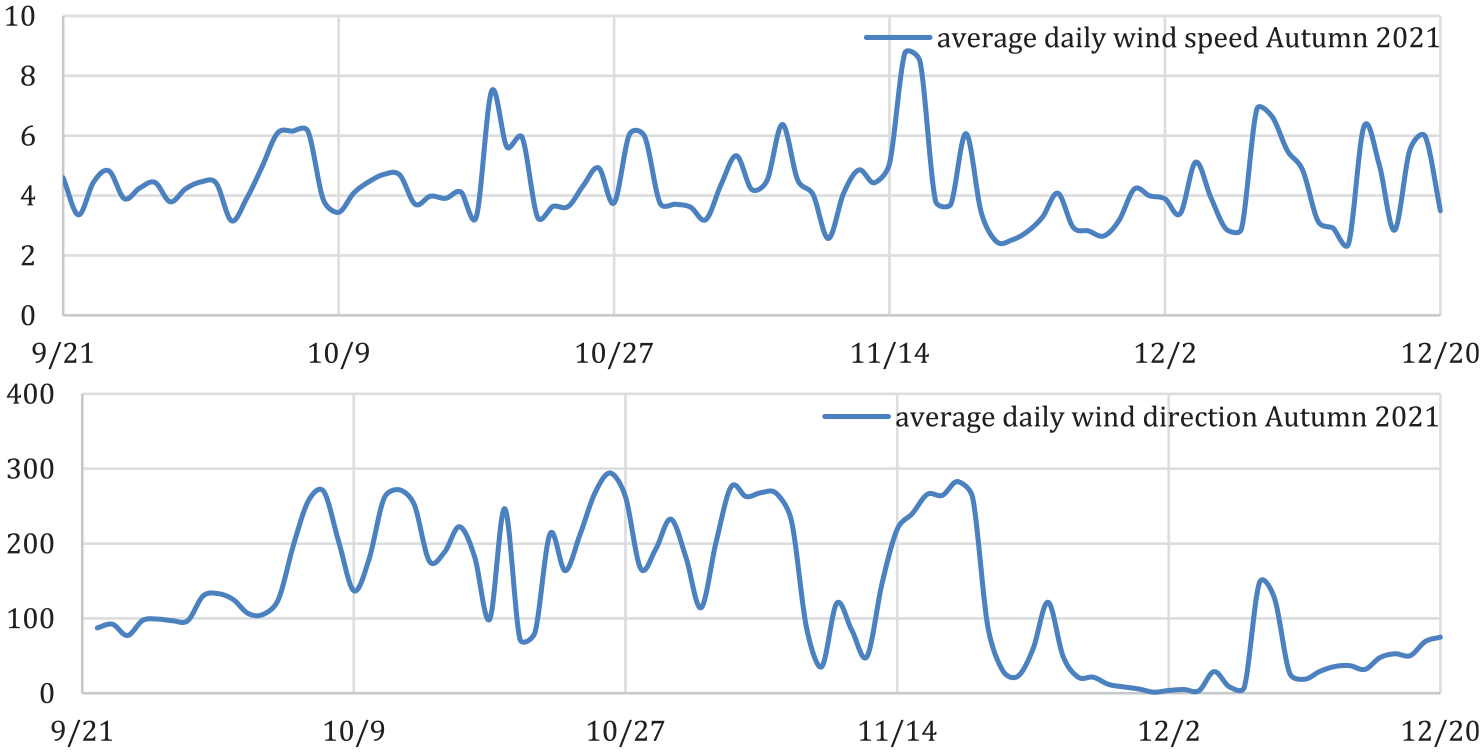
The average daily wind speed and direction during Autumn 2021.
Dataset analysis
The next step was to prepare datasets. The wind data values were analyzed and categorized, and the frequency for each category was determined. Figure 6 and Figure 7 show the frequency of each speed and direction category for both seasons. The collected data were using the Weibull model as shown in Figure 6 and Figure 7.

The frequency of each wind speed and direction category during Spring 2021.

The frequency of each wind speed and direction category during Autumn 2021.
Testing, validating, and train splitting
For each season, the data values were partitioned into training and testing and validation. Accordingly, three different scenarios were performed. The first two scenarios were used to train and test the proposed models. While scenario 3 is used to validate real-world use of the results.
1- In the first scenario, 67% of the values were used for training and the remaining 33% of the values were used for testing.
2- In the second scenario, all the readings of each season were used for training and 1 month’s readings were reused for testing. For the Spring season, April month readings were reused for testing, while for the Autumn season, October month readings were reused for testing.
3- In the third scenario, each season’s readings were used for training and other different month’s readings were used for testing. For the Spring season, May month was for testing, and for the Autumn season, November month was for testing.
LSTM-based neural network model
To predict the most suitable values of the proposed models’ parameters of the presented case study and data, the model was evaluated and examined many times for different values. As a result, the model consists of: an LSTM layer with 10 cells, followed by a Dropout layer with a dropout rate of 0.25, and finally a Dense layer with one cell and sigmoid activation function. Figure 8, represents the data by 15-min sample in the training and testing processes.
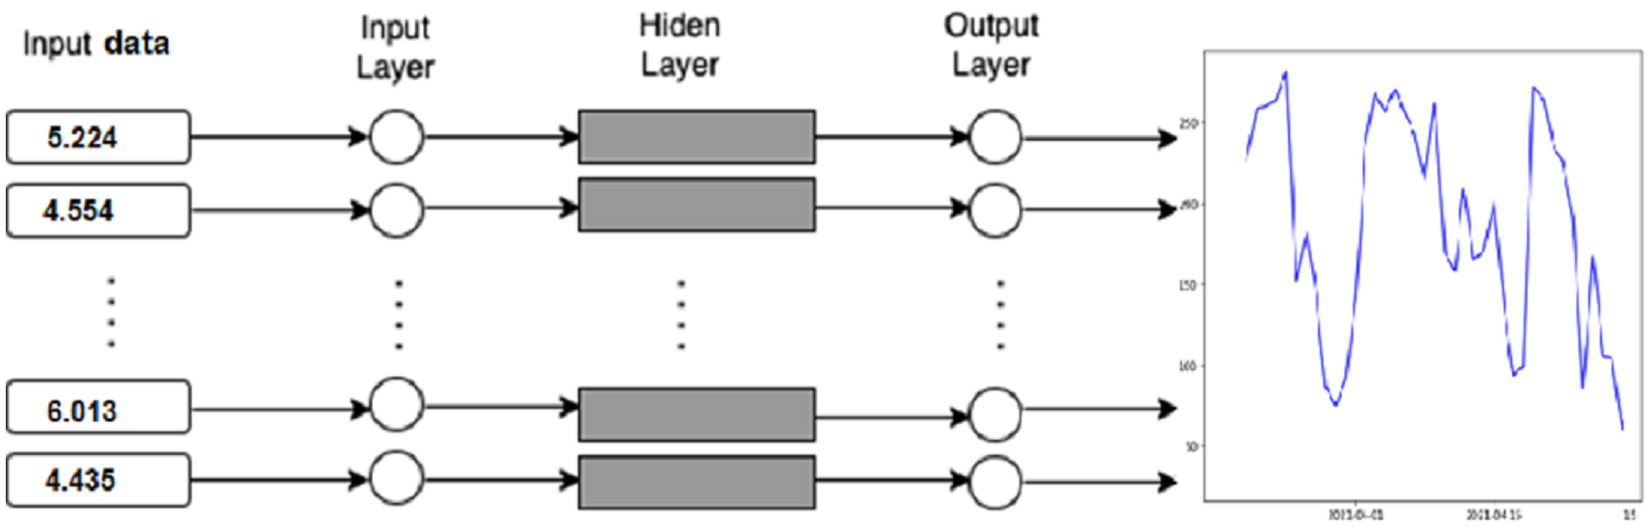
Illustrated structure of the proposed model.
Model training
The fitting of the model was examined through 20 epochs with validation split = 0.2 and batch size = 256.
Predictions
The used model was for short-term prediction. It was used to study and analyze the short-term behavior of the wind for 1 week. Therefore, the LSTM-based model is developed in a way to capture patterns of 15 min for 1 week each to predict wind behavior.
Performance metrics
To check the reliability and validity of the results, different metrics were used for both training and testing processes. Mean Absolute Error (MAE), Mean Squared Error (MSE), R-Squared, and Main Bias Error (MBE) were used.
Experiments and results
This section is divided into two subsections. The first subsection focuses on the Spring season’s wind speed, direction forecast, and the resulting mechanical power. While the second subsection focuses on the Autumn season’s wind speed, direction forecast, and the resulting mechanical power. Model’s training and testing were performed using a high-performance laptop, a DELL Inspiron 15 7000 Gaming Intel(R) Core(TM) i7–7700HQ CPU @ 2.80 GHz CPU with 16 GB RAM. The anaconda Jupyter Notebook platform was used, with Python 3.8 programing language.
Spring season scenarios and results
1- As aforementioned, the first scenario was done by using 67% of the data values for training and the remaining 33% for testing. Figure 9 shows the daily average for the training and testing wind speed, direction, and mechanical power. Knowing that the mechanical power can be predicted by the given equation (1) 38 :

Where:
Pm: Mechanical output power of the turbine (W)
Cp: Performance coefficient of the turbine
ρ: Air Density in kg/m3 (about 1.225 kg/m3 at sea level)
A: Rotor Swept Area in m2 = πr2 (r = radius or blade length = 9.8 m) = π × (9.82) = 301.72 m 2
Vw: Wind speed (m/s)
λ: Tip speed ratio of the rotor blade tip speed to wind speed
β: Blade pitch angle (deg)

Daily average for the training and testing wind speed, direction and mechanical power for season Spring 2021.
Table 1 shows different metrics for the average daily wind speed, direction, and mechanical power of the achieved model for training and testing.
2- The second scenario was to use all the wind data for the Spring season of 2021 as training data as shown in Figure 10. Then the wind data for April are reused as testing data as shown in Figure 10. In addition, by applying equation (1) to the predicted results, Figure 11 shows the daily average testing mechanical power. Table 2 shows different metrics for the achieved daily average training and testing data.
3- Finally, the model was examined using all the wind data for the full spring season of 2021 as training data as shown in Figure 10. Then, new wind data for May are used as testing data as shown in Figure 11. Again, by applying equation (1) to the predicted results, Figure 12 shows the daily average testing mechanical power. Table 3 shows different metrics for the achieved daily average training and testing data.
Metrics for the average daily wind speed, direction, and the mechanical power.

Daily average for the training wind speed, direction, and mechanical power for the season Spring 2021.

Daily average for the testing wind speed, direction, and mechanical power. April values were used for testing.
Metrics for the average daily wind speed, direction, and the mechanical power-April testing.


Daily average testing wind speed, direction, and mechanical power for May.
Metrics for the average daily wind speed, direction, and the mechanical power-May testing.

The metric values are shown in Tables 1 to 3 confirm the correctness of using the presented model for the Spring season.
Autumn season scenarios and results:
In this subsection, the same approach as in subsection A was followed.
1- The first scenario in this subsection was by using 67% of the wind data values for training and the other 33% for testing. Figure 13 shows the daily average training and testing wind speed, direction, and mechanical power from applying equation (1). Moreover, Table 4 shows the user training and testing metrics for the average daily wind speed, direction, and mechanical power of the achieved model.
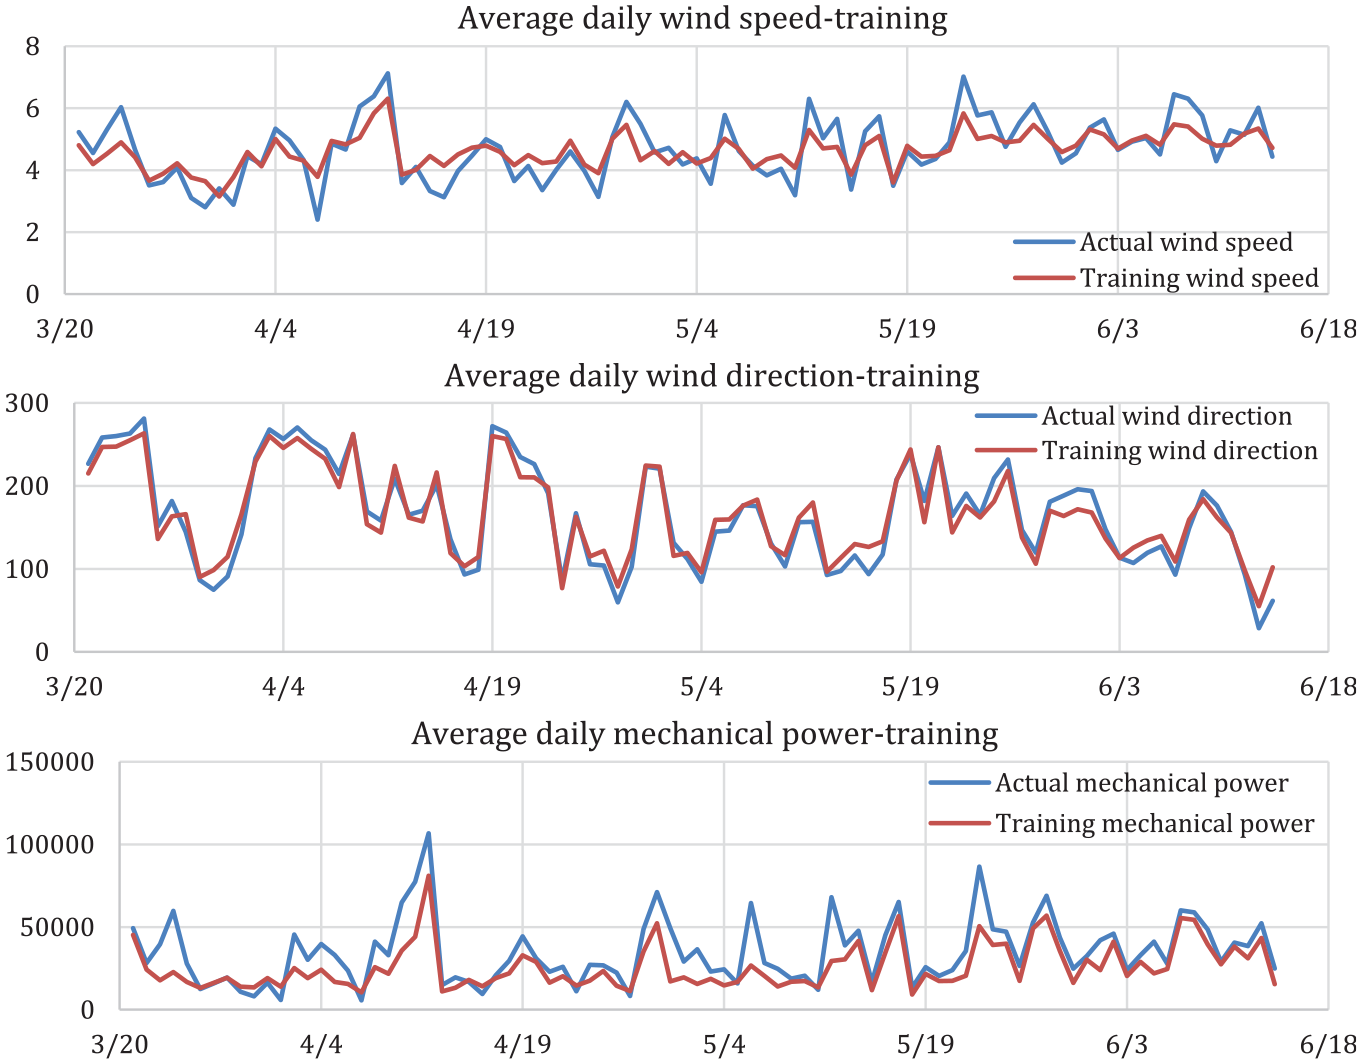
2- Next, the model was examined using the wind data for the full Autumn season 2021 as training data as shown in Figure 14. Then the wind data for October were reused as testing data as shown in Figure 15. In addition, by applying equation (1) to the predicted results, Figure 14 shows the daily average testing mechanical power. Table 5 shows different metrics for the achieved daily average training and testing data.
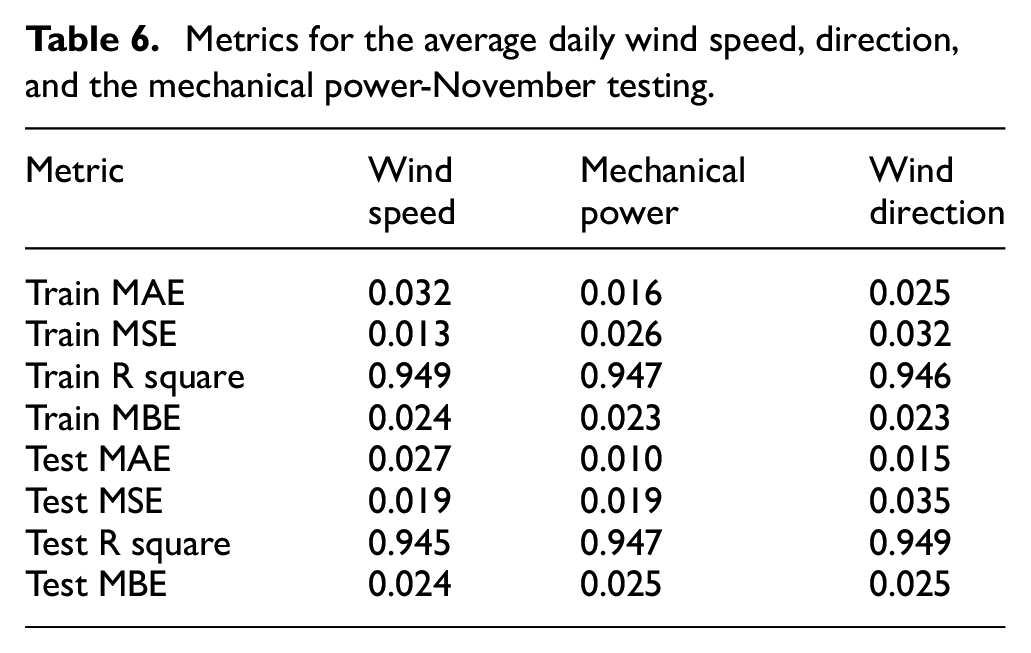
3- The last step was to examine the model of the wind data for the full Fall season of 2021 as training data as shown in Figure 14, then new wind data for November were used as testing data as shown in Figure 16. Moreover, by applying equation (1) to the predicted results, Figure 15 shows the daily average testing mechanical power. Table 6 shows different metrics for the achieved daily average training and testing data.
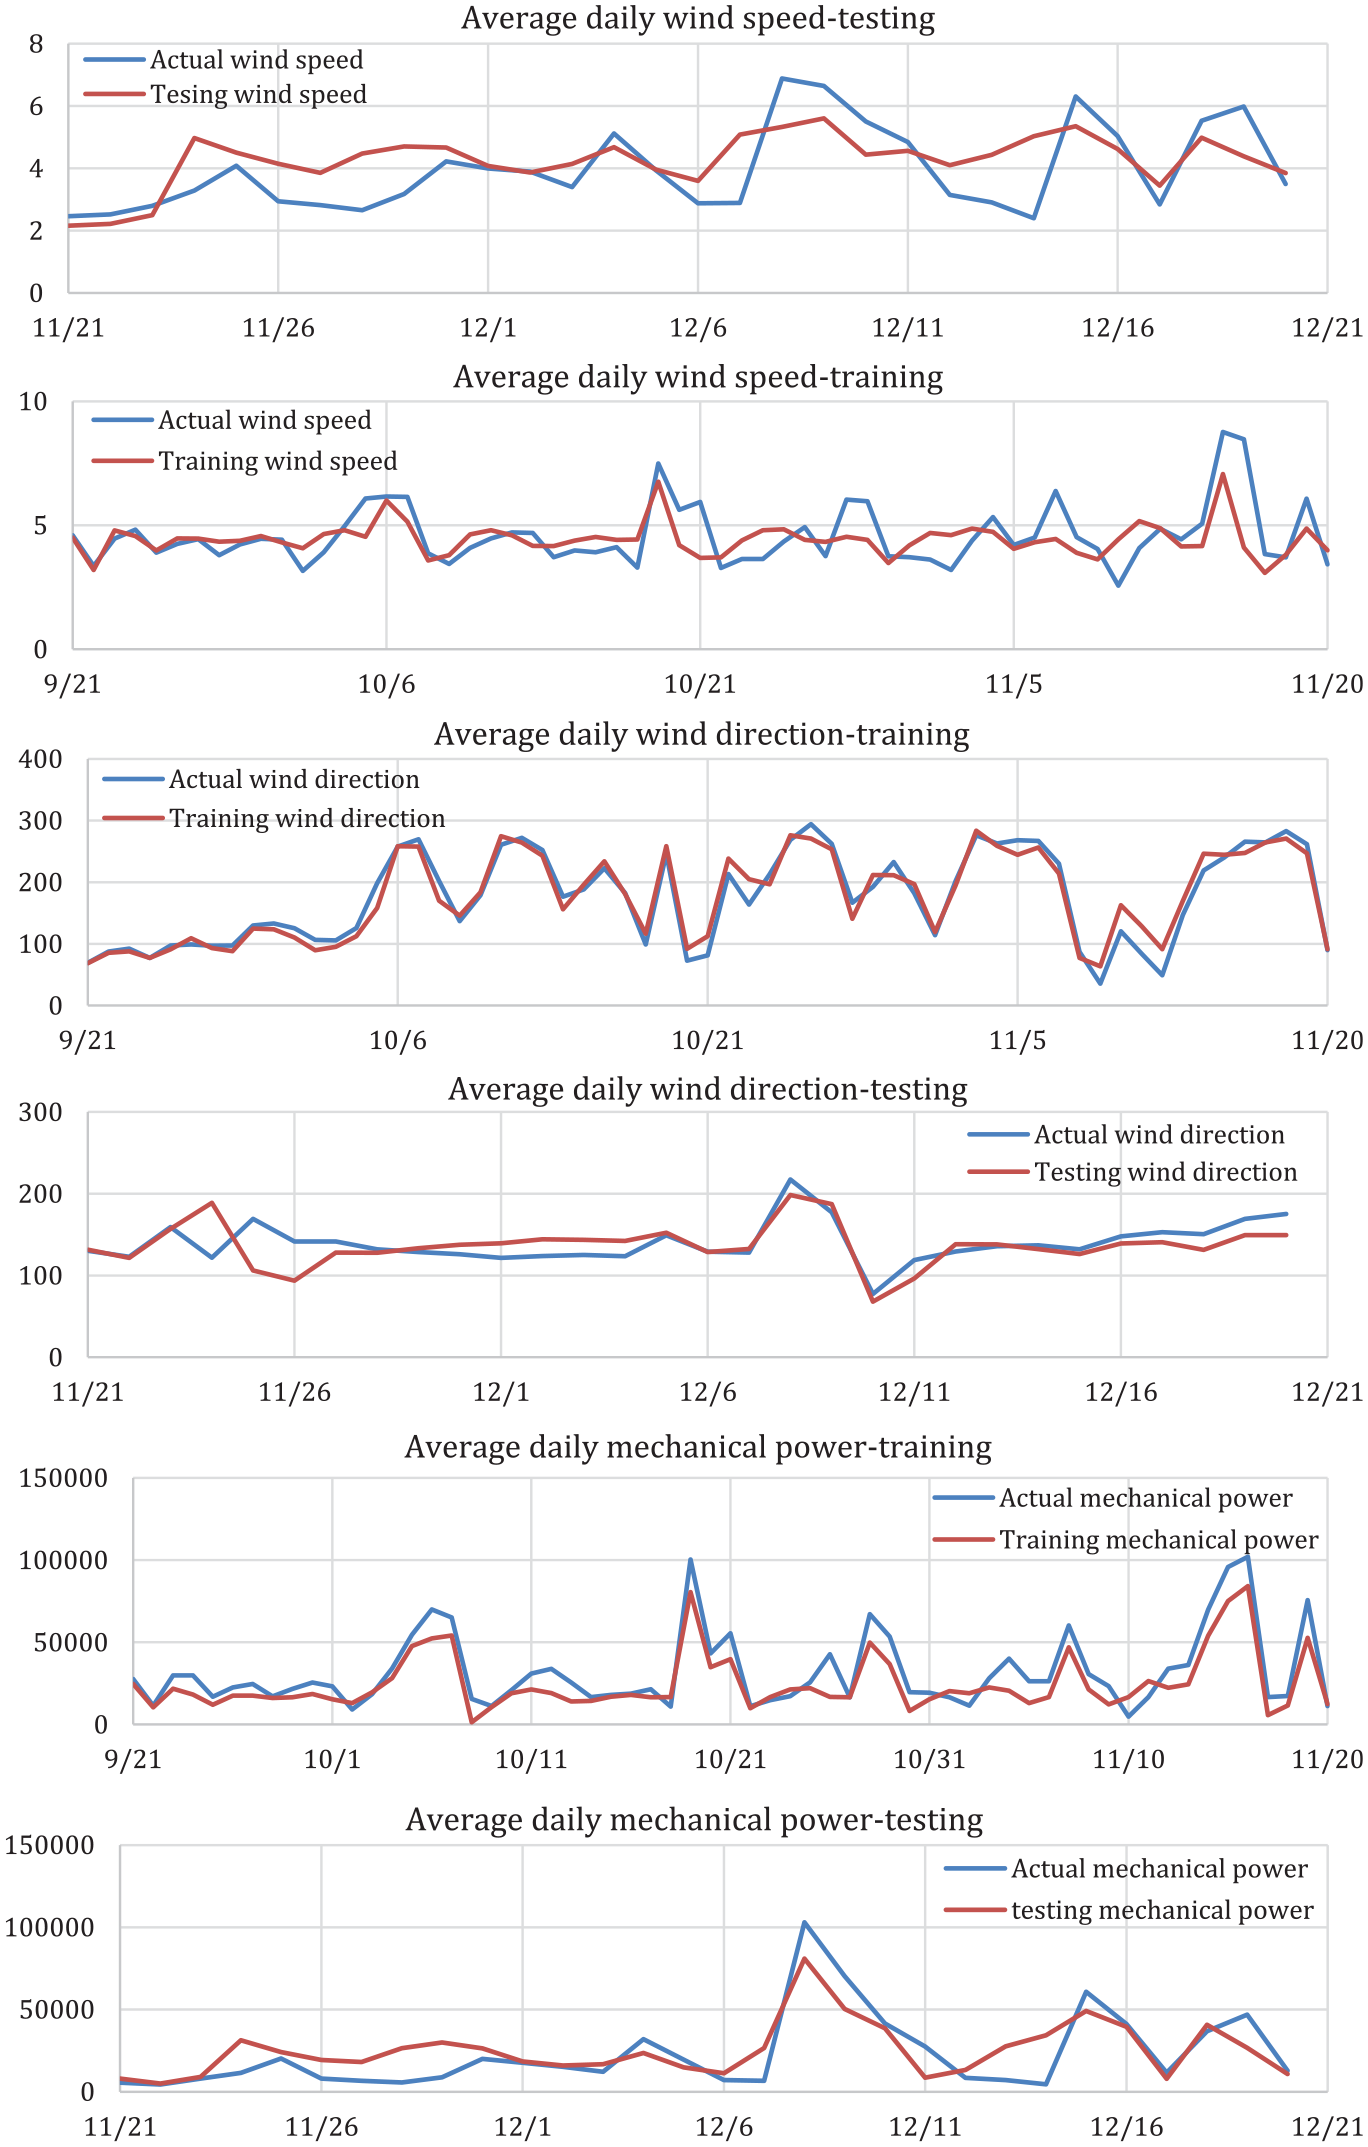
Daily average training and testing wind speed, direction, and mechanical power for season Autumn 2021.
Metrics for the average daily wind speed, direction, and the mechanical.


Daily average for the training wind speed, direction, and mechanical power for the season Autumn 2021.

Daily average for testing wind speed, direction, and mechanical power. October values were used for testing.
Metrics for the average daily wind speed, direction, and the mechanical power-October testing.


Daily average for testing wind speed, direction, and mechanical power. November values were used for testing.
Metrics for the average daily wind speed, direction, and the mechanical power-November testing.
The results in Tables 4 to 6, and those from subsection A, confirm again the robustness and correction of the presented model for both seasons.
Figure 17 shows a comparison of the resulting metrics used examine the reliability and validity of the results. The results show clearly that are nearly the same for both Spring and Autumn seasons. They show also R square test is about 0.95 and the average error (MAE, MBE, and MSE) are less than 3%.

Comparison between different metrics used in Spring and Autumn 2021.
To verify the correctness and accuracy of the results, the results were compared to the values found in Chen et al. 39 and in Noman et al. 40 The work in Chen et al. 39 proposed a hybrid machine-learning model for short-term wind prediction. A framework combining EEMD, GA, and LSTM for short-term wind speed prediction is proposed. While the work in Noman et al. 40 proposed a multistep short-term wind speed prediction. The presented work evaluated the performance of eight transfer learning methods. The work in both cases was for a very short period with higher error rates. This confirms the novelty and originality of this work since the work has more enhanced metric values. In addition, the presented model predicts wind speed, direction, and mechanical power for 48 h.
Discussion and conclusion
Wind energy is considered as a clean and cheap source of energy. The main purpose of this work was to deliver electric power to outlying areas with the best efficiency and the least cost by exploiting wind energy.
In this research, an LSTM based model was introduced to predict wind speed, direction and mechanical power. To achieve the best results, the presented model was evaluated using three different scenarios. As aforementioned, the wind speed of the chosen location is 6.9 m/s. This speed is capable to generate an average power of around 29,800 kW for the used wind turbine. According to the Palestinian Electricity Distribution Company and the Palestinian Central Bureau of Statistics, 41 the average annual household consumption of energy is between 3000 and 3600 kW/h. This number decreases significantly to 2000 kW/h in the isolated urban locations.
Also, knowing that the price of electricity in Palestine is relatively very high, such that it costs $ 0.19 kW/h. Consequently, this information leads to the following benefits:
1- The installation of one turbine may cover the needs of 10–15 households.
2- The total price of one turbine was about $64,000. So, the payback period can be calculated as follows:
The total estimated energy production = the predicted annual energy output × price of electricity
=29,800 × 0.19 = $5,662
Then the estimated payback period = 64,000/5,662 = 11 years
This period is very promising since the average payback period is about 15 years. 42 And that the average use of wind turbines is from 20 to 25 years. Consequently, the price of electricity is decreased by about 40% (if the turbine is used for 20 years)
3- The use of wind energy can guarantee lower emission of CO2 and thus lower pollution.
4- Since chosen locations are far from electricity distribution network infrastructure, the use of wind energy benefits these locations by providing them with a significant amount of their electricity needs.
Consequently, the results of the experiments were very promising and the used performance metrics showed the robustness and correctness of the proposed model. With such results, the presented model can be used to predict wind energy feasibility in new areas. Moreover, the results showed how wind energy can help to decrease global warming and climate changes, by decreasing the reliance on traditional power generation techniques.
The next step of this work is to the use of further conversion models. Hence, mechanical power can be transferred to electrical power. This can contribute to estimate the development and installation of electrical systems cost based on wind energy.
Footnotes
Acknowledgements
The author would like to acknowledge An-Najah National University (ANNU) for its financial support to carry out this project (number ANNU-2021-Sc001).
Handling Editor: Chenhui Liang
Declaration of conflicting interests
The author(s) declared no potential conflicts of interest with respect to the research, authorship, and/or publication of this article.
Funding
The author(s) disclosed receipt of the following financial support for the research, authorship, and/or publication of this article: “This research was funded by An-Najah National University, grant number ANNU-2021-Sc001.”