
Abstract
Aero-engine electrostatic monitoring technology (EMT) is a novel and effective condition monitoring technology. With the help of EMT, effective monitoring of early failures can be achieved. Since the electrostatic monitoring of the running engine will be strongly interfered, the sampled electrostatic signal has various noise components and low signal-to-noise ratio (SNR). After analyzing the source of the noise components carried by the electrostatic signal, this paper proposes a method for electrostatic signal denoising in a strong interference environment, which is based on the nonlinear total variation theory. In the experiments, the simulated electrostatic measurement signal and the actual test-run electrostatic measurement signal were used as the analysis objects, and the denoising test was carried out by using the proposed method. Meanwhile, the denoising effect was compared and analyzed with other classical methods. The experimental results show that the proposed denoising method can effectively remove random noise, electromagnetic pulse and periodic noise in electrostatic signal, and is more applicable to the measured electrostatic signal with low SNR than the classical electrostatic signal denoising methods such as wavelet threshold denoising method and empirical mode decomposition method.
Keywords
Introduction
The aero-engine is one of the most important components in an aircraft, and its operational reliability is related to the flight safety of the aircraft. The harsh operating environment of an aero-engine makes effective condition monitoring technology an inevitable requirement for modern aero-engine fault prediction and health management system. 1 Traditional condition monitoring techniques based on the principle of temperature, pressure, and vibration monitoring are insensitive to early faults because they measure the secondary effects of faults. Electrostatic monitoring technology (EMT) is a condition monitoring technology based on the principle of electrostatic induction, which directly measures the direct product of faults − charged particles − and thus has a strong ability to detect early faults. Due to its sensitivity to early faults, EMT is becoming an important component of the new generation of aero-engine fault prediction and health management (PHM) systems. 2 It is worth noting that because the electrostatic sensor is extremely sensitive, the sampled electrostatic measurement signal will have a low signal-to-noise ratio (SNR) due to the strong interference when electrostatic monitoring is performed on an on-wing flying aero-engine. This will not be conducive to the use of electrostatic signal for subsequent failure prediction and the development of aero-engine health monitoring. In general, it is necessary to carry out the research on the denoising method for electrostatic signal with low SNR.
For the removal of interference components such as high-frequency electromagnetic radiation, power frequency noise, random noise, electromagnetic pulse, and periodic noise carried in the electrostatic signal, a variety of electrostatic signal noise filtering methods have been proposed in more studies. Digital power frequency filter 3 is often used to filter power frequency noise, which is essentially a band-stop filter with a high trap depth. A specific digital low-pass filter is generally designed to remove high-frequency electromagnetic radiation interference components from electrostatic signal. Adaptive digital filter based on frequency tracking can be applied for the removal of periodic noise and power frequency noise caused by vibration, 4 but it has poor algorithmic stability and filter convergence. Median filtering is often used to remove electromagnetic pulses from electrostatic signal. Meanwhile, there are many denoising methods applicable to the removal of random noise from electrostatic signal, such as independent component analysis (ICA), 5 empirical mode decomposition (EMD) and its improved algorithm, 6 wavelet thresholding denoising (WTD) method based on wavelet theory, singular value decomposition (SVD) denoising method, 7 sparse decomposition (SD) based denoising algorithm 8 and so on.
However, the ICA algorithm needs to calculate high-order statistics, and the algorithm complexity is high, which cannot be applied to the real-time denoising of electrostatic signal in online electrostatic monitoring. When EMD and its improved algorithm are applied for random noise filtering, it is often accompanied by mode confusion. The WTD method is suitable for the denoising of a variety of one-dimensional signals, but due to the diversity of noise components of electrostatic signal, it is impossible to determine the wavelet basis function that can retain the electrostatic induction pulse signal well. when a certain wavelet basis function is similar to the time-domain signal waveform of the electrostatic induction pulse signal, it also affects the flexibility of the WTD algorithm. The SVD denoising method only selects some of the signal components with large singular values as pure signal components for reconstruction, and the number of selected singular values is difficult to be determined adaptively. when using the denoising algorithm based on SD for electrostatic signal denoising, it is difficult to determine the optimal sparsity of signal reconstruction adaptively, and the denoising effect is greatly influenced by the sparsity.
In summary, the existing electrostatic signal denoising method is difficult to be applied to the real-time denoising of the raw electrostatic measurement signal with low SNR under strong interference during aero-engine on-wing flight. Aiming at the problem of denoising electrostatic signal with low SNR, this paper proposes an electrostatic signal denoising method based on nonlinear total variation.
The subsequent sections are organized as follows. In Section 2, the methodology of this paper is introduced. In Section 3, the simulation experiments and the test-run experiments carried out in this paper are introduced, and the results of the denoising experiments are presented. In Section 4, the experimental results are discussed in detail. Finally, the main conclusions of this paper are concluded in Section 5.
Methodology
In order to conduct a study of electrostatic signal denoising methods, it is natural to think that the source of its noise needs to be analyzed in detail first. Then the filtering method of the main noise components are studied. Considering that the total variation theory can realize anisotropic smoothing of images in 2D images. By analogy to one-dimensional signals, the application of total variation theory should be able to achieve selective smoothing of electrostatic pulse signals and noise components.
Analysis of noise sources
There are many external interference noise of electrostatic signal, including electrical noise9,10 caused by electric, magnetic, and electromagnetic fields; and mechanical noise 11 due to piezoelectric effect, triboelectric effect, etc.
In the electrostatic measurement system, power lines are ubiquitous, so power line interference is also widespread. And in severe cases will directly lead to the inability to effectively measure the electrostatic signal. Power line interference 9 is mainly reflected in the following aspects:
Surge noise, 9 which refers to the instantaneous overvoltage that exceeds the normal operating voltage, is a kind of severe pulse that occurs in a very short time. A short circuit in the power supply circuit will cause a surge voltage in the working circuit of the measurement system. In severe cases, the amplitude of the interference pulse is up to thousands of volts. The duration of surge pulses is usually short, mostly in the order of μs. The measurement equipment is powered by the 220 V power line at mostly situation. The interference pulses will be introduced into the detection circuit through the power supply system, resulting in distortion of the detection signal and even damage to the measurement equipment.
Power frequency noise. 9 As long as there is power supply, power frequency electromagnetic field is ubiquitous. The power frequency electromagnetic field usually produces 50 Hz and its multiples of interference noise in the detection circuit, the interference waveform is usually a sine wave. Power frequency electromagnetic field can affect various electrical and electronic devices to varying degrees. In the electrostatic sensor, the power frequency will be introduced into the electrostatic signal through metal connectors, power lines, etc., which will seriously drown the inductive pulse signal in the electrostatic signal and affect the normal measurement of the sensor.
Radio frequency (RF) noise 9 is often generated by electromagnetic radiation sources such as various radars, very high frequency (VHF) communication equipment, and secondary radar transponders that are widely present in the sensor monitoring site. In addition, there is a wide range of parasitic radiation that will also cause RF radiation interference. RF noise has a wide frequency range, usually range from hundreds kHz to thousands kHz. The transmission wire in the electrostatic measurement system can be regarded as a receiving antenna, which accepts RF noise in the space to varying degrees.
In addition to electrical noise, there are also many noises due to mechanical causes. In a vibrating environment, the circuit boards, wires, and contacts of electronic components of the detection circuit will cause a certain amount of electrical noise. Electrical noise caused by vibration can be divided into two types according to its mechanism, including triboelectric effect and piezoelectric effect.
Triboelectricity is the phenomenon of electrification that is accompanied by charge transfer due to the contact separation of two objects. During the bending process of the wire, the relative motion between its inner and outer layers causes the frictional electrification effect. When the measurement signal is a weak signal, the charge generated in the wire due to frictional electrification will cause serious interference to the measurement signal. Studies 11 have shown that when a 1 m long coaxial wire is bent, the maximum voltage generated by friction between its inner and outer layers can reach more than 5mV.
There are some commonly used insulating materials with certain piezoelectric effect, such as ceramic insulator, tetrafluoroethylene, quartz, and other materials. In a vibrating environment, these insulating layer materials will generate a noise voltage due to the piezoelectric effect.
In summary, it is believed that the noise components in electrostatic signal can be broadly classified as power frequency noise, random noise, 10 electromagnetic pulse, 9 and periodic noise 11 generated by the influence of mechanical signals such as vibration. This section focuses on the research on the filtering technology of noise components such as random noise, electromagnetic pulses, and periodic noise in electrostatic signal of low SNR.
Electrostatic signal denoising method based on total variation denoising
Rudin et al. 12 proposed a nonlinear denoising method based on the total variation theory, which is often used for the denoising of two-dimensional discrete signals such as seismic signals and digital images, 13 etc. This section considers its application in the field of one-dimensional electrostatic signal denoising and calls it the TVD algorithm.
The measurement signal y with noise can be expressed as y = x + s, where x is the pure signal, s is the noise component, and the dimension is m × 1. The basic principle of the TVD algorithm is: when the measured signal is a known one-dimensional vector, an estimate xp of the pure signal can be constructed, which can make the measurement functional between x and y obtain the minimum while making the weighted total variational L1 norm of x obtains the minimum value, and the weight can be called a regularization parameter. So the optimization problem solved by the algorithm can be expressed as equation (1). Where Dx is the first-order difference vector of vector x, D is the matrix shown in equation (2), and the value of the regularization parameter is λ > 0.


By introducing the variable z∈

By solving the primal-dual problem shown in equation (3), an estimate vp of the dual variable can be obtained, and then the solution xp of the primal problem can be obtained from equation (4).

Equation (3) shows a convex quadratic programing problem, which can be solved using the primal-dual interior-point method (PDIP).14,15 The Karush-Kuhn-Tucker (KKT) condition 16 shown in equation (5) needs to be satisfied in order for there to be an optimal solution to the primal-dual problem shown in equation (3).
Where rpri, rdual, and rcent denote the primal residual, dual residuals, and central residuals, respectively, and θ∈
By solving equation (6), the Newton step Δp is shown in equation (7).

In summary, the pseudo code of TVD algorithm is shown in Algorithm 1. Where iter is the maximum number of iterations; η is the primal-dual gap; μb is the barrier parameter and μb > 1; s is the backtracking linear search step, s∈[0,1]; α and β are the backtracking parameters, α and β∈(0,1); ϵ and ϵfeas are the tolerances, which usually ranging from 10−3 to 10−8.

It is worth noting that the time complexity of the TVD algorithm presented in this paper is O(n), which is linear, so it is suitable for real-time denoising requirements in the actual on-wing electrostatic monitoring.
Experiment and results
Denoising experiment of simulated electrostatic measurement signal
In this section, in order to verify the denoising effect of the proposed algorithm, the simulated measurement signal when particles with different charge quantity pass through the sensor at different times and the actual noise signal with random noise, electromagnetic pulse, and periodic noise in the actual test are mixed to construct the simulated test signal shown in Figure 1, where the sampling frequency is 2 kHz.
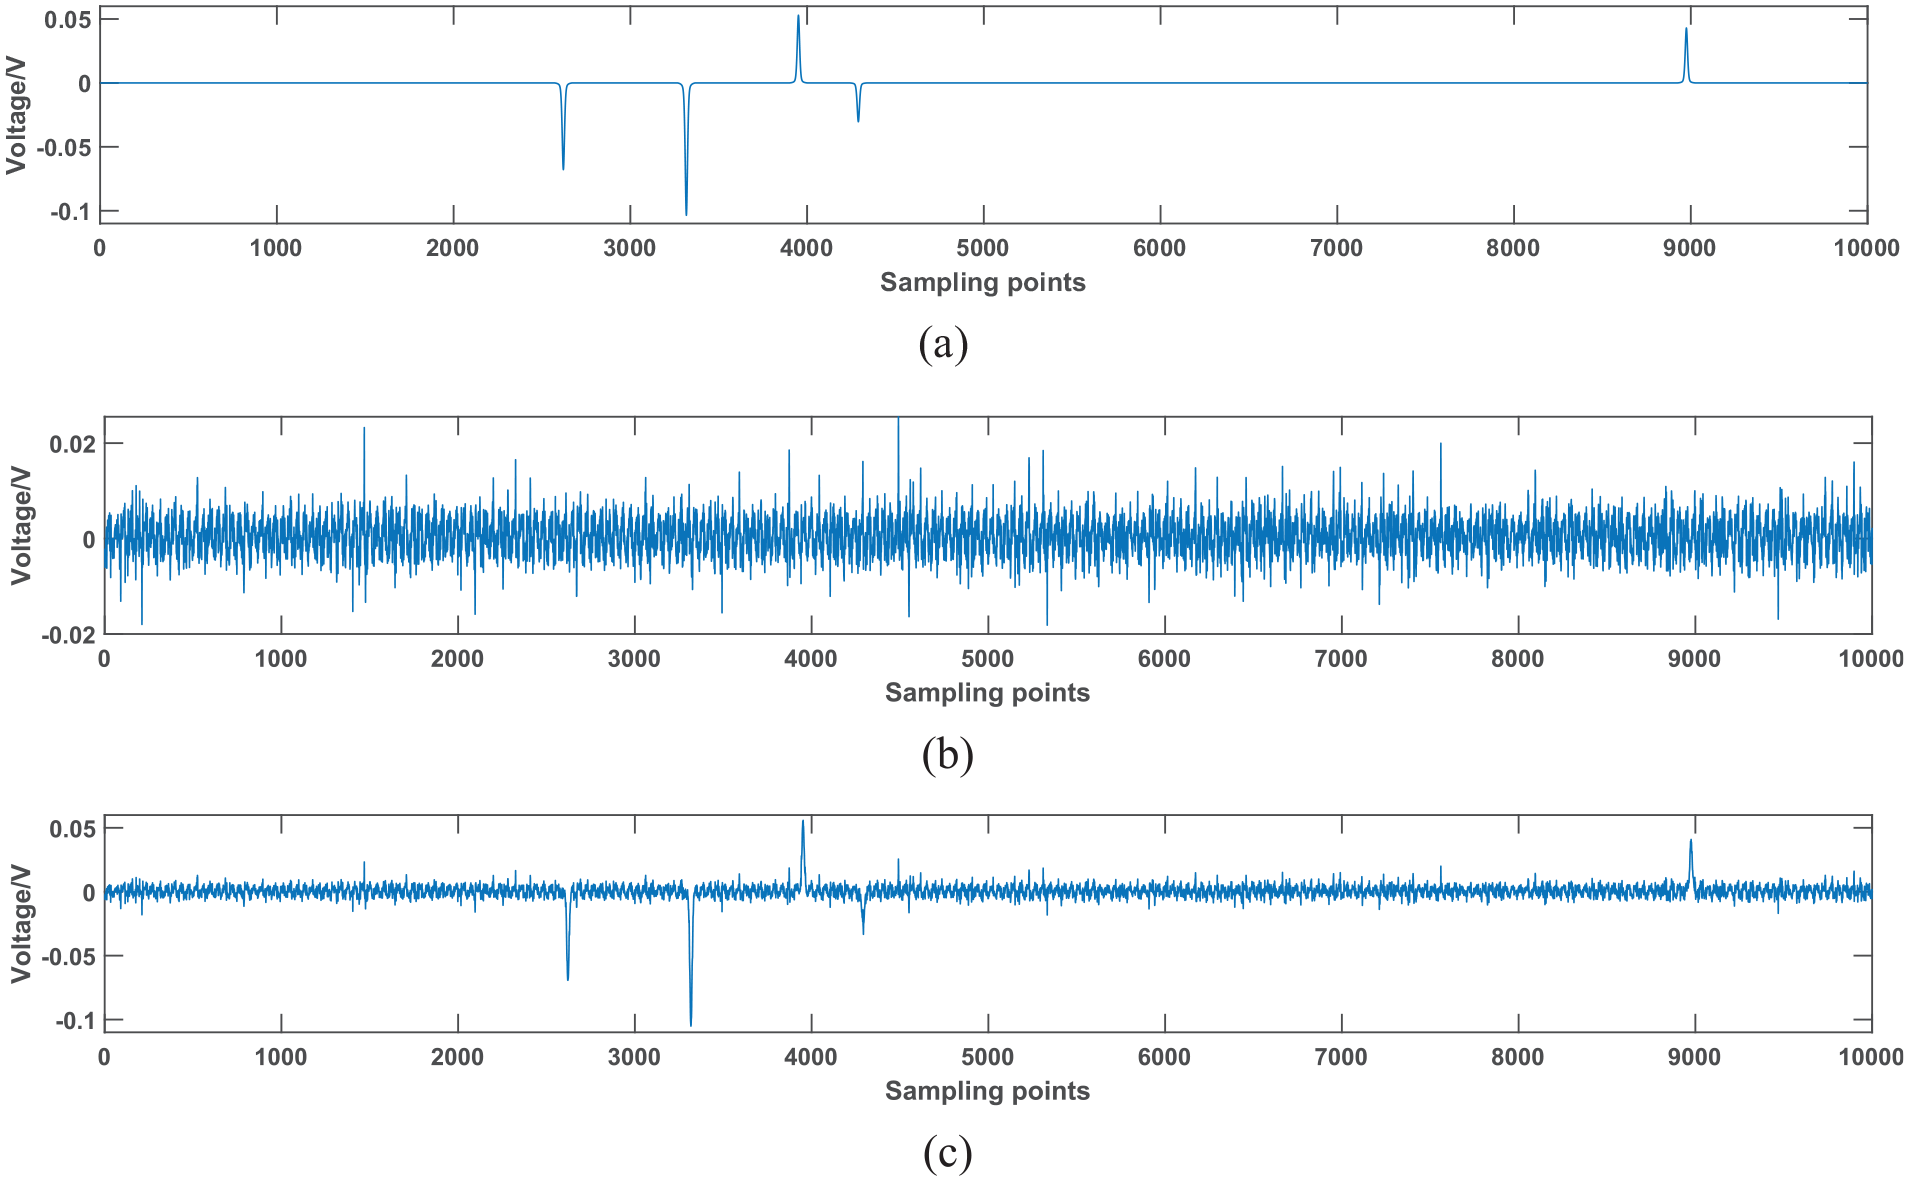
Simulated test signal: (a) pure signal, (b) noise, and (c) mixed signal.
The commonly used SNR, root mean squared error (RMSE), peak signal-to-noise ratio (PSNR) are selected as the evaluation indicators of the denoising algorithm. SNR is able to qualitatively describe the average noise intensity of a segment of signal globally. In contrast, PSNR emphasizes more on characterizing the extent to which the peak feature of the signal are submerged by noise locally. In the case of applying signal peaks as feature parameters for subsequent diagnosis or monitoring, the merit of the PSNR is more important. RMSE is a quantitative description of the noise removed which generally reflects the absolute amount of noise removed by a denoising algorithm.
SNR, PSNR, and RMSE can be calculated by equations (8), (9), and (10), respectively. Where x denotes the pure signal, xd denotes the denoised signal, and N is the number of sampling points.


In addition, the ability in maintaining the integrity of the time-domain pulse waveform of electrostatic signals is also a important aspect of evaluating denoising algorithm. The similarity (SIM) of the signals is defined as the Pearson correlation coefficient 17 to indicate the similarity of waveform before and after denoise, which is shown in equation (11).

This section introduces three commonly used signal denoising algorithms: (I) WTD; (II) improved ensemble empirical mode decomposition (EEMD) algorithm; (III) Savitzky-Golay (S-G) filter. In this section, with the help of simulated signals, a comprehensive comparison between the (IV) TVD algorithm and the commonly used denoising algorithms is carried out.
In the WTD method, the sym4 wavelet basis function, which is most similar to the induced pulse signal, is selected to perform a five-layer wavelet decomposition of the electrostatic signal and a soft thresholding method is used for denoising.
For the electrostatic signal, the S-G filter which uses a fifth-order polynomial for smoothing is selected, and the window length of the S-G filter is 51 sampling points.
Inspired by a denoising method for ship radiated noise based on Spearman variational mode decomposition (VMD) proposed by Yang et al.,
18
the empirical modes obtained from EEMD decomposition are subjected to discrete entropy (DE) calculation, and the modes are determined to be noise-dominated or pure signal-dominated according to the DE value, then S-G filter is applied to the noise modes and WTD is applied to the pure signal modes, and finally all modes are reconstructed to obtain the denoised signal; in this section, the parameters of TVD algorithm are set as λ = 0.036,
The four denoising methods are used to test the simulated signal shown in Figure 1(c), and the denoising effect is shown in Figure 2.

Denoising effect of applying denoising algorithm to simulated test signal: (a) WTD, (b) S-G filter, (c) improved EEMD, and (d) TVD.
Some of the test results of constructed several simulated test signals with different SNR by applying the denoising methods from (I) to (IV) are shown in Table 1, and the optimal results achieved in each test are marked in bold. In the simulation experiment of Table 1, we respectively constructed the pure electrostatic signals with several pulses with different amplitudes and appearing at the random time sequence points of the signals, pulsed number is varying from 6 to 9 and signal amplitudes range from −0.1 to 0.1 V. Then superimposed a certain intensity of noise on them to obtain the test signals, so that the constructed test signals have the characteristics of low SNR. According to the definition of SNR, when the power of the signal is less than the power of the noise, the valve of SNR will be negative, which means that the noise component in the mixed signal is higher than that of the pure signal, describing a situation where the pure signal is interfered by strong noise. The results in Table 1 also reflects an advantage of the proposed algorithm, that is, it can still have a good denoising effect for the signal interfered by strong noise.
Parts of the simulation test results.
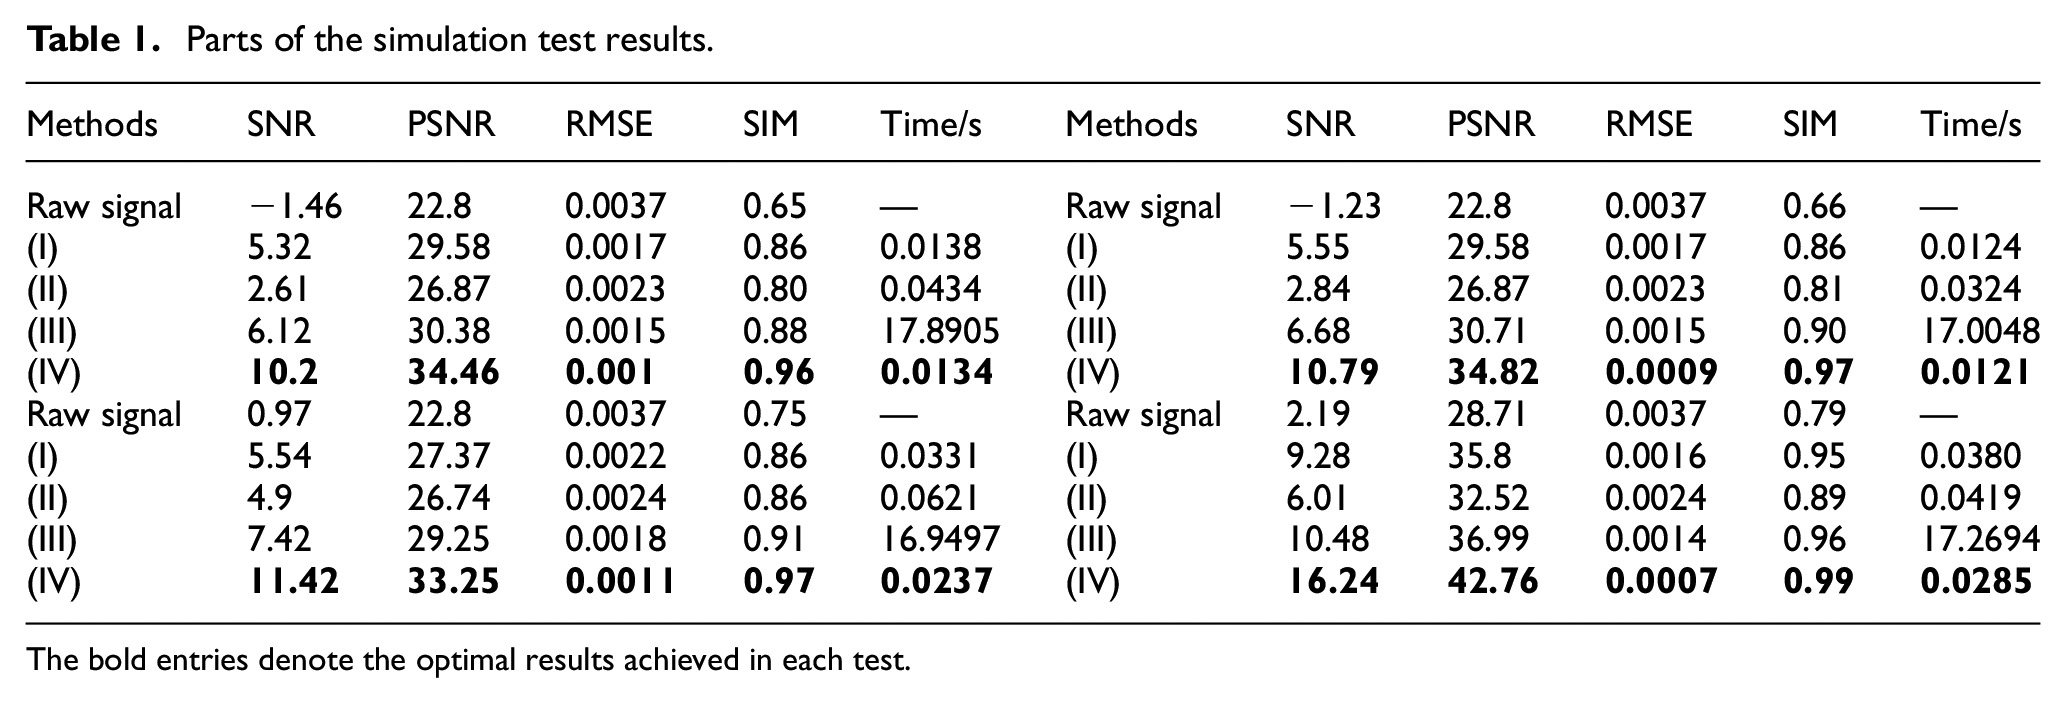
The bold entries denote the optimal results achieved in each test.
By the way, the algorithm tests in this paper are all carried out by programing under the integrated development environment of MATALAB R2018b on a computer equipped with an AMD Ryzen 7 3700X 8-core processor with a base clock frequency of 3.6 Ghz.
Denoising experiment of actual electrostatic measurement signal in aero-engine test-run experiment
The Rolls-Royes RB211 civil turbofan aero-engine was used for test-run electrostatic monitoring. In the test-run experiment, the electrostatic sensor was embedded in the exhaust nozzle of the low-pressure turbine, and the location of the probe was about 300 mm behind the outlet of the low-pressure turbine, which could effectively detect the electrostatic signal of the exhaust gas after combustion. The weak electrostatic signal is induced by sensor, then it is transmitted to the charge amplification circuit through the three coaxial cable. The signal conditioning circuit amplifies the weak charge signal into voltage signal in proportion. The data acquisition device sampling the voltage signal at a sampling frequency of 2 kHz and transmits it to the computer through the PXI bus. The test bench and the electrostatic sensor on-board installation architecture is shown in Figure 3. And Figure 4 shows the schematic diagram of electrostatic measurement systems.

Schematic diagram of electrostatic monitoring test-run test bench: (a) RB211 test-run test bench and (b) on-board installation of electrostatic sensor.

The schematic diagram of electrostatic measurement systems.
In a test-run experiment, after the RB211 aero-engine was successfully ignited and started, it entered the stable state of low idle. The operation stages of high and low idling rating, rapid acceleration, rapid deceleration, and take-off power tests as shown in the Figure 5 were carried out. And the electrostatic signals at all working stages of the full performance test-run experiment were acquired.
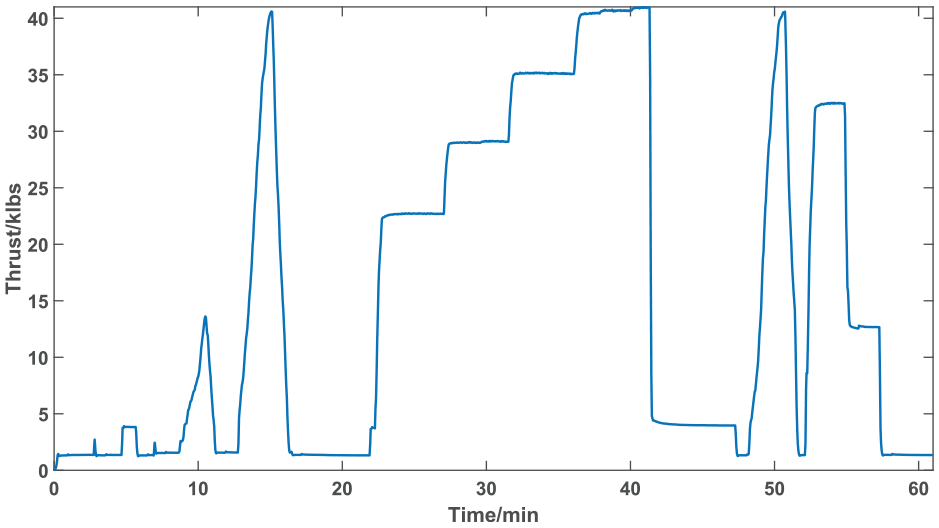
1 h spectrogram test of RB211 aero-engine test-run experiment.
As shown in Figure 6(a) for a segment of the raw electrostatic signal in the high idling rating with the fan at high speed during the aero-engine test-run experiment, it can be observed that the SNR of the sampled electrostatic signal is low due to the very harsh exhaust environment of the aero-engine. In this section, we use signal denoising methods (I)−(IV) to denoise the actual electrostatic measurement signal in the test-run experiment, and the denoising effect is shown in Figure 6(b) to (e).

Denoising effect of applying denoising algorithm to actual test-run electrostatic signal: (a) raw electrostatic signal, (b) WTD, (c) S-G filter, (d) improved EEMD, and (e) TVD.
Discussion
It can be observed from Table 1 that the TVD method achieves the optimal SNR, PSNR, RMSE, and SIM when the simulated signal is denoised; and when the SNR of the raw signal is low, the TVD method significantly outperforms the remaining three signal processing methods, which indicates that the electrostatic signal denoising algorithm proposed in this paper can be better applied to the electrostatic monitoring under strong interference environment.
Combined with the results in Figures 3 and 6 and Table 1, it can be seen that the TVD method outperforms the other denoising algorithms significantly in both the simulated and actual measured signals. The comparison between Figures 3 and 6 shows that the TVD method can achieve good denoising effect in both simulation test and test-run experiment. However, in the test-run, due to the influence of the thrust control state, the denoising effect during the process of thrust level change is slightly worse than that in the simulation. The TVD method can denoise low SNR electrostatic measurement signals that are heavily interfered with high robustness. Moreover, the TVD method has a unique advantage in maintaining the integrity of the signal waveform, which can facilitate the subsequent accurate identification of the electrostatic signal pulse peaks.
In addition, in each denoising test, the linear time complexity of the TVD algorithm makes its running time significantly shorter than that of the signal denoising method (III), slightly shorter than that of the signal denoising method (I), and close to that of the signal denoising method (II). This indicates that the electrostatic signal denoising method proposed in this paper has good real-time performance and has the potential for on-board application.
Conclusion
For on-wing electrostatic monitoring of aero-engines, this paper analyzes the types and sources of noise interference of electrostatic measurement signals at first. Aiming at the denoising problem of the low-SNR electrostatic measurement signal in on-wing electrostatic monitoring, a new denoising method based on nonlinear total variation is proposed. In this paper, the proposed method is verified by simulated and actual test-run electrostatic signal, and compared with some other signal denoising methods such as WTD, S-G filter, improved EEMD method, etc. SNR, PSNR, RMSE, and SIM are used as indicators to evaluate the denoising effect of the denoising algorithm. The results of the simulated and the measured signal denoising analysis show that the proposed method has unique advantages in the denoising performance, the integrity of the waveform feature retention in the time domain and the real-time performance of the algorithm for low SNR electrostatic signals under strong interference, which are significantly better than the existing commonly used electrostatic signal denoising methods. In general, the proposed low-SNR electrostatic signal denoising method based on nonlinear total variation has the potential for on-board applications.
For the on-board application of the proposed algorithm, more abundant electrostatic monitoring test-run experiments will be carried out using jet aero-engine such as turboshaft, turboprop, and turbojet. The subsequent research will be conducted in the direction of further improving the real-time performance and denoising performance of the proposed algorithm by adding a priori knowledge to the constraints using the characteristics of the electrostatic signal.
Footnotes
Handling Editor: Chenhui Liang
Declaration of conflicting interests
The author(s) declared no potential conflicts of interest with respect to the research, authorship, and/or publication of this article.
Funding
The author(s) disclosed receipt of the following financial support for the research, authorship, and/or publication of this article: This work was supported by the National Natural Science Foundation of China (Grant No. U1933202).